Munich Personal RePEc Archive
Research Clusters and Technology
Diffusion
Deng, Paul
Copenhagen Business School
28 April 2011
Online at
https://mpra.ub.uni-muenchen.de/51164/
0
Research Clusters and Technology Diffusion:
The Case of China
Paul Deng
Department of Economics Copenhagen Business School
This draft: April 28, 2011
For review and comments only Do not cite without permission
Abstract
Much of the debate over income convergence hinges on whether technology diffusion is “global” or “local”. In this paper, I address this question in a developing country setting and focus on the role of major research clusters in promoting domestic technology diffusion. I identify four de facto research centers in China and investigate whether the effect of R&D spillovers from these research clusters is related to both geographic and
technological distances. I find that firms’ productivity gains from R&D spillovers from
the research cluster decline with (i) increasing geographic distance away from the research cluster, and (ii) the technological gap between technology senders and recipients.
JEL classifications: O3, O4, O18
1 1. Introduction
Ever since Robert Solow presented his seminal finding regarding the central importance
of technology in driving long-term economic growth, technology and its diffusion
mechanism have occupied the center stage of economic development. One of the key
issues remaining unresolved is whether technology and knowledge spillovers are global
or local.1 If technology spillover is global, poor countries (regions) are more likely to
catch up with rich countries (regions). However, if technology spillover is local, the
outlook for world development is much less optimistic. Rather than income convergence,
we are more likely to observe a diverging growth pattern between poor and rich countries
(or regions).
The question is not a settled one in economics in part because economic theory
offers no clear predictions as to the scope of technology spillover. On one hand, there is
every reason to believe technology diffusion is global, either through international trade
(Feenstra, 1996; Keller, 2002b) and foreign investment, or through freer labor migration,
better transportation and telecommunications, especially in the age of the Internet (see,
for example, Glaeser and Kohlhase, 2004). Thomas Friedman, in his popular book
(2006), “The World Is Flat”, famously documented how the Internet and other modern
logistic advances have fundamentally changed the world trade and the way multinational
firms operate. It is plausible that with transportation and communications costs reduced
to a much lower level than before, distance does not matter any more for technology
diffusion. On the other hand, factors such as superior infrastructure, better opportunities
1 “Global” means technology diffusion is not limited by distance; in contrast, “local” means technology
for exchanging ideas, and better institutions all attract highly skilled labor force to work
and live in certain area;2 these factors tend to produce large disparities in both technology
and income across different regions and countries (see for example, Jacobs, 1970;
Glaeser, 2007). As for developing countries, poor infrastructure, ill-designed government
policies and weak institutions could also slow down or block the technology diffusion
process (Easterly 2002). Adding to the severity of the problem is the high correlation
between quality of infrastructure-institutions and country’s level of development. The
existence of these impediments in the technology diffusion process increases the
possibility that income divergence may happen even when technology and knowledge are
readily available to the general public. In short, arguments on both sides seem to be
sensible. With little comfort from established theories, the answer to the question
ultimately goes to empirical test with data in the real world.
When it comes to empirical research on the scope of technology diffusion, most
research focuses on spillovers across rich countries (e.g. Keller, 2002; Eaton and Kortum,
1999; Coe and Helpman, 1995), or on spillovers within a developed country (e.g. Adams
and Jaffe, 1996). And they generally confirm that distance does matter. However, there
is a serious lack of research in both technology spillovers between rich and poor countries,
and spillover within a developing country setting. Given the importance of
technology-knowledge transfer to the welfare of the poorer countries and how little we know about
the diffusion mechanism at the micro-level, the absence of relevant research should long
have been rectified. In this paper, I intend to address the dearth of research in this area
by investigating empirically how the productivity at the firm level is affected by the
technology spillovers from the key R&D research clusters within China. Specifically, I
am interested in finding out whether the productivity gains from technology spillovers
decline with increasing distance, both in geographic and technological sense, between
technology senders (research clusters) and recipients (firms). The research clusters in our
research are defined as a bundle of firms performing R&D located within a major city. I
focus on research clusters because it is widely believed that technology centers, like
Silicon Valley in the U.S., have generated large positive externalities from their
technological innovations, and firms closer to the cluster have enjoyed relatively high
productivity gains.
I ask two related questions in this empirical analysis. The first question is
whether technology spillovers from R&D research clusters are affected by the
geographic distance between research clusters and firms. Unlike other research that
focuses on patent citations in their research on technology spillovers (see Jaffe et al. 1993;
Griffith et al. 2007), I use measures of firm-level labor productivity to assess the impact
of technology spillovers from the research cluster. For technology diffusion to be local, I
expect to observe a negative relationship between the effect of technology spillovers and
increasing distance. However, if technology diffusions are global, I expect to find no such
pattern.
The second question I ask is whether technology diffusion not only depends on
geographic distance, but also depends on technological distance. Firms’ relative position
on the technology ladder affects the effectiveness of their technology adoption. The
smaller the technology distance between technology senders and recipients, the more
effective the new technology will be utilized by receiving firms. Easterly (2002) argues
individuals and firms. Institutions that are designed poorly or operate inefficiently will
create fewer incentives for firms to absorb the existing technology, causing firms to lag
further behind. Our definition of technological distance captures both the technology
level and the institutional environment in which firms operate.
Here is a preview of my research findings. First, I find that geographic distance
does matter: with increasing geographic distance between research clusters and firms, the
effect of R&D spillovers from research clusters declines. Distance also matters in a
technological sense. I find that the impact of R&D spillover decreases with increasing
gap between the average productivity at research clusters and the average productivity of
firms that are located in the same city. The rest of the paper is organized as follows. In
Section 2, I describe the research data, how I identify China’s research clusters and the
main characteristics of these research centers. In Section 3, I introduce the empirical
models and estimation strategies. This is followed by the analysis of the main regression
results in Section 4. Then final section concludes.
2. Data
For this empirical research, I use the firm-level data out of China’s Large and
Medium-Size Enterprises (LME) database provided by National Bureau of Statistical
(NBS) of China. The LME database includes over 20,000 firms per year, on average, and
spans the years from 1995 to 2004. The database is one of the most comprehensive
micro-level databases in China. In 2002, the total output of the sample firms in the
2.1 Where are China’s research clusters?
To spur regional economic growth and promote technology transfer, since the
early 1990s, governments in China, both at the central and local levels, have established
dozens of so-called “Technology Parks” in numerous cities. With concentrations of
technology-intensive firms, some of these parks exhibit features very similar to Silicon
Valley in the U.S. But the true nature of the majority of those parks is not clear. Do
firms inside these parks truly engage in R&D activities? Or were these firms just set up to
take advantage of the preferential tax treatments and subsidies offered by governments?
Hu (2007) investigates 53 of such technology parks in his empirical research and he finds
no evidence that firms benefit from concentrating in these technology parks. One
potential explanation for this finding is some of these technology parks do not engage in
R&D activities at all. Given insufficient information with regard to R&D firms inside
these parks, in this paper, I take a different approach in defining what a research
(technology) cluster is.
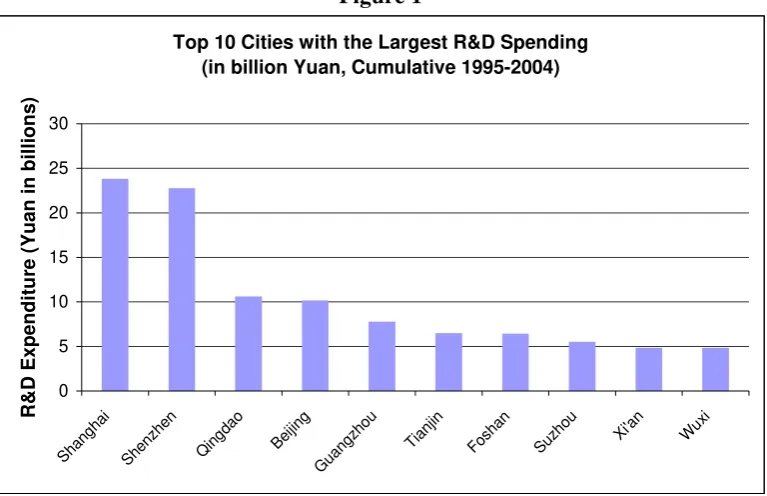
[Insert Figure 1 and Figure 2 here]
I identify the de facto research clusters by ranking the total R&D expenditure in
each major Chinese city during 1995-2004 period. The city-level R&D spending comes
from the aggregation of all the firms in LME located within the city. In Figure 1, I graph
the top ten cities in China with the largest total LME R&D spending. Four cities stand
out among China’s cities: Shanghai, Shenzhen, Qingdao and Beijing. From 1995 to 2004,
of total R&D spent by all Chinese firms during the same time period. Among these four
cities, Shanghai leads the pack, accounting for nearly 9% of the total LME R&D
spending , and it is followed by Shenzhen, with share of about 8.5% of the national total,
and by Qingdao and Beijing, each spending nearly 4% of the total (see Figure 2). These
four cities are the research clusters that I initially select for this empirical study. As
additional proof that my pick is an appropriate one, Richard Florida, in writing on the rise
of mega region,3 cited three cities out of the four cities that I identify, namely, Shanghai,
Beijing and Shenzhen. In addition, in Hu’s documentation (2007), these four cities also
appear on the list with the largest technology parks. The geographic location of the
research clusters inside China is shown in Appendix A. And given China’s large regional
gap in economic development, it came as no surprise that all four cities are located along
China’s coastal line.
2.2 Source of R&D spillovers within the research cluster
After I have identified the de facto research clusters, I next decide whether to
count all the firms in the center with R&D expenditure as the source of technology
spillovers, or simply the top firms with the largest R&D spending. This is essentially a
question about the R&D spillover dynamic. Is the source of spillovers limited to large
firms that are intensively engaged in R&D, or does each Yuan of R&D spending,
regardless of firm size make comparable contributions to R&D spillovers?
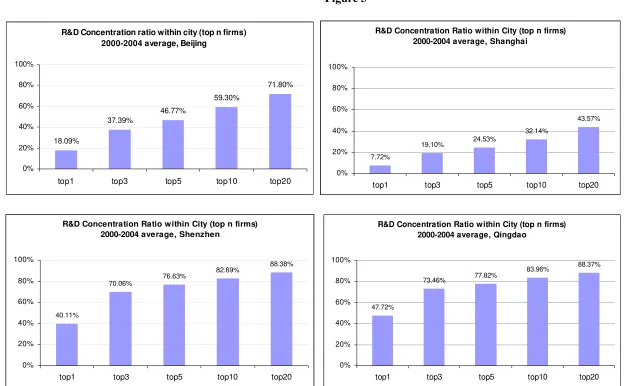
[Insert Figure 3 here]
In Figure 3, I graph the R&D concentration ratios of the top 1, 3, 5, 10 and 20
firms in the four research clusters. The ratios are calculated using their average R&D
spending from 2000 to 2004. As shown in the graph, R&D spending within each city is
highly concentrated. If we look at the concentration ratios of the top 5 firms, Shenzhen
and Qingdao appear to have the highest concentration ratios among the four, both
exceeding 75%. In contrast, R&D in Shanghai is much less concentrated, with the 5-firm
concentration ratio only slightly below 25%. This reflects the fact that Shanghai
historically had a much larger industrial base than the other three, and R&D activities
within the city are more dispersed. 4 If we move to look at the concentration ratios of the
top twenty firms, we get a similar picture only with even higher concentration. The top
twenty firms almost monopolized the whole R&D activities: in both Shenzhen and
Qingdao, the top 20 firms accounts for 88% of total R&D spending; in Beijing, the
number is 71%; Shanghai is again shown to have a more dispersed distribution of R&D,
its 20-firm concentration ratio nonetheless still reaching 45%. Finally, if we just look at
the top 1-firm concentration ratio, we observe the most stunning fact that in both
Shenzhen and Qingdao, a single firm accounts for more than 40% of total R&D spending
of the whole city.5
2.3 Which industries in China engage in most R&D activities?
Our dataset includes 31 2-digit industries by SIC classification in China’s
manufacturing space. In this section, I identify which industries have engaged in the
4 Shanghai distinguishes itself from other centers by having a much more diverse R&D base and high
concentration in education. It is reasonable to believe these two qualities place Shanghai in a more advantageous position in becoming the most important research center in China.
5 For Shenzhen, this single firm is Huawei Technologies in the electronics and telecom industry; for
most R&D activities, by looking at the industry-level R&D expenditure in each research
cluster.
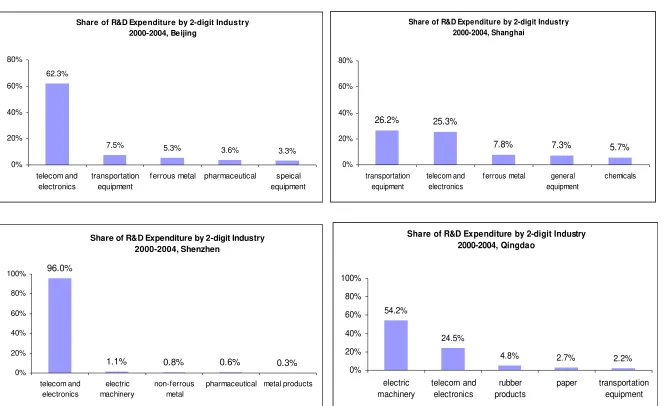
[Insert Figure 4 here]
As shown in Figure 4, each research cluster has established its relative strength in
R&D. In Beijing and Shenzhen, the telecom and electronics industry occupies a
disproportionately large share of the total R&D activities. In Beijing, the telecom and
electronics industry accounts for 62% of the total R&D spending on average from 2000
to 2004; in Shenzhen, the same industry accounts for an overwhelmingly 96%! In
Shanghai and Qingdao, most R&D is concentrated in transportation equipment and
electric machinery industry, respectively. However, the telecom and electronics industry
still accounts for a very large share in these two cities.
The nature of these R&D activities in China’s telecom and electronics industry
remains uncertain. Nonetheless, as above analysis shows, China’s telecom and
electronics industry has been investing heavily in R&D, and this industry may well
emerge as one of the serious competitors in the world market in coming decades.
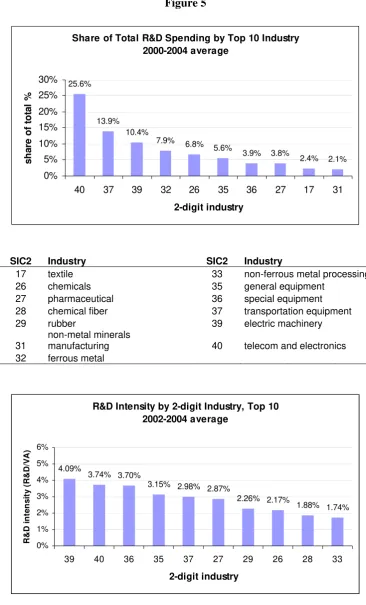
[Insert Figure 5 here]
Figure 4 focuses on industry R&D concentration in the four research clusters. To
show a broader picture of which industries China’s R&D activities are concentrated, in
Figure 5, I graph the R&D activities by 2-digit industries. The top panel shows the top ten
As shown in the graph, the telecom and electronics industry accounts for about a quarter
of the total R&D expenditure, still the largest share among all industries. And it is
followed by transportation equipment (mainly automobile) industry, at 14%; electric
machinery, at 10%; ferrous metal at 8% and chemicals at 7%. On the lower panel of
Figure 5, I show the top ten 2-digit industries with the highest R&D intensity, defined as
the ratio between R&D expenditure and value added. By this measure, electric machinery
industry overtakes telecom and electronics industry as the leading industry with the
highest R&D intensity, 4.09%. This is followed by telecom and electronics at 3.74%,
special equipment industry at 3.7% and general equipment industry at 3.5%.
Transportation equipment industry, previously ranked at no. 2, now ranks no. 5, with
R&D intensity at 2.98%.
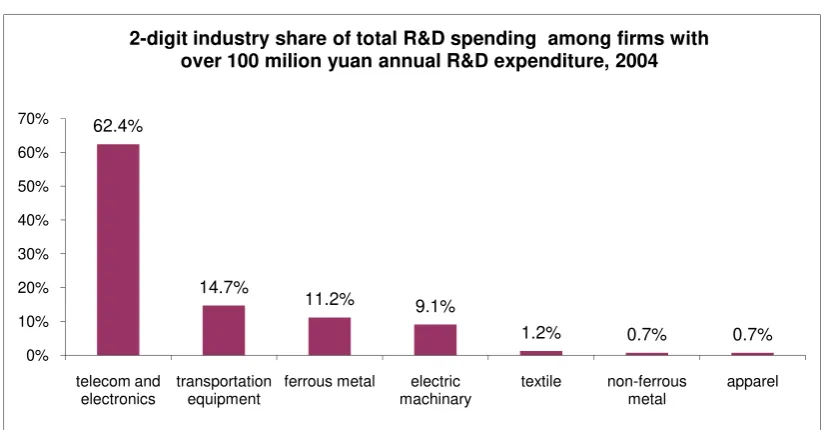
Finally, in Figure 6, I show another graph of R&D by industry for firms with over
100 million Yuan R&D expenditure in 2004. Again, the telecom and electronics industry
dominates all industries with the largest share of above 62% of the total R&D spending,
and it is followed by transportation equipment at 15%, ferrous metal at 11% and electric
machinery at 9%. By comparing Figure 4 and Figure 6, I arrive at the conclusion that
for the largest firms, the industry concentration ratio is even higher.
[Insert Figure 6 here]
3. Estimation Strategies
In this section, I discuss the empirical modeling strategies. I first estimate how
geographic distance affects technology spillovers, and then I add in technological
3.1 Geographic distance
To estimate how geographic or physical distance affects the magnitude of
technology spillovers, I use the following estimation equation:
5, ,( )
ln ln( / ) ln( top c) distcn i n
ijt ijt jt i j t ijt
LP K L CRD e u
(1)
The dependent variable, lnLPijt, or log of labor productivity, is measured by the
value-added per employee-year at the firm level, ln(VA L/ )ijt, and it is used to capture the
impact of technology spillovers over firms. It is indexed for firm i, SIC 2-digit industry j,
and year t. Equation (1) controls for variations in labor productivity that are associated
with differences in capital-labor ratios, ln(K L/ )ijt. I also included firm-level fixed effects
i
u , industry dummies j, and time effects t.
To estimate how geographic distance affects the effectiveness of technology
spillovers on firm’s productivity from R&D activities at the research cluster, I created an
interactive term between the log of cumulative R&D spending,6 or ln(CRDcjt), and the
geographic distance between the research cluster c, and the nearest city n, where the firm
i is located, or simplydistn i nc,( ).7 The interaction term is the main variable in our
estimation. If technology diffusion is local, I expect the coefficient of the interactive
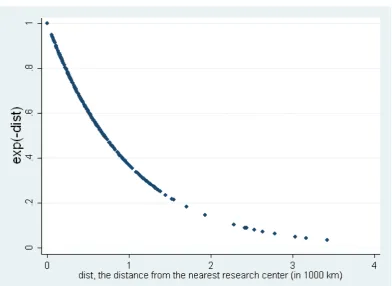
term, , to be positive and significant. Following the approach in Keller (2002), I
transform the geographic distance through an exponential function8 to avoid the dropout
6 Cumulative R&D spending is the sum of R&D expenditure from 1995 to year t. 7 The superscript, c, stands for the nearest cluster.
8
of those firms whose geographic distances are zero.9 By such transformation, I also
generate a smooth declining curve, which allows the gains of technology spillovers to
remain always positive, and only decline gradually with increasing distance between
research cluster and the firm. Figure 7 shows the scatter plot on the actual geographic
distance data expressed in exponential function.
[Insert Figure 7 here]
Here are some more details regarding how I calculate the geographic distance. I
identify each firm’s location in LME dataset by its administrative code. The
administration code points out the nearest city, n, in which the firm, i, is located. I then
use the geographic distance between the city n where the firm i is located and its nearest
research cluster, c, as a proxy for the distance between the research cluster and the firm.
To calculate this distance, I first obtain a matrix of the latitude and longitude of China’s
cities using the Geographic Information System (GIS). Then, I compute the distance
using the Great Circle Formula.10 Finally, I map the distance numbers back into the
main LME dataset by matching the city codes between GIS and LME datasets. In total, I
included 258 distinct city locations, i.e. n=258, and geographic distances in the empirical
test. These 258 cities included almost all medium and above level cities in China. Each
of these 258 distances is the minimum of the four geographic distances from the city, n,
to the four research clusters, i.e.,
,( ) ( ,( ) , ,( ), ,( ) , ,( ) )
c Shanghai Beijing Shenzhen Qingdao
n i n n i n n i n n i n n i n
dist MIN dist dist dist dist .
9 The distance between firm and research cluster could be zero when the firm is in the same city as the
research cluster.
10 Great Circle Formula: distance= 6378km*arccos[sin(lat1)*sin(lat2) + cos(lat1)*cos(lat2)*cos(lon2 -
I use cumulative R&D instead of R&D spending in each year t, as the impact of
past R&D on productivity tends to have a time lag so the benefit of R&D investment
won’t show up until years later.11 Cumulative R&D at the research cluster is index by
cluster c, industry j and year t. In other words, I allow the cumulative R&D at each
research cluster to vary across industries and years. But why include all industries, why
not just focus on those industries with the highest R&D spending? As previously
discussed in Section 2.2, R&D spending in each center city is highly concentrated among
the top firms in a few industries. However, the previous discussion was based on a
relative level. Although a handful of largest firms in a few industries dominate R&D
spending, other industries may still have significant amounts of R&D on an absolute
level. Another important reason is from the technical perspective of the estimation: for
the main variable, the interactive term, it would be highly desirable to generate variations
from both R&D spending at the cluster level and the geographic distances. The
estimation results of equation (1) are presented in Table 2, and I will come to the analysis
of the results in Section 4.
To calculate cumulative R&D spending at the research cluster, I aggregate the
R&D expenditure of the top5 firms in industry j, year t and at each research cluster c. As
discussed in Section 2.2, even without differentiating industries, the top twenty firms at
each research cluster accounts for the overwhelming majority of the total R&D
expenditure, so it’s reasonable to use the R&D expenditure of the top 5 firms as a proxy
to capture the majority of the R&D capability of each industry at the research cluster
3.2 Estimation with technological distance
One important question in technology diffusion is whether firms on the lower end
of technology ladder can effectively absorb knowledge and technology spillovers. I test a
variation of this idea by including a measure of technological distance into equation (1)
and estimate the following equation:
5,
5, 5,
ln ln( / ) ln( )
ln( ) _
c n
dist top c
ijt ijt jt
top c top c
jt njt i j t ijt
LP K L CRD e
CRD tech dist u
(2).
with all other variables remaining unchanged. By including both distances into the
equation, I essentially test how the productivity gains from technology spillover will
change with increasing distance from the center, conditional upon the technological
distance between the firms and the research cluster. As both geographic and
technological distances could affect firms’ productivity gains from technology spillovers,
it’s important to differentiate the two. Our priori expectation for the sign of the new
interactive term is negative, as larger technological gap tends to disincentivize firms to
adopt new technology. I report the regression results for equation (2) in Table 3.
To measure technological distance in equation (2), I use the following formula,
5 ,
5, 1 1
,( ) 5
,
1 1
_ log log
N
topk c n
jt ijt
top c k i
njt i n N
topk c n
kjt mjt k i VA VA tech dist L L
(3)In equation (3), the first term is log of average labor productivity of the top 5 firms in
research cluster c, and it is indexed by in industry j, and year t. The second term is the
and year t. There are a total number of N firms in city n, and it varies by each city. An
alternative measurement for technological distance is the productivity gap between the
research cluster and the individual firm i. I prefer the measurement defined in equation
(3) for the following two reasons. First, by setup, the technological gap indexed at firm i
is nearly perfectly correlated with the dependent variable, log of labor productivity.
Second, from a theoretical perspective, our choice of measurement captures the different
business environment in different cities, in which firms operate as well as the different
technology level of each industry j. Different cities have quite different idiosyncratic (or
local) characteristics: infrastructure, openness, human capital, economic policies, and
others. It is true that the firm-level fixed effects estimator in equation (2) helps control
some of these idiosyncrasies, but none of them is at the city level. Arguably, our choice
of technological measurement could also be a good proxy for the quality of local
institutions. Local institutions here are defined in broader sense and it includes
infrastructure, pool of skilled workers, living conditions, legal and government
transparency, etc. If this is the case, our estimation can be used as a direct test of
Easterly’s idea (2002) that incentives to adopt new technology are shaped by local
institutions. In geographic areas where there exists a big technological gap with the
technology frontier, referenced by Easterly as a “trap”, technology is much less likely to
be adopted; and even when the technology is readily available, the reach of technology
spillovers could be very limited. The estimation results for equation (2) are presented in
3.3 Model Extensions
In this section, I extend the models in section 3.1 and 3.2, and test several
alternative specifications of the baseline models. In section 3.3.1, I change the source of
R&D spillover from the top 5 firms by industry-year to all firms by industry-year in the
center city. In section 3.3.2, I replace the R&D measure from R&D level to R&D
intensity, where intensity is defined as total R&D divided by total value-added. In
section 3.3.3, I differentiate the source of R&D spillover into two parts: domestic versus
foreign.
3.3.1 Top 5 firms vs. all firms
Although section 2.2 shows with strong evidence that the R&D of the center cities
is concentrated mostly by the very few firms at the top, there is some interest to see
whether total R&D expenditure of whole center city would have the same spillover effect
on firm productivity as the R&D of the top 5 firms in the research cluster. In equation (4),
I test this alternative specification to equation (2) and the regression results are presented
in Table 4.
ln ln( / ) ln( )
ln( ) _
c n
dist c
ijt ijt jt
c c
jt njt i j t ijt
LP K L CRD e
CRD tech dist u
(4)
In this section, I extend the basic model in equation (2) by testing whether the
R&D concentration ratio in the research cluster matters to technology spillover.
Specifically, I test the following model in equation (5):
5, 5,
1 2
5, 5, 5, 5,
1 2
ln ln( / ) ln( ) ln( )
ln( ) _ ln( ) _
c c
n n
dist dist
top c top c c
ijt ijt jt jt jt
top c top c top c top c c
jt njt jt njt jt
i
LP K L CRD e CRD e CR
CRD tech dist CRD tech dist CR
u
j t ijt
(5)
TheR&D concentration ratio, c jt
CR , is defined as the ratio of R&D of the top five
firms to the total R&D expenditure in city c, both indexed by industry j and year t. By
including the 5-firm R&D concentration ratio, I am interested in knowing whether a more
dispersed or concentrated R&D inside the center city can produce productivity gains from
technology spillover. The regression results of this alternative specification are reported
in Table 5.
3.3.3 Source of R&D spillover: Domestic vs. foreign
Given that China is the third largest FDI recipient in the world, only after the US
and UK, and foreign investment has always played a big role in China’s technology
diffusion and economic growth, in equation (6), I differentiate the source of R&D at the
center city into two parts: domestic vs. foreign, and test how different sources of R&D
spillover affect firm productivity.
, 1 , , , 1 2 , 2
ln ln( / ) ln( )
ln( ) _ ln( )
ln( ) _
c n c n dist domestic c
ijt ijt jt
dist
domestic c domestic c foreign c
jt njt jt
foreign c for
jt njt
LP K L CRD e
CRD tech dist CRD e
CRD tech dist
eign c,
i j t ijt
u
In equation (6), domestic c,
jt
CRD is the cumulative R&D expenditure of all the
domestic firms in the center city c, by industry j and year t. Similarly, CRDjtforeign c, is the
cumulative R&D spending of all the foreign firms in the center city c, by industry-year jt.
Foreign firms includes both foreign wholly-owned firms and the join ventures between
foreign and domestic partners. I expect our hypothesis still holds after the differentiation
of R&D source, but it would be interesting to see how the coefficients of different
spillover sources compare. Arguably, foreign R&D source may have a smaller spillover
effect on firm’s productivity as foreign invested companies always have incentives to
delay the diffusion process and tend to protect their in-house technology more vigorously.
However, if we were to assume foreign technology is better and more productive than
domestic technology, a smaller “leak” may still produce larger spillover effect on firm’s
productivity. The regression results of equation (6) are reported in Table 6.
4. Empirical Results
In this section, I present and analyze the regression results as modeled in equation
(1) and (2). I also discuss the potential endogeneity problem in our estimation and how
to deal with it.
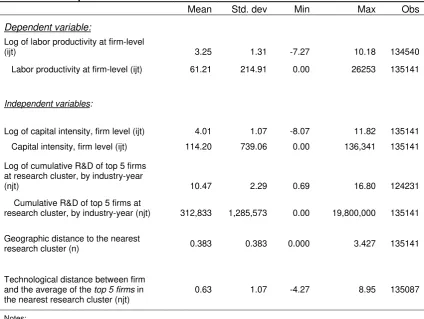
The summary statistics of the variables used in regression are reported in Table 1.
The average labor productivity of all firms located outside the research cluster is 61,000
Yuan (in current prices) per employee-year. In contrast, the labor productivity of the top
5 firms (by industry j) in the research cluster is averaged at 116,000 Yuan per
employee-year, which almost doubles the average productivity of the firms outside of the center.
and it ranges from zero, for those firms that located within the center, to the maximum
distance of 3,400 km.
4. 1 Analysis of the results
Table 2 summarizes the regression results for equation (1), where I look at how
geographic distance between firms and research cluster affects firms’ productivity gains.
I first run the simple OLS regression and the results are reported in Column (1). In
Column (2) to (4), I move the test to a more robust level by sequentially adding in
firm-level fixed effects, industry dummies and yearly time effects. The main control variable,
capital intensity, is shown to be statistically significant throughout and its effect on firm’s
productivity is positive. The coefficient on the interactive term between the research
cluster’s cumulative R&D spending and the geographic distance is positive and
statistically significant through Column (1) to Column (3), matching our priori
expectations, i.e., when the distance between firms and the research cluster increases,
firms’ productivity gains decline. However, in Column (4), after addition of the year
dummies, the coefficient on the interactive term becomes statistically insignificant.
[Insert Table 2 here]
Although only in the strictest test scenario did the coefficient on the interactive
become insignificant, the result is still less satisfactory. One explanation could be that
technology spillover can only affect firm’s productivity within certain distance range. In
Table 2b, I test this possibility by estimating equation (1) under different distance ranges.
effects, industry dummies and yearly time effects. The results show the coefficient on the
R&D-distance interactive term is statistically significant and positive only when the
distance falls under 300 kilometers. The hypothesis still stands but with a twist. It
nonetheless strongly confirms our hypothesis that distance matters in technology
diffusion. Interestingly, for the test of observations under 100 km range, the coefficient
turns negative but insignificant. There is no reason to believe that the effect of
technology spillovers within 100 km will increase with firm’s distance while it will
decrease with the distance in 100-300 km range. A plausible explanation for such results
is that the firm’s distance in this research is calculated by the distance between the
nearest city the firm is located and the research cluster. For firms that fall under 100km
range, the nearest city is probably the center city itself. Therefore, for a large majority of
these firms, the distances to the center are actually zero in our calculation. Since there
are not many variations from distances in the regression, it came as no surprise that the
coefficient for this sub-group is not statistically significant.
[Insert Table 2b here]
In Table 3, I report the estimation results for equation (2), where I control the
technological distance between the research cluster and the firm and see how the effects
will change. Similar to Table 2, Column (1) runs the basic OLS regression. Through
Column (2) to (4), I add in firm fixed-effects, industry dummies and year dummies, one
at a time. The coefficient on the interactive term between technological distance and
statistically and has the negative sign as expected. The negative coefficient indicates the
larger the technological distance between research cluster and the spillover receiving firm,
the smaller the productivity gain for the firm. As defined by equation (3) in Section 3.2,
the technological distance variable measures the average labor productivity of the top
R&D firms at the research cluster, and average labor productivity of all the firms located
in the receiving city, n. Both productivities are indexed at industry j and year t. Since
firms’ productivity in our definition captures certain idiosyncratic characteristics of the
city where the firm is located, the negative coefficient may well capture the poorer
quality of local institutions and business environment that makes it harder for firms in the
city to absorb the benefits of technology spillover, resulting in less productivity gains.
[Insert Table 3 here]
In Table 4, I report regression results of equation (4) in section 3.3.1. The results
that use all firms in the center city as the source of R&D spillover are shown in Column
(3) and (4). For comparison purpose, results in Column (1) and (2) that uses the top 5
firms as the source of technology are taken directly from Table 3. The coefficients on
both distance measures retain the same signs and remain statistically significant.
[Insert Table 4 here]
Table 5 presents the regression results of equation (5). What I try to find from
for technology spillover. As a reminder, R&D concentration ratio is measured by R&D
spending by the top 5 firms at research center city c, over the total R&D spending of all
firms in the same city; and the ratio is indexed at industry-year, jt. As shown in the table,
the coefficient of the interactive term between ln( )top c5, distcn
jt
CRD e and concentration
ratio is negative and statistically significant. This seems to suggest that the higher the
R&D concentration ratio the more slowly the productivity gains from R&D spillover will
decline with increasing geographic distance from the research cluster. The coefficient of
the interactive term between 5, 5,
ln( )top c _ top c
jt njt
CRD tech dist and concentration ratio is
positive and remains statistically significant most of the time (except in Column 4), and
this suggests that giving the same technological distance between center and firm, the
higher the R&D concentration ratio in the center city, the more productivity gains firms
will get from technology spillover. In short, both results imply that higher R&D
concentration ratio is good for technology spillover, everything being equal.
[Insert Table 5 here]
Table 6 presents the regression results of equation (6), where I differentiate the
source of technology spillover at the research cluster. The estimation results are very
similar to the previous results in Table 3: the coefficients on both domestic and foreign
R&D, for both geographic and technological distances, have the same sign and remain
statistically significant. For geographic distance, the smaller coefficient on foreign R&D
indicates that the impact on firm’s productivity from foreign R&D tends to decline more
R&D sources are very similar. Note that when I add in year dummies in the last column,
the coefficients on the geographic distance for both R&D sources became not statistically
significant, but their signs still remain positive. But in general, the regression results are
quite robust.
[Insert Table 6 here]
4. 2 Endogeneity issue
One might argue that a firm’s location and distance to the research cluster are
endogenously determined by the firm’s decision to locate or to move closer to the
research cluster from a previous location so as to take advantage of the larger technology
spillover. This could be a potential problem if firms with higher productivity take
advantage of spillover opportunities by moving closer to the cluster. In this case, even
when the productivity of these firms may not be affected by the technology spillover
from the cluster as modeled in our estimation, we may still find a positive relationship
between close proximity to the research cluster and higher productivity.
Of course, one might counter that some of these firms chose to move closer to the
center simply because there exists a larger positive spillover effect with shorter distance
to the research cluster, so their move simply reflects, if not reinforces, the causal
relationship between the distance and higher productivity.
Still, we cannot exclude the possibility that some firms with pre-existing better
technology locate/move closer to the center based on the factors other than distance. So
only those firms that established their businesses before the beginning year of our testing
period, i.e., 1995. So in the new test sample, I dropped all the firms that opened their
businesses or changed locations after 1995. Since a firm’s location and its distance are
prefixed before the 1995-2004 period, this precludes any possibility of the endogeneity
problem discussed above. By my calculation, this new testing sample still incorporates
over 80% of the total observations of the previous sample.
[Insert Table 7 here]
The regression results for this sub-group are presented in Table 7. As shown, the
coefficients on all our main variables still remain the same sign and they are statistically
significant. In fact, if one compares the magnitude of all the coefficients in the whole
sample and the sub-group sample, they are also very similar. This indicates that the
endogeneity might not be a real concern in our empirical testing.
4.3 Distance effect from research cluster vs. from the coastal line
The major research clusters identified in this paper are all located along China’s
coastal line. One might argue that the distance effect captured in our empirical test actual
reflects the distance from the coastal line, rather than the distance from the research
clusters. To solve this potential identification problem, in this section, I include three
additional cities from the interior region (other than from coastal line) as the source of
R&D spillover, the purpose of which is to differentiate between the distance effect from
Among the top ten cities in our R&D expenditure ranking list, only Xi’an is
located in the interior region. Further down on the R&D spending list, Shenyang is
ranked 14th, and Wuhan is ranked 17th, respectively. I include these three inner cities.
The regression results of equation (2) are reported in Table 8. As shown in the table, the
distance effect from the research clusters in our previous regressions still holds and the
coefficients on the two distance variables remain statistically significant and their signs
are unchanged. This demonstrates that our estimation results are very robust.
In Column (5) of Table 8, to look at how the coastal location will affect firm’s
productivity gains from technology spillover, I further included a coastal dummy and let
it interact with ln( top c5, ) distnc
jt
CRD e and ln(CRDtop cjt 5, )tech dist_ njttop c5, . The results are very
interesting. The first interactive term with geographic distance turns out to be negative
and statistically significant. It suggests that firms located in the coastal region tend to
have a smaller “negative” distance effect with increasing geographic distance between
firm location and research clusters. The second interactive terms turns out to be positive
and statistically significant, and it suggests that given the same technological distance
between firms and research clusters, coastal firms tend to enjoy much larger productivity
gains from technology spillover than firms in the interior region.
5. Conclusion and Remarks
Through a series of robust empirical tests, I confirm that distance does matter in
technology spillovers. First, geographic distance matters and technology spillovers are
largely local ---Firms’ productivity gains decline as the geographic distance between the
---The larger the productivity gap between the research clusters and firms, the smaller the
productivity gains from the technology spillover. The most obvious implication from this
research is with the presence of “distance effects”, technology diffusion in reality has
many frictions and income inequality tends to persist. It’s still too early to proclaim the
“death of distance”.
The estimation results in our extended models suggest that higher R&D
concentration ratio in research clusters and exposure to foreign R&D activities both have
larger positive spillover effects on firms’ productivity gains. Given that most of China’s
research clusters are highly concentrated and its high degree of openness to foreign direct
investment, China seems to be well positioned to absorb the benefits of technology
diffusion.
The results from this empirical study also have important implications for policy
makers in urban planning and regional development alike. One such implication is that
in order to receive greater benefits from technology spillovers, firms with better
technologies may cluster together as close as possible to the research cluster, where most
R&D activities take place. But over time this tends to result in over-crowdedness in
cluster cities. The high concentration of the most productive firms also has implications
on income equality. In China’s case, since all big research clusters are located along the
coastal line, the “distance effect” on technology spillover tends to magnify the already
highly skewed income distribution between the urban and rural area, as well as the gap
between the coastal and interior regions.12 The policy alternative should aim to establish
multiple research clusters across different regions, not just along the coastal area. This
will help technology spillovers to expand its scope without requiring firms to change
their current locations.
Another important policy implication from this study is: firms with more
backward technology may not receive the same great benefits as those firms with similar
technologies with the cluster. So in order for technology spillover to be more effective,
policy makers should not rush into building more “technology parks”, but should instead
References
Adams, J. and A. Jaffe. 1996. “Bounding the Effects of R&D: An Investigation Using Matched Establishment-Firm Data.” RAND Journal of Economics, 27(4): 700-21.
Coe, David and Elhanan Helpman. 1995. “International R&D Spillovers.” European Economic Review, 39: 859-887.
Easterly, William. 2002. The Elusive Quest for Growth: Economists’ Adventures and Misadventures in the Tropics. Cambridge: The MIT Press.
Eaton, Jonathan and Samuel Kortum. 1999. “International Technology Diffusion: Theory and Measurement.” International Economic Review, 40(3): 537-570.
Feenstra, Robert E. 1996. “Trade and Uneven Growth.” Journal of Development Economics, 49(1):229-56.
Florida, Richard. 2008. “The Rise of Mega Region.” Wall Street Journal, April 12.
Friedman, Thomas. 2006. The World Is Fat: A Brief History of the Twenty-First Century. Farrar. Straus and Giroux.
Glaeser, Edward and Janet E. Kohlhase. 2004. “Cities, Regions and the Decline of Transport Costs.” Papers in Regional Science, 83(1): 197-228.
Glaeser, Edward and Giacomo Ponzetto. 2007. “Did The Death of Distance Hurt Detroit and Help New York?.” NBER Chapters, in: The Economics of Agglomeration, NBER.
Griffith, Rachel et al. 2007. “Is Distance Dying at Last? Falling Home Bias in Fixed Effects Models of Patent Citations.” NBER Working Papers, No. 13338.
Griliches, Zvi. 1995. “R&D and Productivity: Econometric Results and Measurement Issues,” in Paul Stoneman, ed., Handbank of the Economics of Innovation and Technological Change. Oxford: BlackIll, 52-89.
Hu, Albert G. Z. 2007. “Technology Parks and Regional Economic Growth in China.” Research Policy, 36(1):76-87.
Jacobs, Jane. 1970. The Economy of Cities. Vintage Publishing.
Jaffe, A. et al. 1993. “Geographic Localization of Knowledge Spillovers as Evidenced by Patent Citations.” Quarterly Journal of Economics, 108(3):577-98.
Keller, Wolfgang. 2002. “Geographic Localization of International Technology Diffusion.”
American Economic Review, 92(1):120-42.
Figure 1
Top 10 Cities with the Largest R&D Spending (in billion Yuan, Cumulative 1995-2004)
0 5 10 15 20 25 30 Shang hai Shenz hen Qin
gdao Beijing
Gua
[image:30.595.101.494.159.668.2]ngzhou Tianj in Fos han Suzh ou Xi'a n Wu xi R&D E x penditu re ( Y ua n in billi on s ) Figure 2
Top 10 Cities' R&D Spending as % of National Total (Cumulative 1995-2004) 0% 1% 2% 3% 4% 5% 6% 7% 8% 9% 10% Sha nghai Shenz hen Qingd ao Beijin g Gua ngz hou Tian jin Fos han Suzh ou
Figure 3
R&D Concentration ratio within city (top n firms) 2000-2004 average, Beijing
18.09% 37.39% 46.77% 59.30% 71.80% 0% 20% 40% 60% 80% 100%
top1 top3 top5 top10 top20
R&D Concentration Ratio within City (top n firms) 2000-2004 average, Shanghai
7.72% 19.10% 24.53% 32.14% 43.57% 0% 20% 40% 60% 80% 100%
top1 top3 top5 top10 top20
R&D Concentration Ratio within City (top n firms) 2000-2004 average, Shenzhen
40.11% 70.06% 76.63% 82.69% 88.38% 0% 20% 40% 60% 80% 100%
top1 top3 top5 top10 top20
R&D Concentration Ratio within City (top n firms) 2000-2004 average, Qingdao
47.72% 73.46% 77.82% 83.96% 88.37% 0% 20% 40% 60% 80% 100%
Figure 4
Share of R&D Expenditure by 2-digit Industry 2000-2004, Beijing 62.3% 7.5% 5.3% 3.6% 3.3% 0% 20% 40% 60% 80% telecom and electronics transportation equipment
ferrous metal pharmaceutical speical equipment
Share of R&D Expenditure by 2-digit Industry 2000-2004, Shanghai
26.2% 25.3%
7.8% 7.3% 5.7%
0% 20% 40% 60% 80% transportation equipment telecom and electronics
ferrous metal general equipment
chemicals
Share of R&D Expenditure by 2-digit Industry 2000-2004, Shenzhen
96.0%
1.1% 0.8% 0.6% 0.3%
0% 20% 40% 60% 80% 100% telecom and electronics electric machinery non-ferrous metal
pharmaceutical metal products
Share of R&D Expenditure by 2-digit Industry 2000-2004, Qingdao
54.2%
24.5%
4.8% 2.7% 2.2%
Figure 5
Share of Total R&D Spending by Top 10 Industry 2000-2004 average 25.6% 13.9% 10.4% 7.9% 6.8% 5.6% 3.9% 3.8% 2.4% 2.1% 0% 5% 10% 15% 20% 25% 30%
40 37 39 32 26 35 36 27 17 31 2-digit industry sh ar e o f t o tal %
SIC2 Industry SIC2 Industry
17 textile 33 non-ferrous metal processing 26 chemicals 35 general equipment
27 pharmaceutical 36 special equipment
28 chemical fiber 37 transportation equipment 29 rubber 39 electric machinery
31
non-metal minerals
manufacturing 40 telecom and electronics 32 ferrous metal
R&D Intensity by 2-digit Industry, Top 10 2002-2004 average
4.09%
3.74% 3.70%
3.15% 2.98% 2.87%
2.26% 2.17% 1.88% 1.74% 0% 1% 2% 3% 4% 5% 6%
39 40 36 35 37 27 29 26 28 33
Figure 6
62.4%
14.7%
11.2% 9.1%
1.2% 0.7% 0.7%
0% 10% 20% 30% 40% 50% 60% 70%
telecom and electronics
transportation equipment
ferrous metal electric machinary
textile non-ferrous metal
apparel
Table 1. Descriptive statistics
Mean Std. dev Min Max Obs
Dependent variable:
Log of labor productivity at firm-level
(ijt) 3.25 1.31 -7.27 10.18 134540
Labor productivity at firm-level (ijt) 61.21 214.91 0.00 26253 135141
Independent variables:
Log of capital intensity, firm level (ijt) 4.01 1.07 -8.07 11.82 135141
Capital intensity, firm level (ijt) 114.20 739.06 0.00 136,341 135141
Log of cumulative R&D of top 5 firms at research cluster, by industry-year
(njt) 10.47 2.29 0.69 16.80 124231
Cumulative R&D of top 5 firms at
research cluster, by industry-year (njt) 312,833 1,285,573 0.00 19,800,000 135141
Geographic distance to the nearest
research cluster (n) 0.383 0.383 0.000 3.427 135141
Technological distance between firm and the average of the top 5 firms in the nearest research cluster (njt)
0.63 1.07 -4.27 8.95 135087
Notes:
* The unit of measurement for labor productivity and capital labor ratio 1,000 Yuan per employee-year. * R&D numbers are all in thousands of
Yuan.
* Geographic (physical) distances are in 1000 kilometers.
* (njt) means the variable is indexed by city n, industry j and year t.
Table 2. The Impact of R&D Spillovers on Firm's Productivity: Geographic Distance
Dependent variable:
ln(VA/L)ijt, Log of labor productivity at firm
level
Independent variables: (1) (2) (3) (4)
ln(K/L)ijt, log of capital intensity 0.572*** 0.245*** 0.245*** 0.225***
(0.003) (0.004) (0.004) (0.005)
ln(CRD)*exp(-dist), log of cumulative R&D of the top5 firms at research cluster
interacting w/ geographic distance between
cluster 'n firm 0.076*** 0.103*** 0.104*** 0.003
(0.001) (0.003) (0.003) (0.004)
constant 0.375*** 1.481*** 1.619*** 2.248***
(0.015) (0.024) (0.086) (0.087)
firm fixed effects No Yes Yes Yes
industry dummies No No Yes Yes
year dummies No No No Yes
obs 123,659 123,659 123,659 123,659
Table 2b. The Impact of R&D Spillovers on Firm's Productivity: Geographic distance in different ranges
Dependent variable:
ln(VA/L)ijt, Log of labor productivity at firm level
Independent variables: (1) (2) (3) (4) (5) (6) (7) (8)
distance range no limit <500km <400km <300km <200km <100km 100-200km 100-300km
ln(K/L)ijt, log of capital intensity 0.225*** 0.218*** 0.221*** 0.218*** 0.218*** 0.193*** 0.232*** 0.225***
(0.005) (0.006) (0.006) (0.006) (0.007) (0.011) (0.009) (0.007)
ln(CRD)*exp(-dist), log of cumulative R&D of the top5 firms at research cluster interacting w/ geographic distance between cluster 'n firm
0.003 0.007 0.006 0.009** 0.013*** -0.002 0.023*** 0.016***
(0.004) (0.005) (0.005) (0.005) (0.006) (0.009) (0.007) (0.006)
constant 2.248*** 2.317*** 2.371*** 2.311*** 2.451*** 2.297*** 2.425*** 2.270***
(0.087) (0.099) (0.102) (0.110) (0.135) (0.307) (0.154) (0.118)
firm fixed effects Yes Yes Yes Yes Yes Yes Yes Yes
industry dummies Yes Yes Yes Yes Yes Yes Yes Yes
year dummies Yes Yes Yes Yes Yes Yes Yes Yes
obs 123,659 88,270 80,062 70,259 54,531 23,782 30,749 46,477
adj. (or overall) R-sq. 0.292 0.290 0.288 0.284 0.281 0.200 0.273 0.284
Table 3. The Impact of R&D Spillovers on Firm's Productivity: Geographic & Technological Distance
Dependent variable:
ln(VA/L)ijt, Log of labor productivity at firm
level
Independent variables: (1) (2) (3) (4)
ln(K/L)ijt, log of capital intensity 0.551*** 0.241*** 0.241*** 0.217***
(0.003) (0.004) (0.004) (0.004)
ln(CRD)*exp(-dist), log of cumulative R&D of the top5 firms at research cluster interacting w/ geographic distance between cluster 'n firm
0.077*** 0.133*** 0.133*** 0.025***
(0.001) (0.003) (0.003) (0.004)
ln(CRD)*techdist, log of cumulative R&D of the top5 firms at research cluster interacting w/ tech. distance between cluster 'n firm
-0.022*** -0.019*** -0.019*** -0.019***
(0.000) (0.000) (0.000) (0.000)
constant 0.601*** 1.394*** 1.544*** 2.211***
(0.015) (0.023) (0.085) (0.086)
firm fixed effects No Yes Yes Yes
industry dummies No No Yes Yes
year dummies No No No Yes
obs 123,659 123,659 123,659 123,659
adj. (or overall) R-sq. 0.287 0.217 0.234 0.354 Notes: *** (**, * ) indicates statistical significance at the 1 (5, 10)-percent level.
Table 4. The Impact of R&D Spillovers on Firm's Productivity: all firms vs. top 5 firms as source of R&D spillover at research cluster
Dependent variable:
ln(VA/L)ijt, Log of labor productivity at firm
level
Independent variables: (1) (2) (3) (4)
top 5 firms all firms ln(K/L)ijt, log of capital intensity 0.241*** 0.217*** 0.243*** 0.214***
(0.004) (0.004) (0.004) (0.005)
ln(CRD)*exp(-dist), log of cumulative R&D at research cluster interacting w/ geographic distance between cluster 'n firm
0.133*** 0.025*** 0.148*** 0.026***
(0.003) (0.004) (0.003) (0.005)
ln(CRD)*techdist, log of cumulative R&D at research cluster interacting w/ tech. distance between cluster 'n firm
-0.019*** -0.019*** -0.027*** -0.027***
(0.000) (0.000) (0.000) (0.000)
constant 1.544*** 2.211*** 1.653*** 2.324***
(0.085) (0.086) (0.087) (0.088)
firm fixed effects Yes Yes Yes Yes
industry dummies Yes Yes Yes Yes
year dummies No Yes No Yes
obs 123,659 123,659 110,599 110,599
Table 5. The Impact of R&D Spillovers on Firm's Productivity: Does R&D concentration matter?
Dependent variable:
ln(VA/L)ijt, Log of labor productivity at firm
level
Independent variables: (1) (2) (3) (4)
ln(K/L)ijt, log of capital intensity 0.547*** 0.525*** 0.255*** 0.229***
(0.004) (0.004) (0.005) (0.005)
ln(CRD)*exp(-dist), log of
cumulative R&D of the top5 firms at research cluster interacting w/ geographic distance between cluster 'n firm
0.134*** 0.146*** 0.186*** 0.044***
(0.002) (0.002) (0.006) (0.008)
ln(CRD)*exp(-dist) interacting with R&D concentration ratio* of the top 5 firms
-0.091*** -0.099*** -0.021*** -0.011***
(0.002) (0.002) (0.001) (0.004)
ln(CRD)*techdist, log of cumulative R&D of the top5 firms at research cluster interacting w/ tech. distance between cluster 'n firm
-0.028*** -0.021*** -0.019***
(0.001) (0.001) (0.001)
ln(CRD)*techdist interacting with R&D contration ratio of the top 5 firms
0.011*** 0.004*** 0.002
(0.001) (0.001) (0.001)
constant 0.492*** 0.683*** 1.016*** 2.035***
(0.019) (0.018) (0.034) (0.172)
firm fixed effects No No Yes Yes
industry dummies No No No Yes
year dummies No No No Yes
obs 82,932 82,932 82,932 82,932
adj. (or overall) R-sq. 0.256 0.289 0.176 0.358 Notes: *** (**, * ) indicates statistical significance at the 1 (5, 10)-percent level. *R&D contration ratio is measured by R&D of top 5 firms over total R&D expenditure of all firms of cluster city,
Table 6. Differentiating Source of R&D Spillovers: Domestic vs. Foreign
Dependent variable:
ln(VA/L)ijt, Log of labor productivity at firm level
Independent variables: (1) (2) (3) (4)
ln(K/L)ijt, log of capital intensity 0.474*** 0.238*** 0.237*** 0.219***
(0.004) (0.006) (0.006) (0.006)
ln(CRD)*exp(-dist), log of domestic cumulative R&D at research cluster interacting w/ geographic distance between cluster 'n firm
-0.033*** 0.086*** 0.085*** 0.009
(0.002) (0.005) (0.005) (0.006)
ln(CRD)*exp(-dist), log of foreign* cumulative R&D at research cluster interacting w/ geographic distance between cluster 'n firm
0.118*** 0.052*** 0.051*** 0.006
(0.002) (0.004) (0.004) (0.004)
ln(CRD)*techdist, log of domestic cumulative R&D at research cluster interacting w/ tech. distance between cluster 'n firm
-0.009*** -0.018*** -0.018*** -0.019***
(0.000) (0.000) (0.000) (0.000)
ln(CRD)*techdist, log of foreign cumulative R&D at research cluster interacting w/ tech. distance between cluster 'n firm
-0.036*** -0.017*** -0.017*** -0.014***
(0.000) (0.001) (1.001) (0.000)
constant 1.218*** 1.560*** 1.768*** 2.407***
(0.021) (0.034) (0.128) (0.129)
firm fixed effects No Yes Yes Yes
industry dummies No No Yes Yes
year dummies No No No Yes
obs 66,441 66,441 66,441 66,441
adj. (or overall) R-sq. 0.342 0.276 0.285 0.379 Notes: *** (**, * ) indicates statistical significance at the 1 (5, 10)-percent level. *foreign R&D includes R&D expenditure of both pure foreign firms and foreign-domestic joint ventures.
Table 7. Deal with potential endogeneity problem: estimation using only those firms that opened their businesses BEFORE 1995, the beginning year of the data
Dependent variable:
ln(VA/L)ijt, Log of labor productivity at firm level
Independent variables: (1) (2) (3) (4) (5) (6) (7) (8)
firms that existed before 1995 vs. all firms
ln(K/L)ijt, log of capital intensity 0.559*** 0.250*** 0.250*** 0.224*** 0.551*** 0.241*** 0.241*** 0.217***
(0.004) (0.005) (0.005) (0.005) (0.003) (0.004) (0.004) (0.004)
ln(CRD)*exp(-dist), log of cumulative R&D of the top5 firms at research cluster interacting w/ geographic distance between cluster 'n firm
0.073*** 0.125*** 0.124*** 0.018*** 0.077*** 0.133*** 0.133*** 0.025***
(0.001) (0.003) (0.003) (0.005) (0.001) (0.003) (0.003) (0.004)
ln(CRD)*techdist, log of cumulative R&D of the top5 firms at research cluster interacting w/ tech. distance between cluster 'n firm
-0.022*** -0.019*** -0.019*** -0.019*** -0.022*** -0.019*** -0.019*** -0.019***
(0.000) (0.000) (0.000) (0.000) (0.000) (0.000) (0.000) (0.000)
constant 0.514*** 1.321*** 1.457*** 2.118*** 0.601*** 1.394*** 1.544*** 2.211***
(0.017) (0.025) (0.093) (0.094) (0.015) (0.023) (0.085) (0.086)
firm fixed effects No Yes Yes Yes No Yes Yes Yes
industry dummies No No No Yes No No Yes Yes
year dummies No No No Yes No No No Yes
obs 102,632 102,632 102,632 102,632 123,659 123,659 123,659 123,659
adj. (or overall) R-sq. 0.272 0.210 0.221 0.311 0.287 0.217 0.234 0.354
Table 8. Identifying Distance Effect from the R&D at the Research Clusters: with research clusters from the interior region
Dependent variable:
ln(VA/L)ijt, Log of labor productivity at firm level
Independent variables: (1) (2) (3) (4) (5)
ln(K/L)ijt, log of capital intensity 0.570*** 0.238*** 0.235*** 0.212*** 0.212***
(0.003) (0.005) (0.005) (0.005) (0.005)
ln(CRD)*exp(-dist), log of cumulative R&D of the top5 firms at research cluster interacting w/ geographic distance between cluster 'n firm
0.073*** 0.100*** 0.130*** 0.029*** 0.051***
(0.001) (0.003) (0.003) (0.004) (0.006)
ln(CRD)*techdist, log of cumulative R&D of the top5 firms at research cluster interacting w/ tech. distance between cluster 'n firm
-0.019*** -0.019*** -0.026***
(0.000) (0.000) (0.001)
ln(CRD)*exp(-dist) interacting w/ coastal
dummy -0.037***
(0.005)
ln(CRD)*techdist interacting w/ coastal
dummy 0.013***
(0.001)
constant 0.358*** 1.463*** 1.328*** 2.249*** 2.259***
(0.018) (0.025) (0.024) (0.092) (0.092)
firm fixed effects No Yes Yes Yes Yes
industry dummies No No No Yes Yes
year dummies No No No Yes Yes
obs 102,436 102,436 102,436 102,436 102,436