2017 2nd International Conference on Advances in Management Engineering and Information Technology (AMEIT 2017) ISBN: 978-1-60595-457-8
Design of Diagnosis Function for Autonomous PLC Control System
Er ZHENG
*, Da-jun FENG, Hao WANG and Qing-min HAN
National Computer System Engineering Research Institute of China, Beijing, P.R. China *Corresponding author
Keywords: Over-range, Jitter, Self-diagnosis, Fault diagnosis.
Abstract. This paper discusses the control system based on large PLC. System diagnosis is the key function of PLC control system, also an important indicator to measure the safety and reliability of the system. In this paper, the design ideas and methods are presented and discussed in detail about signal acquisition and diagnosis, system self-diagnosis and device fault diagnosis in autonomous PLC control system. The design method is feasible to meet the requirement of industrial control and can improve the reliability of control system dramatically.
Introduction
The autonomous PLC (programmable logic controller) control system adopts the typical three layers architecture (device layer, control layer and management layer), and completes the process of data acquisition, calculation, monitoring and control by cooperation of PLC field controller, PLC system configuration programming software and man-machine monitoring system.
Autonomous PLC control system is based on large-scale PLC of high speed, large capacity and multi function. It can support parallel work for IO (more than 10 thousand points), multiple CPU and large capacity memory. In another more comprehensive aspect, it can support the functions of real-time data acquisition and display, system alarm, over-range diagnosis, switch jitter amount diagnosis, system device fault diagnosis, system time correction, system redundancy, etc.
The system diagnosis function has great significance in production practice to improve the reliability of the PLC control system, prevent accidents, avoid economic losses, establish and perfect the maintenance plan [1], etc. This paper mainly discusses the design method of signal processing and fault diagnosis for PLC control system.
Acquisition Signal Diagnosis
Over-Range Diagnosis
The over-range of acquisition signal is divided into electrical over-range and physical over-range [2]. The electrical over-range is diagnosed by PLC controller, and the physical over-range is calculated by internal calculation module of the server.
time Electrical
range
Upper limit
Lower limnit Outer dead
zone
Outer dead zone
Produce event of over-range
Produce recovey event of over- range Produce event of
over-range
[image:2.612.198.411.77.242.2]Produce recovery event of over-range
Figure 1. Schematic diagram of outer dead zone of electrical over-range.
Produce event of over-range Produce event of
over-range
Produce recovery event of over-range Produce recovery
event of over-range
time Electrical
range
Upper limit
Lower limnit inner dead
zone
inner dead zone
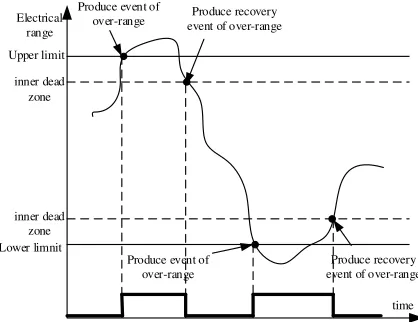
Figure 2. Schematic diagram of inner dead zone of electric over-range.
The inner and outer dead zone can be decided by positive and negative values of the corresponding database point in electrical range dead zone. If the value is positive, it is outer dead zone; if the value is negative, it is inner dead zone. The value of electrical range dead zone can be configured in database.
1. The generation of electrical over-range:
If the outer dead zone is more than upper limit of dead zone or less than lower limit of dead zone, it is determined as the generation of electrical over-range.
If the inner dead zone is more than upper limit of electrical range or less than lower limit of electrical range, it is determined as the generation of electrical over-range.
2. The recovery of electrical over-range:
If the outer dead zone is less than upper limit of electrical range or more than lower limit of electrical range, it is determined as the recovery of electrical over-range.
If the inner dead zone is less than upper limit of dead zone or more than lower limit of dead zone, it is determined as the recovery of electrical over-range.
Jitter Diagnosis
[image:2.612.199.408.277.438.2]value
1
0 One changes
Less than or equal to 2 seconds
Jitter start time Two changes three changes four changes five
changes changessix
[image:3.612.98.516.76.201.2]5 seconds Jitter recovery jitter value 1 0 time
Figure 3. Schematic diagram of jitter state. Figure 4. Schematic diagram of jitter recovery.
In decision condition of jitter, the values of X, Y and Z are the same for all DI channels. It is required for each change of the values to recompile and download PLC controller and the users can not configure these values by themselves. Under the default condition, the values of X, Y and Z are 2, 6 and 5 respectively.
System Self-Diagnosis Design
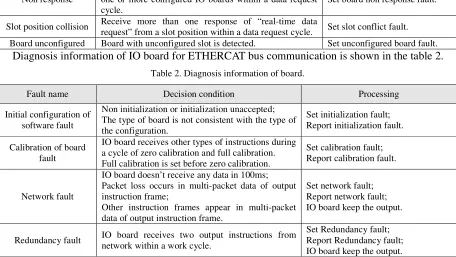
[image:3.612.76.536.369.462.2]The self-diagnosis of PLC system in field control station mainly includes the diagnosis of the communication module and the report of faults [3]. The logic of ETHERCAT bus protocol has self -diagnosis function, and the information of diagnosis is illustrated in the table 1.
Table 1. Diagnosis information.
Fault name Decision condition Processing
Non response
Don’t receive a response of “real-time data request” from one or more configured IO boards within a data request cycle.
Set board non response fault.
Slot position collision Receive more than one response of “real-time data
request” from a slot position within a data request cycle. Set slot conflict fault. Board unconfigured Board with unconfigured slot is detected. Set unconfigured board fault.
Diagnosis information of IO board for ETHERCAT bus communication is shown in the table 2.
Table 2. Diagnosis information of board.
Fault name Decision condition Processing
Initial configuration of software fault
Non initialization or initialization unaccepted; The type of board is not consistent with the type of the configuration.
Set initialization fault; Report initialization fault.
Calibration of board fault
IO board receives other types of instructions during a cycle of zero calibration and full calibration. Full calibration is set before zero calibration.
Set calibration fault; Report calibration fault.
Network fault
IO board doesn’t receive any data in 100ms; Packet loss occurs in multi-packet data of output instruction frame;
Other instruction frames appear in multi-packet data of output instruction frame.
Set network fault; Report network fault; IO board keep the output.
Redundancy fault IO board receives two output instructions from network within a work cycle.
Set Redundancy fault; Report Redundancy fault; IO board keep the output.
[image:3.612.78.534.406.663.2]Analog input board makes detection on A/D (analog signal/digital signal) chip in program run [4]. It is determined as fault state if there is no refresh conversion data in the specified time. Analog output board realizes the self-diagnosis function by comparing output circuit to the output voltage value of DAC (digital to analog converter) which is read back by A/D. Switch output board realizes the self-diagnosis function of channels by adopting two groups of single-pole double-throw relays as output device. One group of contacts is used for output, and the other is used to read back the output signal state of the relay.
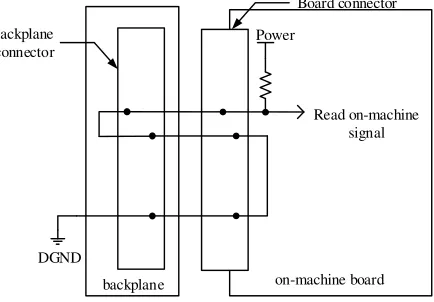
The function of on-machine diagnosis is to prevent the board from misoperation in program run before the board has been fully installed. It is realized by MPU (main process unit) board and IO board in the control station. The design scheme is to take three points with a certain distance on the backplane connector of the board. It is determined as board on-machine when only these three points are connected. The design schematic diagram is shown as figure 5.
backplane on-machine board
Read on-machine signal
DGND
Power Backplane
connector
[image:4.612.207.424.230.381.2]Board connector
Figure 5. Schematic diagram of board on-machine diagnosis.
When fault occurs, the indicator light of “ERROR” in the board will be illuminated. If the communication section could retain normal function in case of faults, the board will not respond to output instructions, but report faults through acquisition instructions.
Fault Diagnosis Design
Display Design of Diagnosis Function
The diagnosis information of faults has two ways to output: display in man-machine monitoring system and in indicator lights. Specifically, Power diagnosis is displayed by DO (digital signal output), including display in local indicator light and in man-machine monitoring system. Cabinet and hardware diagnosis is displayed in the same way as power diagnosis. The rest of diagnosis can be only displayed in man-machine monitoring system.
The objects of the fault diagnosis displayed in man-machine monitoring system includes: operator station device, server device, gateway device, control station device, network, clock source, cabinet, printer and so on. The fault information displayed in man-machine monitoring system only contains normal and fault. Red represents fault, and green represents normal [5].
Device Diagnosis
Client program of node diagnosis
Server program of node diagnosis
Diagnostic data
Master-slave synchronous data
Server (master)
Server (slave) Operator station Operator station
Main process unit(master)
[image:5.612.189.433.62.265.2]Main process unit(slave)
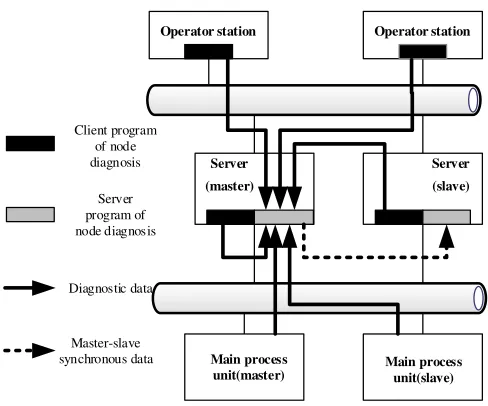
Figure 6. Schematic design of PLC device diagnosis.
The relevant devices of server and operator station are diagnosed by node diagnosis client task in the server [6]. The diagnosis information is sent to the node diagnosis client task by monitoring network. Then the information analysis is made, through which the corresponding device point name could be found. Then the point value is written in real-time database of the server, while the corresponding events are generated such as alarm, full record, etc. The server is synchronizing the diagnosis information all the time.
The diagnosis of all the devices in control station is completed by PLC controller. The diagnosis information of corresponding device is transmitted to node diagnosis client task in the server by the system network diagnosis protocol. Then the information analysis is made, through which the corresponding device point name could be found. Then the point value is written in real-time database of the server, while the corresponding events are generated such as alarm, full record, etc. All combined faults are diagnosed by the node diagnosis client task [7].
Cabinet Diagnosis
The diagnosis data flow of cabinet state is shown as figure 7.
MPU
(master) MPU
(slave)
Cabinet 1 sensor
MPU
(master) MPU
(slave)
I/O card
Cabinet 2
MPU
(master) MPU
(slave)
I/O card
Cabinet 3 sensor
I/O card sensor
Fault indicating
lamp
Fault indicating
lamp
Fault indicating
lamp
Hard-wired MPU:main process unit
Figure 7. Schematic diagram of cabinet diagnosis.
The cabinet state detection includes temperature detection, power loss detection, master control heartbeat line detection, door switch detection, fan rotation/stop detection, etc.
[image:5.612.159.453.476.675.2]board of cabinet 2 through a hard wire. The MPU of cabinet 2 receives the information from IO survey point and uploads it to the server. The server is responsible for generating the corresponding events such as alarm, full record, etc.
The state point of cabinet is not classed as the device point. Therefore its alarm and full record are not classed as device alarm and full record. The operator station can read the information of the corresponding point by configuration picture to display the cabinet state.
Summary
With the coming of industrial era 4.0, the concept of intelligent manufacturing has spread to the factories. Future PLC products are not only used for acquisition of simple digital value and analog value, but also need to have stronger communication ability, more advanced performance configuration, much better safety and reliability in order to adapt to the development of the industry. In this paper, the design scheme of system signal validity diagnosis and device diagnosis function is proposed, which is in line with the industrial control standard. The design scheme greatly improves the reliability and maintainability of the PLC control system, and fully meets the requirements of industrial control.
Nevertheless, it is necessary for autonomous PLC control system to perfect modules function, optimize performance and improve system reliability. Ultimately, the autonomous PLC control system is expected to be series of competitive product of localization and be popularized in other industries of high security requirements, such as water conservancy, nuclear power plant, equipment manufacturing, etc.
References
[1] Chen Bo, Research on the Frame and Several Key Techniques of Distributed Remote Fault Diagnosis Expert System, Dalian, Dalian University of Technology (2002) .
[2] Wei Xia, Xu Minqiang, Lu Weiguo, A Synthesis of Fault Diagnosis Technology and Application, Thermal Turbine. 4(2004) 238-242.
[3] Guo Qiyi, Feng Jianghua, Liu Kean, Zhou Guifa, Yao XiaoYang, Huang Shike, Reliability Engineering and Fault Diagnosis Technology, first ed., Science Press , Bei Jing, 2016.
[4] Zhao Jong, Zhou Qicai, Xiong Xiaolei, Zhou Jie, Equipment Fault Diagnosis and Remote Maintenance Technology , first ed., Machinery Industry Press , Bei Jing, 2014.
[5] Tong Deichun, Yao Baohuan, Engineering Signal Processing and Equipment Diagnosis, first ed., Science Press Co., Ltd., Bei Jing, 2008.
[6] Zhang Ailing, Zhang Wenying, Zhang Ruijin, The Latest Development of Fault Detection and Diagnosis for Control System, Systems Engineering and Electronics. 28(2007) 485-491.