2017 2nd International Conference on Software, Multimedia and Communication Engineering (SMCE 2017) ISBN: 978-1-60595-458-5
Aircraft Detection in Remote Sensing Images via CNN
Multi-scale Feature Representation
Jia-qi WANG
1, Xin NIU
1, Peng ZHANG
1, Yong DOU
1and Fei XIA
21National Laboratory for Parallel and Distributed Processing, National University of Defense Technology, Changsha City, Hunan Province, China
2Institute of Electronic Information Warfare, Naval University of Engineering, Wuhan City, Hubei Province, China
Keywords: Aircraft detection, Remote sensing, Single Shot Detection (SSD), CNN.
Abstract. Aircraft detection in remote sensing images is an intractable challenge. The current aircraft detection methods have limited representative capabilities and heavy computational costs. This paper studies how to apply multi-scale feature representation of Convolutional Neural Networks (CNN) to aircraft detection by qualitatively and quantitatively analyzing the performance of Single Shot Detection (SSD) approach. At first, we find that low-level detectors are not robust enough to detect as the semantic gap issue. Therefore we propose a data driven hyper-parameter selection method to alleviate this problem by determining appropriate hyper-parameters of sliding window and default box shape. Besides, we employ a multi-scale training strategy to enhance low-level predictive detectors. Finally, we propose an accurate and efficient aircraft detection framework. Experimental results illustrate that our method could achieve 96.84% AP at 20 FPS on NVIDIA TITAN X. Compared with original SSD method, our proposed approach achived 2.13% AP improvement.
Introduction
With the rapid development of remote sensing technologies over the past decade, object detection in very high resolution (VHR) remote sensing images has gained sustained interest, particularly aircraft detection, due to the high value of research and application both in military and civilian areas. Aircraft detection can be viewed as a task consists of both the object location and object recognition, which is a typical large-range and multi-scale object detection problem. As shown in Figure 1, the increased size and spatial resolution of remote sensing make aircraft detection in large-size VHR image (length of side ranges from 3000 to 10000 pixels and covers an area of 1-8 km2) an intractable challenge: the complex and cluttered background is more misleading. Besides, aircraft detection usually suffers from huge intra-class variability in visual appearance and object scale, which restricts the improvement of detection performance.
The conventional studies for machine learning-based aircraft detection is mainly composed of hand-craft feature extraction and classifier training. These methods exploited low-level features such as the shape feature, texture feature, or local image feature (e.g., histogram of oriented gradients (HOG) and scale-invariant feature transform (SIFT)). For example, Liu et al. [1] proposed a coarse-to-fine process which integrates shape prior and region information to detect aircraft. Polat et al. [2] developed a learning-based aircraft detection system using Gabor features and support vector machine (SVM). Generally, feature representation of object take on a crucial role for the detection task. However, feature engineering heavily relies on professional experience and prior knowledge. Meanwhile, the hand-craft feature has limited capacity in high-level semantic information as well as generalization ability.
representative, and detectors without yielding region proposals such as YOLO [5] and SSD [6]. R-CNN adopted selective search [7] to generate region proposals before running classification with a ConvNet. Fast R-CNN [8] and Faster R-CNN [9] speeded up R-CNN by directly producing proposals on the high-level convolutional feature map and using region of interest (RoI) pooling to share ConvNet forward computation. Zhang et al. [10] proposed a coupled CNN method, which combined a candidate region proposal network and a localization network to extract the proposals and simultaneously locate the aircraft in large-size VHR images. Zhang et al. [11] developed a two-stage algorithm to detect building with a sliding windows approach and a CNN classifier.
Despite ConvNets feature representation is richer in semantic information as well as more robust to variance in scale, detecting objects at very different appearances and scales in VHR remote sensing images remains a great challenge, as the contradiction of both keeping high semantic information and high-resolution levels among convolutional feature layers. To overcome this obstacle, a series of recent works improve R-CNN by combining features from multiple layers before making prediction or combining predictions from different layers in a ConvNet. These approaches include Hypercolumns [12], HyperNet [13], ION [14], SDP CNN [15], and MS-CNN [16]. Similarly, Tang et al. [17] proposed a hyper region proposal network (HRPN) to extract vehicle-like targets with a combination of hierarchical feature maps, and thus successfully utilized Faster R-CNN for vehicle detection in VHR remote sensing images.
Although improved Faster R-CNN methods that combine multiple layers have relieved the conflict between feature spatial resolution and feature semantic information, these approaches have been too computationally intensive for large-size VHR remote sensing images. In fact, a deep ConvNet computes a feature hierarchy layer by layer with subsampling layers, which has an inherent
multi-scale feature representation. Liu et al. [6] presented Single Shot Detection (SSD) without resampling pixels or features for bounding box hypotheses, and it performs better than Faster R-CNN in the balance of accuracy and speed. SSD method is one of the first attempts at using a ConvNet’s pyramid feature hierarchy as if it were a featured image pyramid [18], thus it naturally leverages the multi-scale feature representations of a ConvNet’s feature hierarchy, and therefore it is suited to multi-scale object detection, especially small object.
Due to the huge difference between VHR remote sensing images and nature scene images, directly employing SSD for aircraft detection in such large-size image faces severe challenges: (1) aircraft (length of side ranges from 25 to 480 pixels) in VHR remote sensing images (range from 3000 to 10000 pixels) are relatively smaller than those in nature scene images, thus increasing the difficult of task, especially for the lower-level predictive layers (e.g., conv4_3, conv7) to detect small objects;(2) As shown in Figure 4, the aircraft category contains various kinds of airplanes (e.g., fighter, helicopter, transport aircraft), thus the detection task encounters huge intra-class variability in visual appearance and object scale.
In this paper, we qualitatively and quantitatively analyze the performance of Single Shot Detection (SSD) applied to aircraft detection in VHR remote sensing images, and investigate the semantic gap problem that exists in multi-scale feature representation detection method. Based on these findings, we propose a Data Driven Hyper-parameter Selection method to tune parameters of sliding window and default box using prior statistics information. Besides, we propose Multi-scale Training as a data augment method to mainly enhance lower-level predictive layer detectors by more small scale training data. Finally, we propose an accurate and efficient aircraft detection framework (see Figure 1). Experiments demonstrate that our method could achieve 96.84% AP at 20 FPS using NVIDIA TITAN X. In comparison with original SSD, 2.13% AP improvement could be reaped.
Figure 1. Proposed framework. Training/testing samples are cropped by sliding window. SSD is trained to detect different scale of objects with corresponding predictive layer detector. Then Non Maximum Suppression (NMS) is used per
category to redundant boxes. Finally the framework generates predictions of category and location.
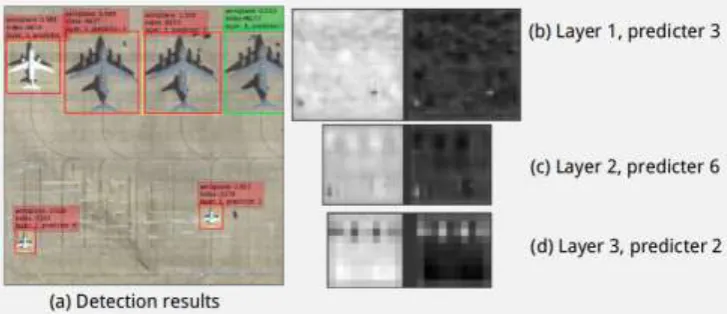
Figure 2. Score maps of predicted objects, whicn are the most activated layers among all predictive layers. As for the two-class classification, there are two score maps constructing a class predictor, denoting background and aircraft respectively. In SSD, the lower left airplane is responsed strongest by layer 2, therefore its location in layer 2 score map is
highlight. However, the large transport airplanes only activate higher predicted layer (in this case is layer 3).
Proposed Methods
The framework of our aircraft detection method is illustrated in Figure 1. For training, we construct multi-scale training dataset by cropping original large-size images into patches using two different scales sliding windows. Then, the correspondence between ground truth and the default boxes is established by an improved matching strategy we proposed. Finally, SSD network takes all the training image patches as input for training, and each predictive layer produces a fixed set of detection predictions using a set of convolutional filters. Note that a detector corresponds to a certain aspect ratio default box from one of six predictive layers, and it is composed of a group of filters for scoring confidence and regressing offset to default box. That is to say, SSD totally has 33 detectors (3+5*6), each independent detector contains 4 filters to predict offsets of default box locations (i.e., x, y, width, height) and class number filters to predict category scores. As a matter of fact, SSD can be considered as a class-specific RPN [19]. It means a kind of fully convolutional strategy that replaces the 2-class (object or not) fully-connected(fc) classifier layer of RPN with a multi-class convolutional classifier layer.
[image:3.595.115.479.261.418.2]category. By combining predictions for all default boxes with different scales and aspect ratios from all locations of many feature maps, we have a diverse set of predictions, covering various input object sizes and shapes. As shown in Figure 2, different scale of aircraft responses corresponding scale predictive layer.
Data Driven Hyper-parameter Selection
Sliding Window. SSD is a kind of fully convolutional neural network, which can theoretically take arbitrary size image as input. For nature scene images, generally the original images are resized to fixed size (e.g., 300*300 or 500*500) for a trade-off between accuracy and speed. Whereas, due to the limitation of GPU memory, it is hard to process a whole VHR remote sensing image (side length from 3000 to 10000 pixels) in a deep convolutional neural network. Scanning the original image with sliding window to crop large-size into small patches is a feasible approach to tackle this problem, but few studies account for how to select hyper-parameters (i.e., sliding window size, stride) in VHR remote sensing images. According to the statistical analysis of training samples as well as the characteristics of SSD model, we propose some principles of hyper-parameter selection.
As for the size of sliding window, its lower bound should larger than the length of longest side among the ground truth bounding boxes. Under the hypothesis of identically distribution between training data set and testing data set, we can gain the prior information of bounding box size by calculating statistic in training data set. Figure 3 (a) shows the distribution of side length ranges from 25 pixels to 470 pixels, which focus on 25 pixels to 200 pixels. Meanwhile, in consideration of GPU memory capacity, the size of sliding window can’t be too large. In order to make a trade-off between accuracy and speed, we usually compress original image into a fixed size (e.g., SSD300), thus saves GPU memory and computational overhead. Experiment in Section 3 shows that the compression ratio is better no more than 1/3.
Reasonable selection of sliding window is directly relating to the detection speed and recall rate for a whole VHR remote sensing image: excessively short stride generates a mass of overlaps, thus leads to redundant and computationally expensive convolutional operations; On the other side, too long stride may miss some aircrafts that are at the edge of sliding window. To find a suitable stride for certain data set, we propose a formula to determine the range of stride as follow:
upper bound win maxLen
S L L (1) where Supper bound denotes upper bound of stride, Lwin is length of sliding window, LmaxLen is max
length of longer bounding box side.
Based on the aforementioned principles, we can conclude that as long as the GPU memory capacity enough, the larger the sliding window the better. Take SSD300 as an example, the suitable sliding window size is 900*900, with a stride 400.
Scale and Aspect Ratio. SSD applied default boxes with different shapes to several feature maps of different scale predictive layers, so the default box can be understood as a kind of multi-scale anchor box used in RPN (Region Proposal Network). At training phase we need to establish the correspondence between the ground truth and the default boxes by a matching strategy, making different scale predictive layers train/predict corresponding objects possible. The original paper of SSD proposed an one-to-many mapping strategy to ensure that each ground truth has at least one matched default box. Note that the positive training samples are matched default boxes but not the original ground truth.
Original SSD designed the tiling so that specific feature map locations learn to be responsive to specific areas of the image and particular scales of the objects [6]. The scale of the default boxes for each predictive feature map is computed as follow:
1 ,
1,
1
max min k min
s s
s s k k m
m
where smin is 0.2 and smax is 0.95, meaning the lowest layer has a scale of 0.2 and the highest layer has
[image:5.595.88.511.119.332.2]a scale of 0.95 (the proportion relative to input size). Accordingly, Liu et al. empirically imposed different aspect ratios for the defaults boxes, and denotes them as ar∈ {1, 2, 3, 1/2, 1/3}.
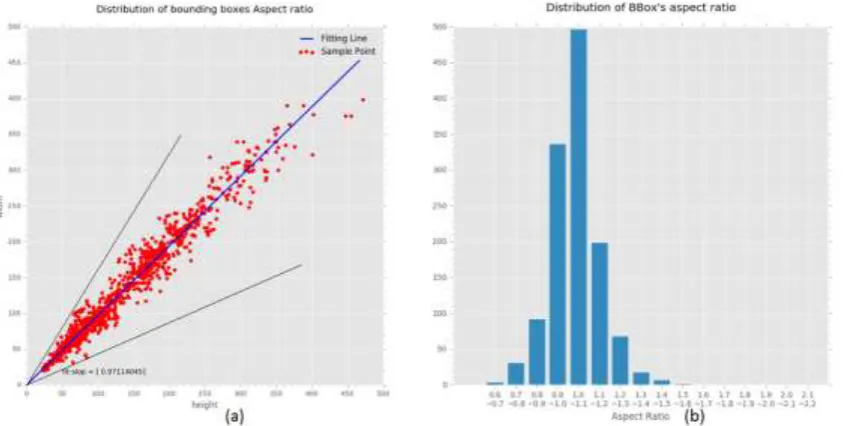
Figure 3. Distribution of ground truth bounding boxes width and height.
Yet in practice, different datasets have their own characteristics, it is more reasonable to design a distribution of default boxes to best fit a specific dataset. Therefore, we propose a Data Driven Hyper-parameter Selection method to fine tune parameters of scale and aspect ratio. Firstly, we collect and process statistic data about side length and aspect ratio, analyzing the distribution of aspect ratio. As show in Figure 3 (a), the scatter chart denotes the width and height distribution of all ground truth bounding boxes. We use least square method to fit the slope of width and height over all points, which is plotted by the blue line. The fittest slope is 0.971, which is very closed to 1. The lower right black line is lower bound of aspect ratio (0.667), and the upper left black line is upper bound of aspect ratio (2.13). In Figure 3 (b), the distribution of bounding boxes’ aspect ratio also reflect similar rule: the variation range of aspect ratio is very narrow (0.6~2.2), which mainly focus on 1:1. According to the statistics of our dataset, we can specific hyper-parameters of aspect ratio as {1, 13/10, 2, 10/13, 2}.
The mapping strategy of SSD at training phase makes it possible to leverage multi-scale feature representation and train different predictive layer with corresponding scale objects. However, the empirical scale factors may not suitable for other dataset. For example, our aircraft detection dataset contains quantities of small bounding box. If we still use original scale parameters, the basic size of default box in first layer is 90 (input size 900, scale factor is 0.1), then most of ground truth bounding boxes will be matched with default box of first layer. This phenomenon makes higher predictive layer lack training data, eventually it harms the total detection performance. In order to match default boxes with ground truth more balanced, we propose an algorithm to calculate scale factors for all predictive layers with a given dataset.
According to the Experiment in Section 3, our proposed method is able to determine scale parameters according to a given dataset, which makes more predictive layers well-trained and leverages the advantages of multi-scale feature representation.
Multi-Scale Training
The original SSD used a fixed input resolution of 300*300 (or 500*500), making the single-scale training data insufficient to train multi-scale detectors over multiple predictive layers. Besides, the data augmentation of original SSD has a drawback that the randomly sampled image patches can only be up sampling, which may lead to insufficient training in lower level predictive layer detectors.
Instead of fixing the input image size, we employ two sizes of sliding windows in train phase to build multi-scale training dataset. In consider of the aforementioned principles that select sliding hyper-parameters, we choose 900*900 and 1500*1500 sliding windows for SSD500 training phase. Experiment below shows that this improvement can make Average Precision (AP) raise by 1.5%.
Experiments
In this section, we qualitatively and quantitatively analyze the performance of Single Shot Detection (SSD) applied to aircraft detection in VHR remote sensing images, provide experimental basis for our proposed methods, and finally prove our proposed detection frame is effective and feasible. Our experiments were implemented based on the deep learning framework Caffe [20], running on a server with Intel Xeon E5-1620 CPU and a NVIDIA TITAN X (Maxwell architecture) GPU. The operating system was Ubuntu 14.04 LTS.
Dataset
sliding windows with 11003 aircraft objects were used as a training dataset. A total of 2612 sliding windows with 6856 aircraft objects were used as a testing dataset, which was generated by a single 900*900 sliding window.
Figure 4. Various kinds of aircraft in our dataset.
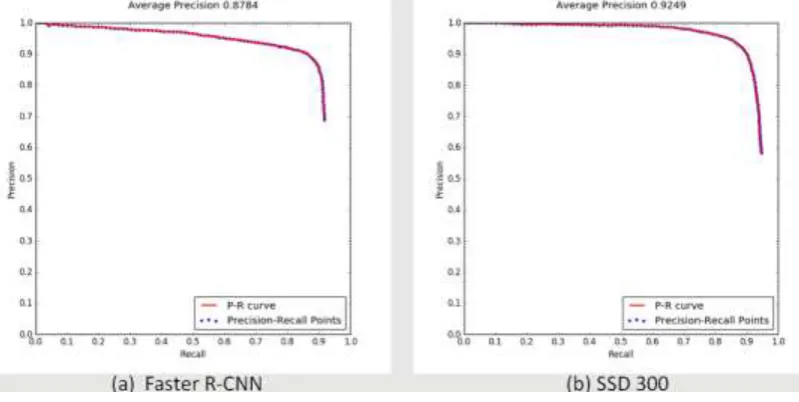
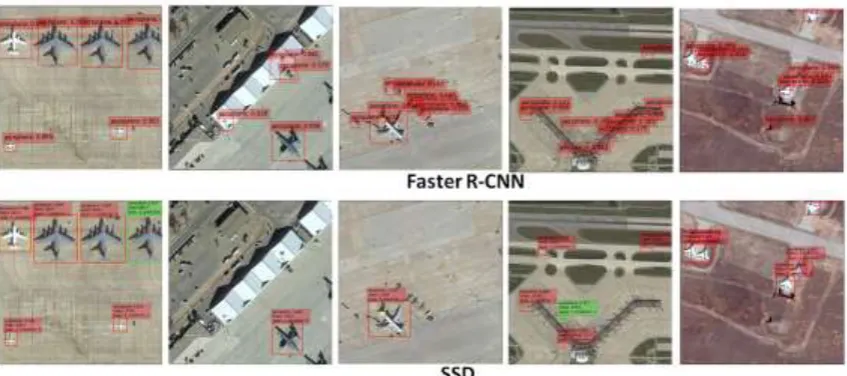
SSD300 VS. Faster R-CNN. In order to demonstrate the advantages of multi-scale feature representation, we compare the detection performance between SSD300 and Faster R-CNN. Figure 5 shows the Precision-Recall curve of Faster R-CNN and original SSD300 respectively. Both methods have comparable recall rate, but Faster R-CNN performs weakly in precision. Combined with analysis of Figure 6, we found that this phenomenon may be caused by predictive confusion: multi-scale samples were trained in a single scale representation layer. For example, Figure 6 first row shows that Faster R-CNN confuses overall aircraft with its tail; the model also confuses small airplane with airplane-like background. Table 1 shows the comparison between Faster R-CNN and SSD300, SSD outperforms the Faster R-CNN both in accuracy and speed.
[image:7.595.98.498.414.615.2]Figure 6. Detection results of Faster R-CNN and SSD300. Red, green, yellow colors represent high confidence (> 0.5), low confidence prediction (< 0.5) and ground truth respectively.
Table 1. Detection performance comparison.
Method Average Precision(AP) FPS (Frame per Second)
Faster R-CNN 87.84% 6
SSD300 (Original) 92.49% 47
SSD300 (HPS) 93.24% 47
SSD500 (Original) 94.71% 20
SSD500(HPS) 95.34% 20
SSD500(HPS+MST) 96.84% 20
Input Resolution VS. Semantic Information. SSD leveragesCNN inherent multi-scale feature representation to enhance detection performance of multiple scale objects especially small objects. This in-network feature hierarchy produces feature maps of different spatial resolutions, but introduces large semantic gaps [18] caused by different depths. It means that high-resolution maps have low-level semantic information that harm their representational capacity for object recognition. To fill this gap, the original author advised enlarging the input resolution for small object dataset such as MS COCO. However, few people explain why SSD500 outperforms SSD300. In this experiment we will investigate which factor dominates the improvement of the SSD method.
Figure 7. P-R curve of SSD300 and SSD500.
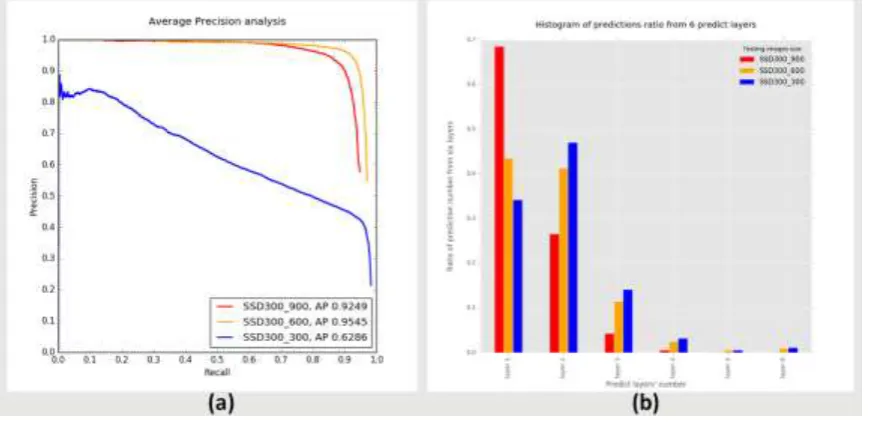
Preliminary experiments above shows that lower layers’ detectors may not perform well as the existence of semantic gap, we conjecture that under the condition of ensuring ground truth has enough feature resolution (at least 1*1) on the feature map, the higher layer’s detector is trained/tested, the better detection performance SSD has. To verify this hypothesis, we conduct the following experiment. We use low resolution images (900*900 compress into 300*300) training SSD300 model, then testing it with multiply resolution images(900, 600, 400), observing the distribution of predicted object number which belongs to corresponding layer. As shown in Figure 8, the same fine tuned SSD model is applied to three different resolution testing datasets. The top peak of AP is 0.9545 tested in 600*600 resolution dataset. Particularly, the number of predicted objects in layer 2 significantly increases from 27% (SSD300_900) to 41% (SSD300_600), which indicates that taking fully advantege of higher predictive layer helps SSD improve its performance. With the input resolution increasing to 300*300, the AP decreases sharply.
Figure 8. Test SSD300 with multiple resolution.
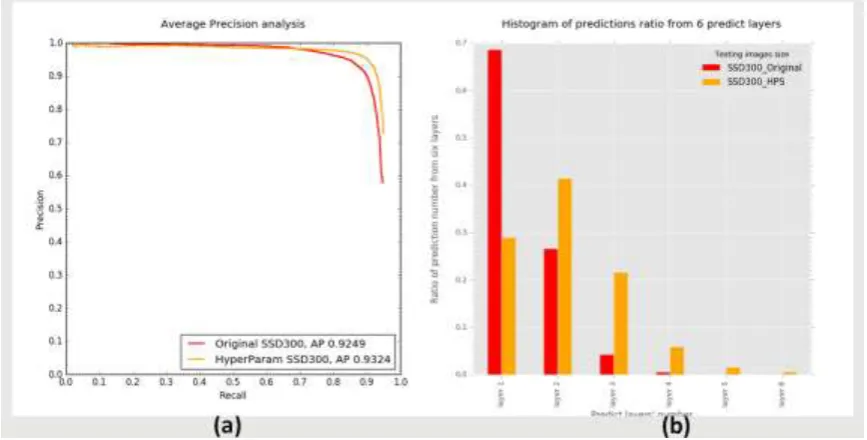
[image:9.595.82.517.462.675.2]shows comparison detection performance between original SSD300 and optimized hyper-parameter SSD300. Figure 9 (a) (b) shows the histogram of predicted objects ratio over six predictive layers.It is obvious that optimized hyper-parameter SSD300 leverage more balanced predictive layer to detect objects. Meanwhile, the Precision-Recall curve demonstrates that our method works effectively, raising AP by 1%.
Figure 9. Comparison original SSD with Hyper-parameter Selection SSD.
Multi-scale Training. In experiment 2, we have demonstrated that low level feature representation may not robust enough to detect a wide range scale of objects, and feature representation with more semantic information mainly contributes the detection improvement. In experiment 3, we propose a data driven method to fine tune hyper-parameters of scale and aspect ratio, which improves SSD mapping strategy. As a matter of fact, the proposed method makes a trade-off: it forces the SSD to detect objects with relatively higher predictive layer which has richer semantic information in spite of lower feature spatial resolution. In order to strengthen training of low-level detectors, multi-scale training is very necessary. We utilize two resolution training samples (900*900, 1500*1500) and compress them into 500*500 to train SSD500. When in the test phase, only 900*900 patches are used to detect aircraft. Figure 10 shows the prominent result for the aircraft detection: AP rises to 0.9684; both recall and precision stay at very high level.
[image:10.595.85.514.541.755.2]Summary
In this paper, we explore how to apply state-of-the-art SSD detection method to the aircraft detection in VHR remote sensing images. We find out that there is semantic gap in the multi-scale feature representation, and propose a data driven method to make multiple predictive layer trained more balanced and sufficient. Besides, we employ multi-scale training to enhance low-level predictive layers. Finally, we demonstrate our aircraft detection framework using CNN multi-scale feature representation is accuracy and efficient. Inspired by newest detection methods employing multi-scale feature representation [18][21], we will focus on feature fusion of multi-scale layers to solve the semantic gap problem for the further research.
Acknowledgements
We acknowledge support by the National Natural Science Foundation of China under Grants of U1435219 and 61402507.
References
[1] G. Liu, X. Sun, K. Fu, and H. Wang, Aircraft recognition in high-resolution satellite images using coarse-to-fine shape prior[J], Geoscience and Remote Sensing Letters, IEEE, vol. 10, no. 3, pp. 573-577, 2013.
[2] Polat E, Yildiz C. Stationary Aircraft Detection from Satellite Images[J]. IU-Journal of Electrical & Electronics Engineering, 2012, 12(2): 1523-1528.
[3] Bengio Y, Courville A, Vincent P. Representation learning: A review and new perspectives[J]. IEEE transactions on pattern analysis and machine intelligence, 2013, 35(8): 1798-1828.
[4] Girshick R, Donahue J, Darrell T, et al. Rich feature hierarchies for accurate object detection and semantic segmentation[C]// Proceedings of the IEEE conference on computer vision and pattern recognition. 2014: 580-587.
[5] Redmon J, Divvala S, Girshick R, et al. You only look once: Unified, real-time object detection[C].// Proceedings of the IEEE Conference on Computer Vision and Pattern Recognition. 2016: 779-788.
[6] Liu W, Anguelov D, Erhan D, et al. SSD: Single shot multibox detector[C].// European Conference on Computer Vision. Springer International Publishing, 2016: 21-37.
[7] Uijlings J R R, Van De Sande K E A, Gevers T, et al. Selective search for object recognition[J]. International journal of computer vision, 2013, 104(2): 154-171.
[8] Girshick R. Fast r-cnn[C].// Proceedings of the IEEE International Conference on Computer Vision. 2015: 1440-1448.
[9] Ren S, He K, Girshick R, et al. Faster r-cnn: Towards real-time object detection with region proposal networks[C]//Advances in neural information processing systems. 2015: 91-99.
[10] Zhang F, Du B, Zhang L, et al. Weakly Supervised Learning Based on Coupled Convolutional Neural Networks for Aircraft Detection[J]. IEEE Transactions on Geoscience and Remote Sensing, 2016, 54(9): 5553-5563.
[12]Hariharan B, Arbeláez P, Girshick R, et al. Hypercolumns for object segmentation and fine-grained localization[C]//Proceedings of the IEEE Conference on Computer Vision and Pattern Recognition. 2015: 447-456.
[13]Kong T, Yao A, Chen Y, et al. HyperNet: towards accurate region proposal generation and joint object detection[C]//Proceedings of the IEEE Conference on Computer Vision and Pattern Recognition. 2016: 845-853.
[14]Bell S, Lawrence Zitnick C, Bala K, et al. Inside-outside net: Detecting objects in context with skip pooling and recurrent neural networks[C]//Proceedings of the IEEE Conference on Computer Vision and Pattern Recognition. 2016: 2874-2883.
[15]Yang F, Choi W, Lin Y. Exploit all the layers: Fast and accurate cnn object detector with scale dependent pooling and cascaded rejection classifiers[C]//Proceedings of the IEEE Conference on Computer Vision and Pattern Recognition. 2016: 2129-2137.
[16]Cai Z, Fan Q, Feris R S, et al. A unified multi-scale deep convolutional neural network for fast object detection[C]//European Conference on Computer Vision. Springer International Publishing, 2016: 354-370.
[17]Tang T, Zhou S, Deng Z, et al. Vehicle Detection in Aerial Images Based on Region Convolutional Neural Networks and Hard Negative Example Mining[J]. Sensors, 2017, 17(2): 336.
[18]Lin T Y, Dollár P, Girshick R, et al. Feature Pyramid Networks for Object Detection[J]. arXiv preprint arXiv:1612.03144, 2016.
[19]Li Y, He K, Sun J. R-fcn: Object detection via region-based fully convolutional networks[C]//Advances in Neural Information Processing Systems. 2016: 379-387.
[20]Jia Y, Shelhamer E, Donahue J, et al. Caffe: Convolutional architecture for fast feature embedding[C]//Proceedings of the 22nd ACM international conference on Multimedia. ACM, 2014: 675-678.