2017 2nd International Conference on Information Technology and Management Engineering (ITME 2017) ISBN: 978-1-60595-415-8
Research on the Optimization of Logistics System in an Automobile
Assembly Workshop
Li-jun LIU
College of Management Science and Engineering, Shandong Institute of Business and Technology, Yantai, China
Keywords: Layout planning, Logistics system, Operating unit.
Abstract. In this paper, the SLP method is used to improve the assembly shop layout of automobile manufacturing enterprises. By adjusting the position relationship among each operating unit, the enterprise logistics system is optimized, the material handling route is smooth, the logistics cost is reduced, and the enterprise benefit is increased.
Introduction
With the development of Chinese automobile manufacturing industry, the increasingly fierce market competition, has changed from seller's market to buyer's market, the truck manufacturing enterprise as an example, competition from the original "FAW liberation " and "Dongfeng Automobile" two male hegemony, to the current development of FAW, east wind car, heavy truck, Foton, China Shaanxi Automobile Group, SAIC Hongyan, beiben heavy truck, Anhui Jianghuai feudal lords vying for the throne of the situation. Faced with the complex and changeable personalized market demand, the automobile manufacturers feel unprecedented tremendous competitive pressure. The competition between enterprises is no longer a simple price competition, but the performance of the comprehensive strength of product design, quality, cost, delivery time, reaction speed, the customer demand for customer service, service supply chain as the center of the competition. This requires enterprises from their own actual situation, in accordance with the requirements of high efficiency and low cost, rapid changes in the logistics operation mode of the current enterprise, continuous improvement of logistics system, improve the competitiveness of enterprises [1], survive and develop better space.
The logistics system of automobile manufacturing enterprise quick and efficient operation can effectively reduce the cost of logistics, help enterprises to improve the internal and external environment, enhance the competitive market position, increase market shares and gain greater economic benefits. Reasonable factory layout design is a prerequisite to optimize enterprise logistics system, improve work efficiency and reduce operating costs.
In this paper, an automobile manufacturing company assembly workshop layout design as the background, using the system layout (Systematic Layout Planning, referred to as SLP) to optimize the
[2] method, to improve itslogistics operation environment, reduce logistics cost.
Assembly Line Process and Problems
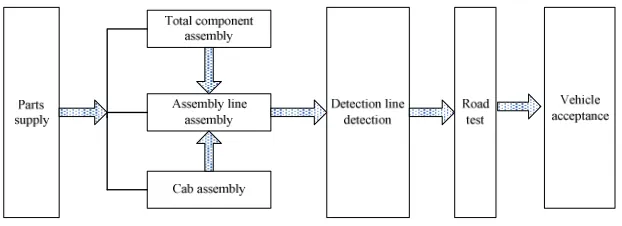
Figure 1. Automobile assembly process flow chart.
Car loading vehicle assembly needs part mainly includes: the balance shaft assembly, rear axle, front axle, engine assembly, tire etc. There are workshop chassis parts storage areas, loading area and personnel activity area layout unreasonable phenomenon, caused by the logistics route cross, personnel and material moving route is long, resulting in material handling time increased, the increase of logistics costs, affecting the production efficiency of assembly line. To solve the above problems, SLP method is used to optimize the workshop layout.
Workshop Layout Optimization
Operating Unit Division
[image:2.612.88.521.377.654.2]According to the existing facilities of the assembly workshop the operation units are shown in Table 1.
Table 1. Operating unit.
order number
Operation unit name remarks
1 Chassis parts storage area Main storage station assembly required parts
2 Front trim plate, frame storage area Assembly line required frame, cab assembly required interior trim
3 The steering assembly packaging area 12 station installation required to packing machine parts
4 Drive shaft storage area 8 station assembly required drive shaft storage area
5 Balance shaft packing area 2 station required balance shaft, spring and sub district inventory
6 After the bridge packing area 7 position required rear axle and leaf spring storage and packing areas
7 The front axle loading area 9 station required front axle and leaf spring storage and packing areas
8 Interior line Interior decoration wiring
9 Assembly line 2 station Key position of assembly line
10 Assembly line 7station
11 Assembly line 8 station Key position of assembly line
12 Assembly line 9 station
13 Assembly line 12 station Key position of assembly line
Logistics Analysis
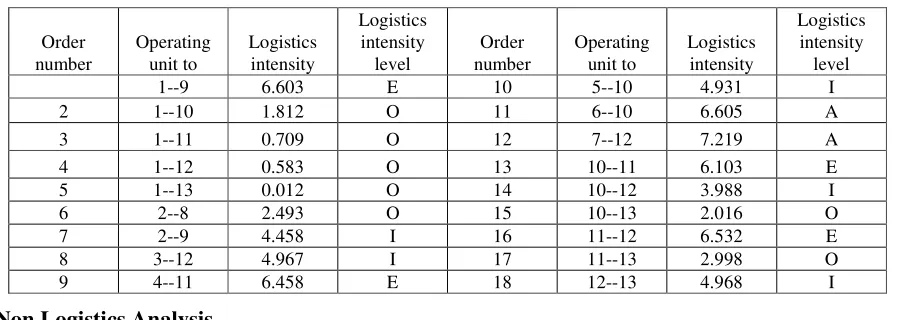
10%, 0. Main operating units and logistics intensity as shown in Table 2. table does not list the units of logistics strength grade U.
Table 2. Logistics intensity of main units.
Order number Operating unit to Logistics intensity Logistics intensity level Order number Operating unit to Logistics intensity Logistics intensity level
1--9 6.603 E 10 5--10 4.931 I
2 1--10 1.812 O 11 6--10 6.605 A
3 1--11 0.709 O 12 7--12 7.219 A
4 1--12 0.583 O 13 10--11 6.103 E
5 1--13 0.012 O 14 10--12 3.988 I
6 2--8 2.493 O 15 10--13 2.016 O
7 2--9 4.458 I 16 11--12 6.532 E
8 3--12 4.967 I 17 11--13 2.998 O
9 4--11 6.458 E 18 12--13 4.968 I
Non Logistics Analysis
The degree of close relationship between units and non logistics factors (reasons) are shown in Table 3.
Table 3. Non logistics intensity summary sheet.
order number
Unit of operations (logistics)
Non logistics close
degree level Reason code Code and reason
1 1-2 I 7 1 requirements for process connection 2 operations are similar in nature
3 use the same kind of station equipment
4 use the same processing equipment 5 operation of the same group of
persons
6 work contact frequency 7 to facilitate supervision and
management 8 frequent and emergency use
9 using the same file
2 1-9 I 6, 7
3 1-10 O 6, 7
4 1-11 O 6, 7
5 1-12 O 6, 7
6 1-13 O 6, 7
7 2-7 O 5, 6
8 2-8 I 6, 8
9 2-9 I 6, 8
10 3-13 E 1, 7
11 4-11 E 1, 7
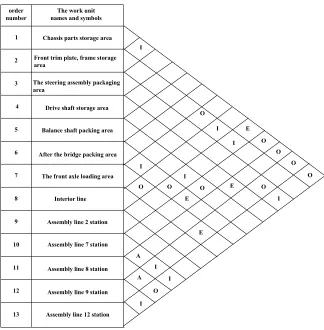
Comprehensive Analysis of Mutual Relations
First, determine the relative importance of logistics and non logistics relationship between the proportion of m:n=1:2. Second, calculate quantify the level of logistics intensity and the degree of
closeness of non logisticsas shown in Table 4. (partial data).Finally, an integrated relationship graph
[image:3.612.108.504.591.740.2]is established, as shown in Figure 2.
Table 4. Operating unit comprehensive correlation calculation table.
order number operating unit to close relationship comprehensive relationship non logistics relationship
(weighted value: 2)
logistics relationship (weighted value: 1)
grade score grade score score grade
1 1-2 I 2 U 0 4 I
2 1-3 U 0 U 0 0 U
……
76 11-12 A 4 E 3 11 A
77 11-13 O 1 O 1 3 O
order number
1
The work unit names and symbols
2
3
4
5
6
7
8
9
10
11
12
13
I
E Chassis parts storage area
Front trim plate, frame storage area
The steering assembly packaging area
Drive shaft storage area
Balance shaft packing area
After the bridge packing area
The front axle loading area
Interior line
Assembly line 2 station
Assembly line 7 station
Assembly line 8 station
Assembly line 9 station
Assembly line 12 station
O O
O
O O
I
E I
I
E
A I
I A
O
I
I
O I O
O O
[image:4.612.143.467.66.396.2]E
Figure 2. Comprehensive correlation diagram of operation unit.
Workplace Unit Location Correlation Diagram
[image:4.612.86.527.502.545.2]According to the level of comprehensive relationship level according to the level of comprehensive proximity scores (as shown in Table 5), determine the position relationship between different levels of operating units.
Table 5. Ranking table of comprehensive proximity degree for operating unit.
operating unit code 1 2 3 4 5 6 7 8 9 10 11 12 13
Comprehensive approach degree ranking 9 7 3 3 3 6 7 3 8 13 13 13 8
compositor 4 8 10 11 12 9 7 13 5 1 2 3 6
The location map of the operating unit is shown in Figure 3.
Figure 3. The operating unit position diagram.
C
h
a
ss
is
p
a
rt
s s
to
ra
g
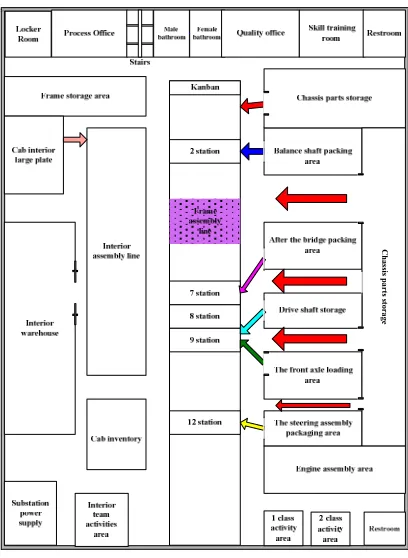
[image:5.612.203.407.64.343.2]e
Figure 4. Post layout improvement.
Summary
In this paper, the layout of assembly workshop is optimized by system layout design (SLP), the result indicates that the improved plant layout makes the process more flexible, shorten the balance shaft, steering assembly cycle device assembly, front axle and rear axle, make the logistics operation more smoothly, reduce the material handling distance, reduce the logistics cost, improve production efficiency, but also make the assembly site work environment has been greatly improved.
Acknowledgement
This research was financially supported by the Natural fund of Shandong Province (No. ZR2014GL007).
References
[1] Duonan Yi, Qing Xin, Hongwen Zhao. Research on lean supply chain logistics system of automobile manufacturing enterprise [J]. Enterprise reform and management, 2016, 8:147-151.