Phosphorus is one of the most important mac-roelements indispensable for plant growth and development (Marschner 1986). Although soybean P2O5 requirements are considerably lesser than those of N or K, P is equally important for plant growth and productivity. Because of P functions for the growth and metabolism of plants, its deficiency retarded plant growth, cell and leaf expansion (Marschner 1986). Some authors reported that P sufficiency significantly increased leaf surface of soybean (Wu 1999). It is known that P regulation of photosynthesis and carbohydrate metabolism in leaves was one of the major factors limiting the plant growth (Marschner 1986). Moreover, P has stimulating effects on nodule growth and nitro-genase activity in nodules of legumes (Jakobsen 1985, Israel 1987, Hart 1989, Tang et al. 2001); on the contrary its deficiency decreased nodule
mass (Singleton et al. 1985, Israel 1987, Ribet and Drevon 1995, Drevon and Hartwig 1997), nodule number (Jakobsen 1985, Tang et al. 2001) and nitrogenase activity (Sa and Israel 1991).
All these reports focused on how exogenous P affected nodule formation and function. There is no report on the role of P reserved in seedlings in nodulation and nodule function. Seed’s P was sufficient to establish nodules; however in the case of the lack of P, plants used the stored P in the seed to grow. Otherwise, nodules can be au-toregulated without effect by exogenous P (Claudio et al. 2002). Early nodulation might be related to the P concentration in seeds; high P in seeds may thus facilitate the establishment of symbiosis (Claudio et al. 2002). However, the relationship between seedling P concentration, nodulation and nodule function is unclear. In this work, we
Seedling treatments and phosphorus solution concentrations
affect nodulation and nodule functions in soybean
(
Glycine max
L.)
S.J. Miao
1, 2, 3, X.Z. Han
1, X.B. Liu
1, Y.F. Qiao
11
Northeast Institute of Geography and Agrio-Ecology, CAS, Harbin, China
2
College of Resource and Environment, Northeast Agricultural University, Harbin
Heilongjiang, China
3
Graduate School, CAS, Beijing, China
ABSTRACT
The effect of three seedling treatments: T0, normal germination; T1, cotyledons removed; T2, cotyledons removed 5 days earlier than in T1;and two phosphorus levels (P0 and P30) on nodulation and nodule function in soybean
[Gly-cine max (L.) Merr.] were investigated in nutrient solution culture. The number of nodules formed at P0 was in the
order T2 > T0 > T1, but it was T0 > T2 > T1 at P30. Nodule dry weight per plant had the same tendency as the nodule number. Nodule size (dry weight per nodule) in seedlings ranged from 0.601 to 1.089 mg in the order T0 > T1 > T2, regardless of P level. For example, nodule size in T0 was larger by 86% and 52% than T2 at P0 and P30, respectively. Furthermore, regardless of P level, a specific acetylene reduction activity (ARA, µM C2H4/h/g nodule) increased with P content in seedlings, but no significant difference was found (P < 0.05). Leghemoglobin (Lb) content was not significantly affected by P level; however, seedlings (T0 and T1) significantly affected the Lb content per unit plant biomass (P < 0.05). All these results suggest that seedling P content plays a key role in nodulation and nodule func-tion of soybean.
Keywords: soybean [Glycine max (L.) Merr. ]; seedling; phosphorus nutrition; nitrogenase activity; leghemoglobin concentration
present the results on the role of seedling P in the nodulation and nodule functions of soybean [Glycine max (L.) Merr.].
MATERIAL AND METHODS
Uniform-sized seeds of soybeans [Glycine max (L.) Merr., cv. Heinong 35] were imbibed in water overnight, and then transferred onto a mesh sitting above an aerated solution (pH ~ 6) of 1 mmol/l CaCl2 and 5 µmol/l H3BO3. Three P treatments were used on seedlings: (1) T0, total P concentration was 1.316 mg/g, normal germination; (2) T1, total P concentration was 1.232 mg/g, cotyledons were removed when the first true leaf partly expanded, and (3) T2, total P concentration was 1.067 mg/g, cotyledons were removed 5 days earlier than in T1. Seeds were germinated for 4–5 days when radicles were about 4 cm in length. Eighteen uniform seed-lings were transferred into a 5-litre pot with two P nutrient solution, i.e. 0 [P0] and 30 [P30] µmol/l. Phosphorus was supplied as KH2PO4 in nutrient solution. The composition of the solution was as follows (in µmol/l): K2SO4, 600; MgSO4.7 H2O, 200; CaCl2.2 H2O, 600; H3BO3, 5; ZnSO4.7 H2O, 0.75; MnSO4.H2O, 1; CoSO4.7 H2O, 0.2; CuSO4.5 H2O, 0.2; Na2MoO4.H2O, 0.03; Fe-NaEDTA, 10.
Bradyrhizobium japonicum strain Hefeng 25 was added into pots as water suspension to reach the final concentration of about 105 cells/ml in
the nutrient solution. This suspension was added again 4 days later when solution was renewed. Plants were grown in a glasshouse at 25/15°C day and night, respectively. Nutrient solutions were renewed twice a week. Solution pH was adjusted to 5.5–6.0 once or twice a day, if necessary. Treatments were replicated six times and randomized within replicates.
Plants were harvested in the 5th week after the
treatments. Plants were separated into shoots, roots and nodules. Biomass of all parts was measured and nodule number was calculated. Chlorophyll was extracted with acetone and ethanol and was measured with ultraviolet spectrometer (UV2500 Japan). The total and specific acetylene reduc-tion activity (ARA) was analyzed with gas chro-matograph (GC2010 Shimadzu Japan) (Tang et al. 2001). Leghemoglobin content was measured with ultraviolet spectrometer (UV2500 Japan). Plant tissues were oven-dried at 80°C to the constant weight for P and N analysis. The total P content after digestion with H2SO4 and H2O2 was analyzed with ultraviolet spectrometer (UV2500 Japan) and
N concentration was analyzed by auto-titration (Lu 2000).
The SAS software was used to identify any sta-tistically significant differences. Duncan’s multiple test at P < 0.05 was used to compare the means of the treatments.
RESULTS
Plant growth
From the 2nd week, whole shoots appeared pale
green, and kept the color until the later stage; this indicated a slight nitrogen deficiency. By the 5th week after the treatments, chlorophyll
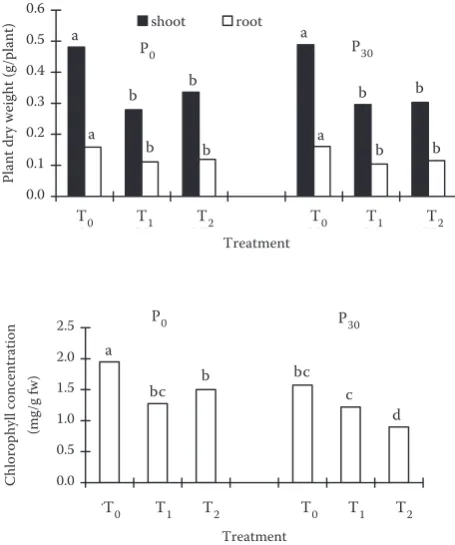
[image:2.595.304.532.413.686.2]con-centration in the youngest expanded leaves in T0 was the highest in this experiment, irrespective of P level (Figure 1). For the same seedlings, chlo-rophyll concentration in the youngest expanded leaves decreased as P level increased. Dry weight of shoots and roots in T0 at P0 level was by 41% and 33% higher than in T2, respectively; for P30 level they were higher by 63% and 33%. For both shoots
Figure 1. Dry weight of shoots and roots and chloro-phyll concentration in the youngest expanded leaves of soybean grown at T0, T1 and T2 seedlings and P0 and P30 levels after 5 weeks; letters on the top of the bars indicate significant differences at 5% level
0.0 0.1 0.2 0.3 0.4 0.5 0.6
T0 T1 T2 T0 T1 T2
Treatment
Pl
an
t d
ry
w
ei
gh
t (
g/
pl
an
t) shoot root
0.0 0.5 1.0 1.5 2.0 2.5
T0 T1 T2 T0 T1 T2
Treatment
C
hlo
ro
ph
yll c
onc
en
trati
on
(mg
/g
fw
)
P0 P30
P30 P0
T0 T1 T2 T0 T1 T2
T0 T1 T2 T0 T1 T2 a
a b
b b
b
a
a b
b b
b
a
bc b bc c
and roots, dry weight was in the order: T0 > T2 > T1 (Figure 1). Significant differences were re-corded in the case of dry weight of shoots and roots between T0 and T2; however, no significant differences were observed between T0 and T1 or T1 and T2. We found that the effect of seedlings on dry weight of shoots and roots was larger than that of P level.
Nodule formation
Due to the low temperature, nodules firstly ap-peared during the 3rd week after the treatment.
Nodule number recorded in the 5th week was
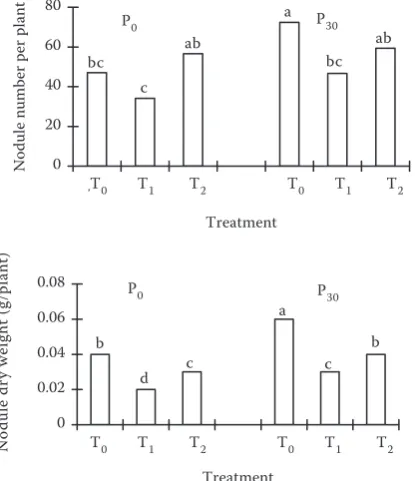
af-fected both by seedlings and P level (Figure 2). At P0 level, seedlings did not significantly affect nodule number; it ranged from 36 to 50 per plant in the order: T2 > T0 > T1; at P30 level it ranged from 48 to 60 per plant in the order: T0 > T2 > T1. A significant difference was found between T0 and T2 (Figure 2): P30 level increased the nodule number per plant; T0 and T2 treatments showed significant differ-ences. For both P levels, nodule dry weight per plant ranged from 0.021 to 0.061 g in the order: T0 > T2 > T1 (Figure 2); for P30 treatment, nodule number and nodule dry weight per plant in T0 were by 11% and 75% higher than in T2. At the same
P level, seedlings significantly affected nodule dry weight. Similarly, under the same seedling treat-ment, the effect of P level on nodule dry weight was significantly different (Figure 2).
Irrespective of P level, nodule size (dry weight per nodule) in seedlings ranged from 0.601 to 1.089 mg in the order: T0 > T1 > T2 (Figure 3). Dry weight per nodule in T1 was by 86% and 52% higher than in T2 at P0 and P30 levels, respectively. A statisti-cal analysis showed that the effect of seedlings on nodule size was significant at P0 level; however, at P30 level, this effect was found only between T0 and T1, or between T0 and T2 (Figure 3).
Nodule function
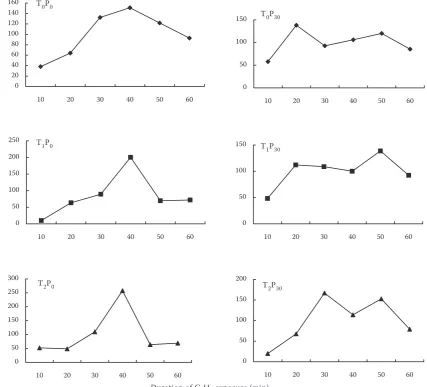
[image:3.595.74.282.64.305.2]At the same P level, specific ARA (µM C2H4/h/g nodule) in T0 was higher than in other treatments, but no statistically significant difference was found. Moreover, P level increased specific ARA in the same seedlings. The effect of seedlings on total ARA (µM C2H4/h/g plant) was minor at both P levels, but P level significantly increased total ARA in T2 (Figure 4). The total ARA in T2 seedlings was the largest at P30 level (8.21 µM C2H4/h/g nodule), followed by T0 (P30), T1 (P0), T2 (P0), T0 (P0) and T1(P30). C2H2-induced decline (C2H2-ID) of ARA was observed in all the treatments (Figure 5). When 10% C2H2 was introduced into the gas mixture bottle with nodulated roots, the amount of C2H4 produced increased, and then decreased with du-ration of C2H2 exposure time, but the time until reaching the maximum value was different. At P0 level, the amount of C2H4 from nodule activity
Figure 2. Number of nodules and nodule dry weight of soybean grown at T0, T1 and T2 seedlings and P0 and P30 levels in the 5th week; letters on the top of the bars indicate significant differences at 5% level
Figure 3. Nodule size (dry weight per nodule) of soybean grown at T0, T1 and T2 seedlings and P0 and P30 levels in the 5th week; letters on the top of the bars indicate significant differences at 5% level
0 20 40 60 80
T0 T1 T2 T0 T1 T2
Treatment
N
od
ul
e
num
be
r p
er
p
la
nt
0 0.02 0.04 0.06 0.08
T0 T1 T2 T0 T1 T2
Treatment
N
od
ul
e
dw
(g
/p
la
nt
)
P0 P30
P30 P0
bc c
bc ab ab
a
a
c b b
d c
N
od
ul
e
dr
y
w
ei
gh
t (
g/
pl
an
t)
T0 T1 T2 T0 T1 T2
T0 T1 T2 T0 T1 T2
0.0 0.2 0.4 0.6 0.8 1.0 1.2
T0 T1 T2 T0 T1 T2
Treatment
D
ry
w
ei
gh
t p
er
n
od
ul
e
(mg
/g
) P0 P30
T0 T1 T2 T0 T1 T2 a
b
c
a b
[image:3.595.309.526.564.693.2]increased, reaching the maximum value 40 min after initial exposure to C2H2. However, a double peak curve of C2H2-ID was produced by the nodule activity at P30 level (Figure 5).
[image:4.595.69.522.62.183.2]The effect of seedlings on leghemoglobin (Lb) concentration per nodule was greater than the effect of P level, especially in T0 and T1 seed-lings; a significant difference was found in these
Figure 4. Total and specific acetylene reduction activity (ARA) of soybean grown at T0, T1 and T2 seedlings and P0 and P30 levels in the 5th week; ARA was the average ARA measured between 10 and 60 min after C
2H2 exposure; letters on the top of the bars indicate significant differences at 5% level
Figure 5. Time course of acetylene reduction activity (ARA) measured on soybean grown at T0, T1 and T2 seed-lings and P0 and P30 levels in the 5th week
0 20 40 60 80 100 120 140 160
10 20 30 40 50 60
0 50 100 150 200 250
10 20 30 40 50 60
0 50 100 150 200 250 300
10 20 30 40 50 60
0 50 100 150
10 20 30 40 50 60
0 50 100 150
10 20 30 40 50 60
0 50 100 150 200
10 20 30 40 50 60
T0P0
T1P0
T2P0
T0P30
T1P30
T2P30
Re la tiv e C2 H2 r ed uc tio n ac tiv ity (% o f a ve ra ge b et w ee n 10 –6 0 m in )
Duration of C2H2 exposure (min)
ab ab b
ab ab a 0.0 1.0 2.0 3.0 4.0 5.0 6.0
T0P0 T1P0 T2P0 T0P30 T1P30 T2P30
Treatment To ta l a ce ty le ne re du ct io n (µ M C2 H4 /h /g p la nt ) 0.0 5.0 10.0 15.0 20.0 25.0 30.0
T0 T1 T2 T0 T1 T2
Treatment Sp ec ifi c ac et yl en e re du ct io n (µ M C2 H4 /h /g pl an t)
P0 P30 P
0 P30
[image:4.595.80.508.328.715.2]seedlings at both P levels (Figure 6). For the same seedlings, P level had no significant effect on Lb concentration. The effect of P level on Lb concentration per plant was the same as that on specific ARA, especially at P30. All these data suggest that Lb concentration in nodules can be considered as a characteristic of nitrogen fixation efficiency (Shleev et al. 2001).
Chemical composition
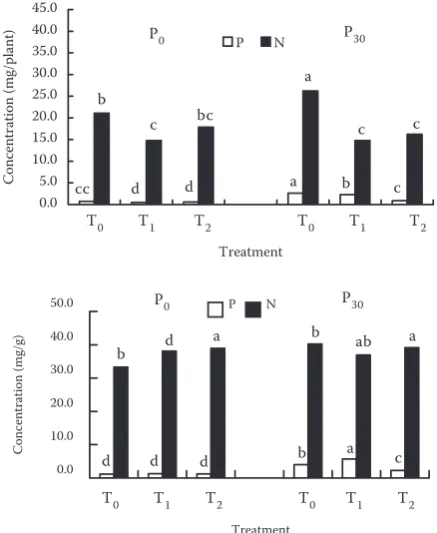
Nitrogen concentration (per plant and per unit weight) in seedlings ranged from 14.75 to 26.18 mg/ plant and from 33.28 to 40.22 mg/g in the order: T0 > T2 > T1, except for nitrogen concentration per unit weight at P0 level (Figure 7). Regardless of P level, a significant difference of nitrogen con-centration per plant was found between T0 and T1. For nitrogen concentration per unit weight, a significant difference was observed between T0 and T2 at both P levels (Figure 7). Seedling effect on P concentration per plant or per unit weight was low at P0 level. However, P level significantly
affected P concentration, and a significant differ-ence was observed among seedling treatments. For example, P concentration per plant and per unit weight in T0 increased from 0.74 to 2.62 mg/plant and from 1.16 to 4.04 mg/g, respectively.
DISCUSSION
Nodule formation
[image:5.595.64.289.64.351.2]In the present study, before inoculating Bradyrhizobium japonicum strains, P concentra-tion of T0 seedlings was 1.316 mg/g, for T1 it was 1.232 mg/g, and for T2 it was 1.067 mg/g. Nodule number was significantly affected by P levels in T0 and T2, not in T1 (Figure 2). This is because T2 seedlings had a longer total root length, which provided more chances for bacteria infection than T1. Thus, when enough nodule bacteria were present, seedling P concentration became a key factor for optimal nodulation if the P concentra-tion was low. P concentraconcentra-tions in the seedlings
Figure 6. Leghemoglobin (Lb) concentration of soybean grown at T0, T1 and T2 seedlings and P0 and P30 levels in the 5th week; letters on the top of the bars indicate significant differences at 5% level
Figure 7. Nitrogen and P concentrations of soybean grown at T0, T1 and T2 seedlings and P0 and P30 levels in the 5th week; letters on the top of the bars indicate significant differences at 5% level
Note: P and N concentrations in plants were statisti-cally analyzed separately
1.35 1.40 1.45 1.50 1.55 1.60 1.65 1.70 1.75 1.80 1.85 1.90
T0 T1 T2 T0 T1 T2
Treatment
Lb
c
on
ce
nt
ra
tio
n
(m
g/
g
no
du
le
fw
)
0.00 0.05 0.10 0.15 0.20 0.25 0.30 0.35
T0 T1 T2 T0 T1 T2
Treatment
Lb
c
on
ce
nt
ra
tio
n
(mg
/g
p
la
nt
d
w
)
P0 P30
P0 P30
T0 T1 T2 T0 T1 T2 T0 T1 T2 T0 T1 T2 ab
ab ab
a
b b
a
b b
a
b b
0.0 5.0 10.0 15.0 20.0 25.0 30.0 35.0 40.0 45.0
T0 T1 T2 T0 T1 T2
Treatment
C
on
ce
nt
ra
tio
n
(m
g/
pl
an
t) P N
0.0 10.0 20.0 30.0 40.0 50.0
T0 T1 T2 T0 T1 T2
Treatment
C
on
ce
nt
ra
tion
(m
g/
g)
P N
P0 P30
P0 P30
T0 T1 T2 T0 T1 T2
T0 T1 T2 T0 T1 T2 b
c bc
a
c c
b d a b ab a
cc d d a b c
[image:5.595.309.528.388.655.2]were higher than required P level for rhizobia growth and survival (0.5 µM P) (O’Hara et al. 1988). This showed that seedlings contained enough P to establish nodules, and were thus comparable with the seeds that reserved P as reported previously (Valverde and Wall 1999). Although the plants of T2 seedlings had the low-est P0 concentration, nodule number was bigger than in T1, which might result from the fact that the plants in T2 had higher biomass than T1, and so more photoassimilates were transferred to nodule for nodule formation and growth (Voisin et al. 2003). Chlorophyll concentration in the youngest expanded leaves at P30 level was in the order: T0 > T1 > T2 in the 5th week, indicating that
photosynthesis could not explain the variability in growth of roots and nodules (Voisin et al 2003). Hence, in this experiment, plant dry weight was T0 > T2 > T1, and this trend was the same in the case of nodule number and nodule dry weight. Nevertheless, the effect of seedlings on plant growth was weaker than on nodule formation and development, suggesting thus that P had a direct and positive stimulation of nodulation in legumes (Jakobsen 1985, Israel 1987, 1993, Sanginga et al. 1989, Hellsten and Huss-Danell 2001). However, an elevated P level appeared to increase nodule development, which is in agree-ment with our previous reports (Miao et al. 2007) and other reports on soybean (Singleton et al. 1985, Drevon and Hartwig 1997).
Nodule function
This study suggested that P content in seedlings played a specific role in nodule function of soybean; its effect on nitrogenase activity per unit nodule mass was bigger than on total nitrogenase activ-ity (Figure 4). In soybean, P deficiency-decreased nitrogenase activity was suggested to result from inhibited energy-dependent reactions in nodules (Tang et al. 2001), decreased Lb concentration in nodules or decreased bacteroid biomass (Sa and Israel 1991). In our experiment, low P in seedlings decreased Lb concentration per plant irrespective of P level, which may be caused by the fact that Lb is an oxygen-carrying heme protein in nodules, capable of binding oxygen to produce an oxygen-ated form only in active reduced state (Shleev et al. 2001). Thus, nodule was kept under a low free O2 condition to prevent nitrogenase from irreversible inactivation by O2 (Takashi et al. 2001). In mature nodules, Lb protein was detected at the onset of
nitrogen fixation (Katerina et al. 2000), and the higher nitrogenase activity plants had a relatively higher Lb concentration per plant in our experi-ment (Figure 6). Lb also played an essential role in nitrogen fixation in nodules (Appleby 1984, Becana and Sprent 1989).
Regardless of P level, the C2H2-ID in nitroge-nase activity under low P in seedlings was larger than that under high concentrations, which is consistent with previous findings on soybean (Ribet and Drevon 1995, Drevon and Hartwig 1997) and Medicago truncatula L. (Tang et al. 2001). At 0 µmol/l P level, the C2H2-ID reached the maximum value 40 min after C2H2 introduc-tion into the gas mixture; however, the two peaks appeared after 20 and 50 min (Figure 5). The effect of seedlings and P level on nitrogen concentration per plant or per unit weight was much like that on ARA. These results show that P-increased ARA is associated with increased N concentration and N accumulation (Tang et al. 2001).
REFERENCES
Appleby C.A. (1984): Leghemoglobin and Rhizobium respiration. Ann. Rev. Plant Physiol., 35: 443–478. Becana M., Sprent J.I. (1989): Effect of nitrate on
com-ponents of nodule leghemoglobins. J. Exp. Bot., 40: 725–731.
Claudio V., Alejandro F., Luis G.W. (2002): Phosphorus and the regulation of nodulation in the actinorhizal symbiosis between Discaria trinervis (Rhamnaceae) and Frankia BCU110501. New Phytol., 153: 43–51. Drevon J.J., Hartwig U.A. (1997): Phosphorus
defi-ciency increased the argon-induced decline of nodule nitrogenase activity in soybean and alfalfa. Planta, 201: 463–469.
Hart A.L. (1989): Distribution of phosphorus in nodulat-ed white clover plants. J. Plant Nutr., 12: 159–171. Hellsten A., Huss-Danell K. (2001): Interaction effects
of nitrogen and phosphorus on nodulation in red clover (Trifolium pratense L.). Acta Agr. Scand., 49: 135–142.
Israel D.W. (1987): Investigation of the role of phospho-rus in symbiotic dinitrogen fixation. Plant Physiol., 84: 835–840.
Israel D.W. (1993): Symbiotic dinitrogen fixation and host-plant growth during development of and re-covery from phosphorus deficiency. Physiol. Plant., 88: 294–300.
Corresponding author:
Yunfa Qiao, Ph.D., Northeast Institute of Geography and Agro-Ecology, CAS, 150081 Harbin, China e-mail: [email protected]
Katerina L., Gautam S., Robert V.K., Raularredondo-Peter (2000): Characterization of leghemoglobin from a mimosoid legume, Leucaena esculenta, root nodules. R. Bras. Fisiol. Veg., 12: 37–44.
Lu R.K. (2000): The Analysis Method of Soil Agro-Chemistry. Chinese Agricultural Academic Press. (In Chinese)
Marschner H. (1986): Mineral nutrition in higher plants. Wd Ltd. The Greystone Press, Antrim, Northern Ireland.
Miao S.J., Qiao Y.F., Han X.Z., AN M. (2007): Phospho-rus deficiency decreases early nodule development in soybean (Glycine max L.). Pedosphere, 17: 36–43. O’Hara G.W., Boonkerd N., Dilworth M.J. (1988):
Min-eral constraints to nitrogen fixation. Plant Soil, 108: 93–110.
Ribet J., Drevon J.J. (1995): Phosphorus deficiency in-creases the acetylene-induced decline in nitrogenase activity in soybean [Glycine max (L.) Merr.]. J. Exp. Bot., 46: 1479–1486.
Sa T.M., Israel D.W. (1991): Energy status and function-ing of phosphorus-deficient soybean nodules. Plant Physiol., 97: 928–935.
Sanginga N., Danso S.A., Bowen G.D. (1989): Nodu-lation and growth response of Allocasuarina and Casuarina species to phosphorus fertilization. Plant Soil, 118: 125–132.
Shleev S.V., Rozov F.N., Topunov A.F. (2001): A method for producing multiple forms of metleghemoglobin
re-ductase and leghemoglobin components from Lupine nodules. Appl. Biochem. Microbiol., 37: 195–200. Singleton P.W., AbdelMagid H.M, Tavares J.W. (1985):
Effect of phosphorus on the effectiveness of strains of Rhizobium japonicum. Soil Sci. Soc. Am. J., 49: 613–616.
Takashi S., Noriyasu O., Hiroyuki F., Norikuni O., Ku-ni S., Takuji O. (2001): Changes in four leghemoglobin components in nodules of hypernodulating soybean (Glycine max [L.] Merr.) mutant and its parent in the early nodule developmental stage. Plant Soil, 237: 129–135.
Tang C., Hinsinger P.J., Drevon J., Jaillard B. (2001): Phosphorus deficiency impairs early nodule function-ing and enhances proton release in roots of Medicago truncatula L. Ann. Bot., 88: 131–138.
Valverde C., Wall L.G. (1999): Regulation of nodula-tion in Discaria trinervis (Rhamnaceae) – Frankia symbiosis. Can. J. Bot., 77: 1302–1310.
Voisin A.S., Salon C., Jeudy C., Warembourg F.R. (2003): Root and nodule growth in Pisum sativum L. in rela-tion to photosynthesis: analysis using 13C-labelling. Ann. Bot., 92: 557–563.
Wu M.C., Xiao C.Z, Zheng P.Y. (1999): Study on the physiological function of phosphorus to soybean. Sci. Agr. Sin., 32: 59–65.