The Factor Structure and Composite Reliability of the Rosenberg Self-Esteem Scale among Ex-Prisoners
Daniel Boduszek, PhD (University of Huddersfield)
Philip Hyland, BA (University of Ulster)
Katie Dhingra, PhD (University of Huddersfield)
John Mallett, PhD (University of Ulster)
Version accepted for publication
Abstract
The aim of this study was to examine the factor structure and composite reliability of the
Rosenberg Self-Esteem Scale (RSES) using a sample of 669 ex-prisoners identified in the
National Survey of American Life. Six distinct factor models, with uncorrelated measurement
error terms, were specified and tested using confirmatory factor analysis (CFA). Results
indicated that the two-factor model consisting of positive and negative latent variables
provided a better fit to the data than the alternative models. Moreover, only positive
self-esteem was a significant predictor of recidivism. Composite reliability indicated that the two
factors were measured with very good reliability. The results consequently provide additional
First copyedit complete.
Introduction
Self-esteem has received considerable empirical attention within the criminal psychological
literature as a predictor of various types of offending behaviour. Low levels of self-esteem
have been found to be related to a range of violent offending behaviour including
interpersonal attacks (Sutherland & Shepherd, 2002), sexual assaults (Shine, McCloskey, &
Newton, 2002), and partner-violence in both males (Sharpe & Taylor, 1999) and females
(Lewis, Travea, & Fremouw, 2002). Other research, however, has suggested that higher
levels of self-esteem are associated with violent offending behaviour (e.g., Baumeister,
Smart, & Boden, 1996; Kernis, Grannemann & Barclay, 1989). Although inconsistencies
exist within the criminal psychological literature about the precise nature of the relationship
between self-esteem and criminal behaviour, the empirical evidence does support the utility
of studying self-esteem as a predictor of criminality.
The Rosenberg Self-esteem Scale (RSES; Rosenberg, 1989) is one of the most widely
used measures in self-esteem research. Rosenberg initially conceptualised self-esteem as an
aspect of one’s self-concept which reflects positive and negative evaluations of the self
(Rosenberg, 1965). The RSES was designed to measure self-esteem as single construct.
However, research findings are inconsistent with respect to the appropriate number of latent
factors necessary to explain the underlying factor structure of the measure. Shevlin, Bunting,
and Lewis (1995), using confirmatory factor analytic (CFA) procedures, found support for
the accuracy of a one-factor solution. Other research findings have suggested a range of
multi-factorial solutions (see Huang & Dong, 2012 for a review),including a large body of
research thathas indicated that the RSES is more appropriately conceptualized as a
O’Malley, 1986; Carmines & Zeller, 1979; Dobson, Goudy, Keith, & Powers, 1979;
Kaufmann, Rasinski, Lee, & West, 1991).
In an attempt to reconcile these contrary findings, Marsh (1996) tested six alternative
structural models, including a series of correlated uniqueness models, and found evidence
that the RSES could be accurately represented by a single common factor and a method
factor primarily composed of the negatively phrased indicators. Subsequently, Tomas and
Oliver (1999) investigated nine alternative models using CFA procedures. These structural
models included the traditional one- and two-factor solutions along with a series of
non-traditional model conceptualizations, including method effects and correlated errors terms.
The results of their analysis were in line with those of Marsh’s (1996) findings of a single
common factor and a method factor mainly comprised of the negatively worded items.
However, Marsh analyzed a 7-item scale, instead of the full 10-item scale, and Thomas and
Oliver used the Spanish version of the RSES. Consequently, Marsh’s results may not apply to
the full RSES, and Thomas and Oliver’s results may not generalize to studies conducted in
the United States due to cultural differences – individualism versus collectivism – which may
impact on self-concept and attitudes towards the self (Diener & Diener, 1995; Markus &
Kitayama, 1991).Dunbar, Ford, Hunt, and Der (2000) reported that a one-factor solution with
correlated errors for the negatively worded items was a better fit than a two-factor solution.
The results of this study can be criticised, however, due to the authors’ reliance on the use of
correlating errors. Brown (2006) has argued that item errors should never be correlated to
improve model fit as such procedures imply the presence of an additional unspecified latent
construct. Additionally, correlation of item errors can lead to difficulties in interpretation and
Despite the frequency with which self-esteem is measured among prisoner and
offender samples, to date only one study has examined the factor structure of the RSES
among this population. Boduszek, Shevlin, Mallett, Hyland and O’Kane (2012) compared the
one- and two-factor solutions of the RSES among a sample of 312 recidivistic, male Polish
prisoners. CFA methods with uncorrelated item errors were employed and the results
indicated that the two-factor solution, representing the positive and negative components of
self-esteem, was an adequate fit of the data, and far superior to the one-factor
conceptualization. This study constituted the first empirical evidence that, among offender
populations, self-esteem is best conceptualized as two distinct constructs. These results offer
a possible explanation for the inconsistencies in the criminal psychological literature with
regards to the relationship of self-esteem to criminal offending. Moreover, Boduszek,
Adamson, Shevlin, Mallett and Hyland (2013) demonstrated the differential impact of the
two factors (positive and negative) of self-esteem in a later study on criminal cognitions. The
negative but not positive component of self-esteem was found to be a significant predictor of
the cognitive centrality aspect of criminal social identity. This suggests that these factors
measure substantially different underlying constructs, and that self-esteem might not be
considered unifactorial among offender populations.
Given the inconsistencies in the literature concerning the appropriate factor structure
of the RSES, and the paucity of such research among offender populations, the current study
aims to replicate and extend the study of Boduszek et al.(2012) by investigating the
underlying factor structure of the RSES among a large sample of male and female
ex-prisoners from the United States of America. To achieve this, a series of six competing
Methods
Participants
The sample consisted of 669 ex-prisoners (68.5%, n = 458 male) identified in the National
Survey of American Life (for more information on the survey see Jackson et al., 2004). The
participants ranged in age from 18 to 84 years (M = 41.06, SD = 14.01). Most ex-prisoners
(90.4%; n = 605) were born in the United States and the majority (86.5%; n = 579) were
Black or African American. At the time of data collection, 64.3% (n = 430) of respondents
were currently employed, 15.1% (n = 101) unemployed, and 20.6% (n = 138) not in the
labour force. In addition, 38.0% (n = 254) of respondents indicated their marital status as
married or cohabiting, 30.8% (n = 206) as divorced, separated or widowed, and 31.2% (n =
209) as never married. The frequency of imprisonment reported ranged from 1 to 20 times (M
= 2.17; SD = 2.62).
Measure
The Rosenberg Self-esteem Scale (Rosenberg, 1989) consists of ten items scaled on a
four-point response structure (1 = strongly disagree to 4 = strongly agree). Scores can range from
10 to 40, with higher scores reflecting more positive evaluations of the self (Rosenberg
1965). Five items are positively worded and five items negatively worded, in an attempt to
inhibit response bias, that is, an individual’s tendency to agree with statements regardless of
their content.
Analysis
The dimensionality of the RSES was investigated through the use of conventional
confirmatory factor analytic (CFA) techniques, along with the utilization of a confirmatory
bifactor modelling approach (see Reise, et al., 2007). The following six models were
robust maximum likelihood (MLR) estimation: (a) Model 1, a 10-item unidimensional model;
(b) Model 2, 10 items and two correlated factors (positively and negatively orientated items);
(c) Model 3, 10 items and two independent factors (positively and negatively orientated
items); (d) Model 4, one global self-esteem factor and two correlated method factors that
includes the positive items on the one hand and the negative items on the other; (e) Model 5,
one global self-esteem factor and one method factor that includes the positive items; (f)
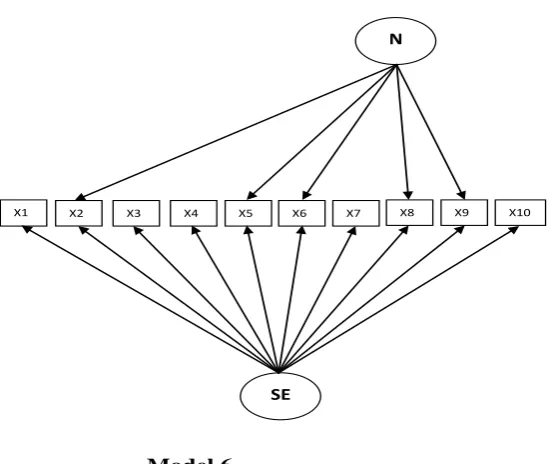
Model 6, one global self-esteem factor and one method factor that includes the negative items
(see figure 1)
Model 1
SE
X3
X1 X2 X4 X5 X6 X7 X8 X9 X10
Model 2
P
X3
X1 X2
N
Model 4 P
X3 X1 X2
N
X4 X5 X6 X7 X8 X9 X10
SE
Model 3
P
X3
X1 X2
N
X4 X5 X6 X7 X8 X9 X10
Model 5 P
X3
X1 X2 X4 X5 X6 X7 X8 X9 X10
Figure 1 Alternative Factor Models of Rosenberg Self-Esteem Scale
Note: P = Positive Self-Esteem; N = Negative Self-Esteem; SE = Global Self Esteem
The overall fit of each model and the relative fit between models were assessed using a range
of goodness-of-fit statistics and assessment of the appropriateness of the model parameters.
The chi-square (χ2) statistic assessed the sample and implied covariance matrix and a good
fitting model is indicated by a non-significant result. However the chi-square statistic is
strongly associated with sample size, and as such good models tend to be over-rejected.
Therefore, Tanaka (1987) suggested that a model should not be rejected simply on the basis
of a significant chi-square result. The Comparative Fit Index (CFI; Bentler, 1990) and the
Tucker Lewis Index (TLI; Tucker & Lewis, 1973) are measures of how much better the
model fits the data compared to a baseline model where all variables are uncorrelated. For
these indices values above .90 indicate reasonable fit while values above .95 indicated good
model fit (Bentler, 1990; Hu & Bentler, 1999). In addition, two more absolute indices are
Model 6
X3
X1 X2
N
X4 X5 X6 X7 X8 X9 X10
presented; the standardized root mean-square residual (SRMR: Joreskog & Sorborn, 1981)
and the root mean-square error of approximation (RMSEA: Steiger, 1990). Ideally these
indices should be less than .05 however values less than .08 also suggest adequate fit
(Bentler, 1990; Hu & Bentler, 1999). Furthermore, Akaike Information Criterion (AIC;
Akaike, 1974) was used to evaluate the alternative models, with the smaller value indicating
the best fitting model.
The specified models in this research allowed items to load only onto a single factor, with
uncorrelated measurement error terms as suggested in previous research (Boduszek et al.,
2012; Brown, 2006).
Results
Means and standard deviations for self-esteem, recidivism and total number of years served
in prison are presented in Table 1.
Table 1
Descriptive Statistics
Variable M SD
Self-Esteem total 34.98 4.83
Self-esteem positive 18.40 2.01
Self-esteem negative 16.58 3.54
Recidivism (number of times served in prison)
2.17 2.62
Total amount of time in prison (in years)
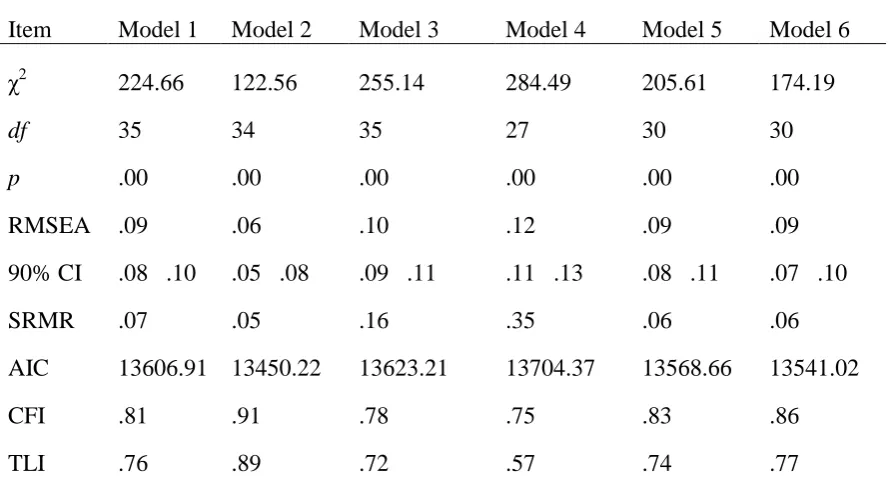
Table 2 reports both absolute and comparative fit indices for each model. As shown in Table
2, all indices show improvement in the two-factor model (Model 2). Although the chi-square
is large in relation to the degree of freedom, and statistically significant, Tanaka (1987)
suggests that the model should not be rejected on this basis, since large sample sizes amplify
the power of the test. Additionally, the CFI = .91, TLI = .89, RMSEA = .06 and RMSR = .05
indicate an adequate fit of data. The AIC also shows that the two-factor model is a more
[image:10.595.68.513.320.566.2]parsimonious model compared to the alternative models.
Table 2 Fit indices for the alternative CFA models of Rosenberg self-esteem scale.
Item Model 1 Model 2 Model 3 Model 4 Model 5 Model 6
χ2
224.66 122.56 255.14 284.49 205.61 174.19
df 35 34 35 27 30 30
p .00 .00 .00 .00 .00 .00
RMSEA .09 .06 .10 .12 .09 .09
90% CI .08 .10 .05 .08 .09 .11 .11 .13 .08 .11 .07 .10
SRMR .07 .05 .16 .35 .06 .06
AIC 13606.91 13450.22 13623.21 13704.37 13568.66 13541.02
CFI .81 .91 .78 .75 .83 .86
TLI .76 .89 .72 .57 .74 .77
Note. RMSEA = Root-Mean-Square Error of Approximation; CI = Confidence Interval; SRMR = Standardized
Root Mean Square Residual; AIC = Akaike Information Criterion; CFI = Comparative Fit Index; TLI = Tucker Lewis Index.
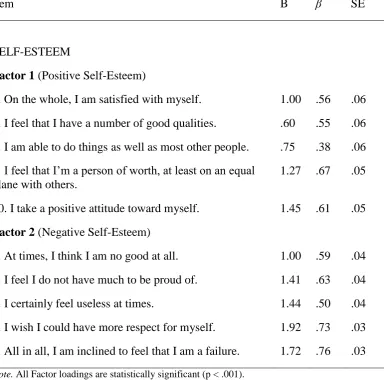
The adequacy of this model can also be determined in relation to its parameter estimates. As
can be seen in Table 3 all items displayed statistically significant (p < .001) factor loadings
displayed factor loadings above .4 with the exception of item 4 (β = .38). The correlation
[image:11.595.80.465.219.599.2]between the two factors was r = .56.
Table 3
Unstandardized and standardized factor loadings (and standard errors) for two-factor model of self-esteem.
Item B β SE
SELF-ESTEEM
Factor 1 (Positive Self-Esteem)
1. On the whole, I am satisfied with myself. 1.00 .56 .06
3. I feel that I have a number of good qualities. .60 .55 .06 4. I am able to do things as well as most other people. .75 .38 .06 7. I feel that I’m a person of worth, at least on an equal
plane with others.
1.27 .67 .05
10. I take a positive attitude toward myself. 1.45 .61 .05
Factor 2 (Negative Self-Esteem)
2. At times, I think I am no good at all. 1.00 .59 .04
5. I feel I do not have much to be proud of. 1.41 .63 .04
6. I certainly feel useless at times.
8. I wish I could have more respect for myself. 9. All in all, I am inclined to feel that I am a failure.
1.44 1.92 1.72 .50 .73 .76 .04 .03 .03
Note. All Factor loadings are statistically significant (p < .001).
Further analysis suggested that only positive self-esteem factor was statistically associated
with level of recidivism (β = .11; p < .05) while controlling for time spend in prison (β = .23;
p < .05).
As most researchers rely on internal consistency of items (Cronbach’s α; Cronbach, 1951),
by assessing the composite reliabilities. Composite reliability was calculated using the
formula
where
ρ
c= reliability of the factor score,λ
i = standardized factor loading, andθ
i =standard error variance. Values greater than .60 are generally considered acceptable (Bagozzi
& Yi, 1988; Diamantopoulos & Siguaw, 2000). The results show that all factor scores are
measured with very good reliability (positive self-esteem,
ρ
c = .96; negative self-esteem,ρ
c = .98; total self-esteem, ρc = .99 compared to Cronbach’s α = .79).Discussion
The aim of this study was to examine the factor structure of the RSES in a sample of
ex-prisoners. Six competing models were specified and tested in this research and items were
allowed to load only onto a single factor, with uncorrelated measurement error terms. On the
basis of the fit indices, the two-factor solution, comprising of correlated positive and negative
self-esteem latent variables, was considered to be an adequately fitting model, and to provide
a better fit to the data than the alternative solutions. This finding supports earlier research by
Boduszek et al.,(2012) which found that the RSES was a two-dimensional construct within a
sample of Polish recidivistic prisoners. The differential relationship between the positive and
negative self-esteem factors and recidivism provides additional support for the two-factor
self-esteem factors measure substantially different dimensions, they should differentially relate to
external variables. Although when Carmines and Zeller tested this in their sample, the two
self-esteem factors did not differentially relate to 16 external variables, in the present
research, only positive self-esteem was significantly related to recidivism. Consequently,
there is empirical support for the suggestion that the RSES may be best specified as assessing
two distinct, yet related constructs within offender samples. The positive and negative RSES
subscales also showed good reliability, as assessed using composite reliability – a more
appropriate method for assessing scale reliability than Cronbach’s alpha, given the nature of
the analytical approach (CFA) (Novick & Lewis, 1967; Raykow, 1998).
The results indicate that negative and positive self-esteem are not bi-polar constructs.
A low negative esteem score is not necessarily indicative of a high score on positive
self-esteem. This underscores the importance of considering both positive and negative aspects of
self-esteem when employing the RSES within the offender sample (Boduszek et al., 2012).
The results of the present study should be interpreted in light of several important
limitations, some of which point towards important directions for future research. First, the
sample of ex-prisoners was relatively homogenous, thereby limiting the generalizability of
the results to more diverse samples of varying ages, ethnicities, and offender groups.
Replication of these results with more heterogeneous samples is, therefore, needed. Second,
the use of self-report data also introduces several well-known limitations, such as response
bias.
In conclusion, the RSES was found to assess two distinct constructs (positive and
negative self-esteem) and not the one-dimensional construct of global self-esteem that was
originally conceptualized by Rosenberg (1965) and supported by some researchers by the
inclusion of correlated error variances. This suggests that researchers may need to re-evaluate
samples. The current results provide further empirical support to previous prison study
findings of the two-factor solution to the RSES, as a consequence of the incorporation of key
methodological strengths from earlier research by Boduszek et al.(2012) and the uniqueness
of the sample in which the factorial structure and reliability was tested.
References
Akaike, H. (1974). A new look at the statistical model identification. IEEE Transactions on
Automatic Control, 19, 716–723.
Bachman, J. G., & O’Malley, P. M. (1986). Self-concept, self-esteem, and educational
experiences: The frog pond revisited (again). Journal of Personality and Social
Psychology, 50,35–46.
Bagozzi, R.P., & Yi, Y. (1988). On the Evaluation of Structural Equation Models. Journal
of the Academy of Marketing Science, 16 (1), 74-94.
Baumeister, R. F., Smart, L., & Boden, J. M. (1996). Relation of threatened egotism to
violence and aggression: the dark side of high self-esteem. Psychological Review,
103, 5–33.
Bentler, P. M. (1990). Comparative fit indices in structural models. Psychological Bulletin,
107, 238–246.
Boduszek, D., Adamson, G., Shevlin, M., Mallett, J., & Hyland, P. (2013). Criminal Social
Identity of Recidivistic Prisoners: The Role of Self-Esteem, Family and Criminal
Boduszek, D., Shevlin, M., Mallett, J., Hyland, P. & O'Kane, D. (2012). Dimensionality and
Construct Validity of the Rosenberg Self-Esteem Scale within a Sample of
Recidivistic Prisoners. Journal of Criminal Psychology, 2(1), 19-25.
Brown, T. A. (2006). Confirmatory factor analysis for applied research. New York: The
Guilfоrd Press.
Carmines, E. G., & Zeller, R. A. (1979). Reliability and validity assessment. Beverly Hills,
CA: Sage.
Cronbach, L. J. (1951). Coefficient alpha and the internal structure of tests. Psychometrika,
16, 297-334.
Diamantopoulos, A., & Siguaw, J.A. (2000). Introducing LISREL. London: Sage
Publications.
Diener, E., & Diener, M. (1995). Cross-cultural correlates of life satisfaction and self-esteem.
Journal of Personality and Social Psychology, 68, 653–663.
Dobson, C., Goudy, W. J., Keith, P. M., & Powers, E. (1979). Further analysis of
Rosenberg’s self-esteem scale. Psychological Reports, 44, 639–641.
Dunbar, M., Ford, G., Hunt, K., & Der, G. (2000). Question wording effects in the
assessment of global self-esteem. European Journal of PsychologicalAssessment,
16, 13–19.
Hu, L., & Bentler, P. M. (1999). Cutoff criteria for fit indexes in covariance structure
analysis: Conventional criteria versus new alternatives. StructuralEquation
Huang, C., & Dong, N. (2012). Factor structures of the Rosenberg Self-Esteem Scale: A
meta- analysis of pattern matrices. European Journal of Psychological Assessment,
28, 132-138.
Jackson, J. S., Torres, M., Caldwell, C. H., Neighbors, H. W., Nesse, R. M., Taylor, R. J.,
Trierweiler, S. J., & Williams, D. R. (2004). The National Survey of American Life: a
study of racial, ethnic and cultural influences on mental disorders and mental health.
International Journal of Methods in Psychiatric Research, 13(4), 196-207.
Joreskog, K., & Sorbom, D. (1981). LISREL V: Analysis of linear structural relationships by
the method of maximum likelihood. Chicago:National Educational Resources.
Kaufman, P., Rasinski, K.A., Lee, R., & West, J. (1991). National Education Longitudinal
Study of 1988. Quality of the responses of eighth-grade students in NELS88.
Washington, DC: U.S. Departmentof Education.
Kernis, M. H., Grannemann, B. D., & Barclay, L. C. (1989). Stability and level of self-esteem
as predictors of anger arousal and hostility. Journal of Personality and Social
Psychology 56, 1013–1022.
Lewis, S. F., Travea, L., & Fremouw, W. J. (2002). Characteristics of female perpetrators and
victims of dating violence. Violence and Victims, 17, 593–606.
Markus, H.R., & Kitayama, S. (1991). Culture and the self: Implications for cognition,
emotion, and motivation. Psychological Review, 98, 224–253.
Marsh, H. M. (1996). Positive and negative global self-esteem: A substantial meaningful
distinction or artifactors? Journal of Personality and Social Psychology, 70, 810–
Muthen, L. K., & Muthen, B. O. (1998 - 2010). Mplus – Statistical analysis with latent
variables. User’s guide (6th Ed). Muthen and Muthen: Los Angeles.
Novick, M., & Lewis, G. (1967). Coefficient alpha and the reliability of composite
measurements. Psychometrika, 32, 1-13.
Raykov, T. (1998). Coefficient Alpha and Composite Reliability with Interrelated
Nonhomogeneous Items. Applied Psychological Measurement, 22(4), 375-385.
Reise, S. P., Morizot, J., & Hays, R. D. (2007). The role of the bifactor model in resolving
dimensionality issues in health outcomes measures. Quality of Life Research, 16,
19-31.
Rosenberg, M. (1965). Society and the adolescent self-image. Princeton, NJ: Princeton
University Press.
Rosenberg, M. (1989). Society and the adolescent self-image. (Rev. Ed.). Middeltown, CT:
Wesleyan University Press.
Sharpe, D., & Taylor, J. K. (1999). An examination of variables from a social-developmental
model to explain physical and psychological dating violence. Canadian Journal of
Behavioural Sciences, 31, 165–175.
Shevlin, M., Bunting, B. P., & Lewis, C. A. (1995). Confirmatory Factor Analysis of the
Rosenberg Self-Esteem Scale. Psychological Reports, 76, 707-710.
Shine, J., McCloskey, H., & Newton, M. (2002). Self-esteem and sex offending. Journal of
Sexual Aggression, 8, 51-61.
Steiger, J. H. (1990). Structural model evaluation and modification: An interval estimation
Sutherland, I., & Shepherd, J. P. (2002). A personality-based model of adolescent violence.
British Journal of Criminology, 42, 433–441.
Tanaka, J. S. (1987). How big is big enough? Sample size and goodness of fit in structural
equation models with latent variables. Child Development, 58, 134–146.
Tomás, J. M., & Oliver, A. (1999). Rosenberg’s self-esteem scale: Two factors or method
effects. Structural Equation Modeling, 6, 84–98.
Tucker, L. R., & Lewis, C. (1973). The reliability coefficient for maximum likelihood factor