Bazargani, N. and Hillebrandt, H. and Christoff, K. and Dumontheil, Iroise
(2014) Developmental changes in effective connectivity associated with
relational reasoning. Human Brain Mapping 35 (7), pp. 3262-3276. ISSN
1065-9471.
Downloaded from:
Usage Guidelines:
Please refer to usage guidelines at or alternatively
1
Developmental changes in effective connectivity associated with relational reasoning
Narges Bazargani1, Hauke Hillebrandt1, Kalina Christoff2, Iroise Dumontheil1,3
1. Institute of Cognitive Neuroscience, University College London, London WC1N 3AR, United Kingdom
2. Department of Psychology, University of British Columbia, Vancouver V6T 1Z4, Canada
3. Department of Psychological Sciences, Birkbeck, University of London, London WC1E 7HX, United Kingdom
Corresponding author
Dr. Iroise Dumontheil
Department of Psychological Sciences Birkbeck, University of London
Malet Street, London WC1E 7HX, United Kingdom Tel: 0044 20 3073 8008
Email: [email protected]
Running title: DCM of relational reasoning development
2 Abstract
Rostrolateral prefrontal cortex (RLPFC) is part of a frontoparietal network of regions involved in relational reasoning, the mental process of working with relationships between multiple mental representations. RLPFC has shown functional and structural changes with age, with increasing specificity of left RLPFC activation for relational integration during development. Here, we used dynamic causal modelling (DCM) to investigate changes in effective connectivity during a relational reasoning task through the transition from adolescence into adulthood. We examined fMRI data of 37 healthy female participants (11-30 years old) performing a relational reasoning paradigm. Comparing relational integration to the manipulation of single relations revealed activation in five regions: the RLPFC, anterior insula, dorsolateral PFC, inferior parietal lobe, and medial superior frontal gyrus. We used a new exhaustive search approach and identified a full DCM model, which included all reciprocal connections between the five clusters in the left hemisphere, as the optimal model. In line with previous resting state fMRI results, we showed distinct developmental effects on the strength of long-range frontoparietal vs. frontoinsular short-range fixed connections. The modulatory connections associated with relational integration increased with age. Gray matter volume in left RLPFC, which decreased with age, partly accounted for changes in fixed PFC connectivity. Finally, improvements in relational integration performance were associated with greater modulatory and weaker fixed PFC connectivity. This pattern provides further evidence of increasing specificity of left PFC function for relational integration compared to the manipulation of single relations, and demonstrates an association between effective connectivity and performance changes during
3 Introduction
Adolescence is a period of mental change both in the social cognition (Burnett et al., 2011) and the cognitive control and reasoning domains (Luna et al., 2010; Ferrer et al., 2009). Relational reasoning is the mental process of working on the relationships between multiple mental representations. It is a critical component of fluid reasoning, the capacity to think logically and solve problems in novel situations (Ferrer et al., 2009). Relational reasoning is supported by a network of frontoparietal regions
including the rostrolateral prefrontal cortex (RLPFC) (Bunge et al., 2009; Christoff et al., 2001; Kroger et al., 2002; Wendelken et al., 2008), a brain region which changes
structurally and functionally during late childhood and adolescence (Crone et al., 2009; Dumontheil et al., 2008, 2010; Wendelken et al., 2011).
There is evidence that functional selectivity of the left RLPFC for relational integration develops during adolescence (Crone et al., 2009; Dumontheil et al., 2010; Wendelken et al., 2011), and that task performance and structural changes can partly explain changes in left RLPFC activity from adolescence to adulthood (Dumontheil et al., 2010).Here, we investigated whether connectivity changes between RLPFC and other regions
co-activated during relational processing may drive changes in RLPFC activity and task performance during development (Crone and Dahl, 2012).
4
functionally related regions, even when those regions do not possess direct anatomical connections (Vogel et al., 2010). Recent developmental rs-fcMRI research has shown that long-range connections (e.g. frontoparietal) are strengthened, while short-range connections (e.g. within the frontal cortex) are weakened during childhood and
adolescence (e.g. Dosenbach et al., 2010; Fair et al., 2007, 2008; Supekar et al., 2009; see Uddin et al., 2010 and Vogel et al., 2010 for review).
These changes have been proposed to reflect a progressive integration and segregation of functions across brain regions, leading to the maturation of cognitive abilities (Fair et al., 2007; Rubia, 2012). Developmental segregation of regions in local networks may be partly related to synaptic pruning (Petanjek et al., 2011), which is thought to result in decreased gray matter volumes as observed with structural MRI scans (Paus et al., 2008). In contrast, the integration of anatomically disparate regions may be assisted by the myelination of long distance cortical axon tracts that occurs during development and can be observed using structural MRI or diffusion tensor imaging (DTI) (Uddin et al., 2011). However, this mapping between large-scale structural changes and functional connectivity changes is not a perfect relationship (e.g. Supekar et al., 2010) and other theories suggest that increased rs-fcMRI connectivity reflects an increased history of co-activation (see Vogel et al., 2010 for discussion).
5
different origins or function, such as circuit formation in children vs. varying attentional states in adults (see Colonnese and Khazipov, 2012). Rs-fcMRI data is also sensitive to participants’ motion, which could be a confound when studying development (Power et al., 2012). Moreover, inferences made based on group differences may be confounded to the extent to which the slow fluctuations of resting state activity is explained by
cardiovascular and respiratory processes, in particular, if those inferences concern factors such as age that have been shown to affect neurovascular coupling (Colonnese and Khazipov, 2012; Kelly et al., 2012).
Other groups have investigated functional connectivity changes between brain regions that co-activate during cognitive tasks. Their results reveal distinct patterns of
functional connectivity depending on the task used. For instance, while some studies associated maturation of cognitive control abilities to increases in functional
connectivity within frontal or frontoparietal networks and also between frontoparietal and fronto-subcortical networks during the transitions from early to mid-adolescence and from adolescence to adulthood (Barbalat et al., 2012; Christakou et al., 2011; Neufang et al., 2008; Stevens et al., 2007), others reported a decrease in frontoparietal connectivity that may underlie the maturation of social emotions (Burnett and
6
Very few studies have used effective connectivity measures to study cognitive
development. Hwang et al. (2010) used Granger Causality Analysis (GCA) to show that changes in connectivity strength were associated with changes in functional activation with age during an inhibitory control task. GCA models temporal dependencies in the data without referencing the experimental input (Friston, 2009), it is therefore an effective connectivity method that largely does not require the specification of a model including structural parameters. Dynamic Causal Modelling (DCM), which employs an explicit forward, or generative, model to explain the observed data from the
experimental manipulations, may be more appropriate to study effective connectivity (Friston and Penny, 2011; Friston, 2003, 2009; Smith, 2012). DCM models the hidden neuronal and biophysical states that generate the observed data, thus inferring the unobserved neuronal activity from the fMRI BOLD signal (Friston 2009). Two previous developmental studies used DCM: one found developmental changes in effective connectivity using a response inhibition task during transition from adolescence into adulthood (Stevens et al., 2007); the other demonstrated an age-dependent modulation of connectivity in the network of regions sensitive to faces between late childhood and adulthood (Cohen Kadosh et al.,2011).
7
contrasted frontoparietal and frontoinsular connectivity, in line with the long- vs. short-range distinction observed in previous rs-fcMRI research (Dosenbach et al., 2010; Fair et al., 2008), but also contrasting forward and backward connections (e.g. Friston 2002, 2005, 2012; Fuster, 2002, 2009; Miller and Cohen 2001; Salin and Bullier 1995) (2) whether developmental changes in connectivity strength may be linked to structural changes, and finally (3) whether developmental changes seen in behavior could be accounted for by connectivity strength, in particular whether prefrontal cortex (PFC) connections showed increasing specificity for relational integration (Crone et al., 2009; Dumontheil et al., 2010; Wendelken et al., 2011). Relational integration has been shown to be more specifically supported by the left RLPFC (Bunge et al., 2009), and
developmental changes in this dataset were observed in the left PFC (Dumontheil et al., 2010). As the mechanisms underlying interhemispheric integration remain poorly understood (Stephan et al., 2007), the DCM analyses presented here were therefore limited to activations in the left hemisphere.
Materials and Methods
Participants
Thirty-seven right-handed female participants, aged between 11 to 30 years old, took part in this study (Dumontheil et al.,2010). Participants had no history of psychiatric or neurological disorders and all provided informed consent (or their legal guardian if younger than 18). This study was approved by the UCL National Hospital for Neurology and Neurosurgery Ethics Committee.
8
1.0), adults (N=13, 22.5-30.4 years, 25.5 ± 2.8). General cognitive ability of the
participants was assessed using the WASI (Wechsler, 1999), and did not differ between age groups (F(2, 34) = 0.51, P = 0.60), nor varied as a function of age (r = 0.028, P = 0.87).
Behavioral paradigm
Participants performed a relational reasoning task, which reliably activates RLPFC (Christoff et al., 2003; Smith et al., 2007). The task has two conditions during which two pairs of black and white items are presented on the screen (Figure 1). In the Relational condition, participants were instructed to identify whether two pairs of items, which could vary in shape and/or texture, differed or changed along the same dimension. If both pairs showed texture differences, or both pairs showed shape difference,
participants were asked to respond ‘’yes’’ (match trial). Alternatively, if one pair of items differed in texture while the other pair differed in shape, the participants were asked to respond ‘’no’’ (no-match trial). In the Control condition, the second pair was always identical in shape or texture, and the participants had to identify whether one of two items in the first pair had the same shape (or texture) as the bottom pair (Figure 1). Relational trials require participants to integrate information from two relations, while the Control condition requires participants to identify single relations.
9
counterbalanced within and between participants (see Dumontheil et al., 2010 for more details).
MRI data acquisition
A 1.5 Tesla Siemens Avanto MRI scanner was used to acquire both 3D T1-weighted fast-field echo structural images and multi-slice T2*-weighted echo-planar volumes with BOLD contrast (TR = 3 s; TE = 50 ms; TA = 2.9143 s), and 140 volumes comprising 35 axial slices with a resolution of 3 x 3 x 3 mm covering the whole brain were acquired in two 7 min functional scanning sessions.
Voxel-based morphometry
Gray matter volumes were extracted using voxel-based morphometry (VBM)
(Ashburner and Friston, 2000) from the five ROIs on all participants using SPM5 VBM5 toolbox (v1.15 http://dbm.neuro.uni-jena.de/vbm). Each participant’s structural T1 image was normalized to the standard T1 Montreal Neurological Institute (MNI) template. Structural scans were segmented into cerebrospinal fluid, gray and white matter; modulation for non-linear warping only was performed using the Jacobian determinants. This method approximates a proportional adjustment of volumes for overall head size (O’Brien et al., 2006). Images were resampled into 1.5 x 1.5 x 1.5 mm voxels and smoothed with an isotropic 12 mm, full-width, half-maximum Gaussian kernel. The MarsBaR toolbox for SPM5 was used to calculate mean gray matter adjusted volumes for each ROI.
10
FMRI data were analysed using SPM8 (http://www.fil.ion.ucl.ac.uk/spm). In the preprocessing step, the volumes were realigned and corrected for differences in slice acquisition times. Then the structural image was coregistered to the mean realigned functional image, and was subsequently segmented and spatially normalized (embedded in the segmentation step) to the gray and white matter templates based on the MNI reference brain. Finally, the data was spatially smoothed with an isotropic 8 mm, full-width, half-maximum Gaussian kernel. For all participants, head movement was less than 3 mm within each scanning session.
Mean translations and rotations from the estimates obtained from the realignment processing step were calculated for each participants. Statistical tests performed on the 33 participants included in the DCM analyses indicated there was no difference in mean movement between the age groups (Fs(2,30) > 2.6, Ps > .74). There was also no
correlation between movement and age as a continuous measure (translation: Pearson r
= -0.162, P = 0.37; rotation: r = -0.028, P = 0.88).
11
was excluded from analysis. The data were high-pass filtered to a cut-off of 1/128 Hz. Fixation blocks were modeled implicitly.
This first level GLM was used to compute the least-squares parameter estimates of the
height of the best-fitting response function of the model regressors at each voxel.
Parameter estimates were combined to produce a Relational > Control contrast image
for each participant. These contrast images were entered in a second level of analysis to
perform a group-level one-sample t-test. The resulting activation map was used to
define the regions-of-interest for the effective connectivity analysis. All the analyses in the current study were done on the left hemisphere clusters due to stronger
developmental functional changes in this hemisphere (Dumontheil et al., 2010; Wendelken et al., 2011).
Dynamic Causal Modelling
DCM is a Bayesian framework for modelling and inferring the directed connectivity among hidden (unobserved) neuronal states from measurements of brain activity, in this case BOLD activity. It can be used to analyze task or set-dependent effective
connectivity i.e. changes in coupling strength, providing information about the changes in directed influence of one area over another in certain psychological contexts. The constructed models are elaborated based on a model that quantifies how synaptic activity translates into hemodynamic responses; coupling parameters are then
12
the observed data, the likelihood that the model accurately represents the true neural dynamics is then estimated within a Bayesian framework (Friston, 2009).
Three types of coupling parameters are estimated in DCM. The first parameters (DCM.A) estimate fixed connections between brain regions (also referred to as endogeneous, direct, intrinsic, or average connectivity; see Friston et al., 2003), i.e. the effect that one brain region has upon another, in a baseline condition. The second parameter (DCM.B) estimates the modulation of the fixed connections between brain regions as a result of a particular task condition, i.e. the impact of the task on the connectivity between brain regions, rather than the effect that the task has on specific brain regions. Finally, the third parameter (DCM.C) indexes the driving input to the model. The extrinsic driving input usually consist of a sensory contrast that sets the system in motion, as opposed to the modulatory contrast, which are of more attentional nature and affect the coupling between brain regions (Stephan et al., 2010).
Definition of the regions of interest (ROIs)
ROIs were defined from the 2nd-level Relational > Control contrast across all
13
regions with smaller extant to permit the coverage of the region of interest, e.g. the RLPFC, across participants (e.g. see Smith et al., 2007 for individual variability in
localization of RLPFC activations). In addition,ensuring the clusters were of similar size enabled us to approximate the approach used in other studies of building ROIs from spheres of a fixed diameter (e.g. Bitan et al., 2009) and ensured some consistency in terms of the numbers of data points informing the extracted timecourse data in each ROI. The MarsBaR toolbox (http://marsbar.sourceforge.net) was used to split the lateral frontal activation cluster into RLPFC and DLPFC regions, using a cut-off of y = 40 mm
(Wendelken et al., 2011).
These five functionally defined ROIs were then used to extract the time series for each
participant. This approach of using clusters which are functionally defined and
anatomically constrained to identify individual participant’s volumes of interest (VOIs)
was favored to using spheres of arbitrary size around activation peaks (Stephan et al.,
2010).
Extraction of VOI time series
We extracted VOIs in each participant by obtaining the principle eigenvariate of the
group of voxels showing greater activation in Relational vs. Control within each of the
five ROIs in the left hemisphere (see previous section on the use of anatomical templates to define ROIs). A threshold of P < 0.05 uncorrected for multiple comparisons was used for the extraction (Hyde et al., 2006). This procedure was done on concatenated data from the two sessions and the time series were adjusted for the effects of interest (i.e. variance explained by the regressors of interest, namely the Relational and Control
14
activation we were unable to extract VOIs for four participants from the Relational > Control contrast. Therefore, all the subsequent DCM analyses were conducted on the 33 remaining participants (young adolescents N=10, mid adolescents N=13, adults N=10).
DCM specification
To model our experimental input (Relational and Control conditions) and the effect of
modulator (Relational condition), a new GLM was generated for each subject. This
model only differed from the previously described GLM model in that Relational and
Control conditions were modeled using a regressor to combine both conditions (this
represented the presence of a visual input), and a second regressor to model Relational
blocks only (modulatory effect of relational integration).
15
area on another to be excitatory only (i.e. glutamatergic), making the model more realistic (Marreiros et al., 2008)), bilinear (i.e. an input-dependent change in
connectivity was modeled as a second-order interaction between the input and activity in a source region)(Stephan and Friston, 2010), and included mean-centered inputs (see release notes for SPM8 (r4010):
http://www.fil.ion.ucl.ac.uk/spm/software/spm8/SPM8_Release_Notes_r4010.pdf). In order to improve the fit of the DCM model, the second session was removed for three of the participants for whom the original DCM full model failed to explain any of the variance. The fit improved for two of the participants.
Post-hoc Bayesian model selection
16
strengths. Critically, post-hoc routines and the conventional variational free energy approach have been shown to yield very similar results (Rosa et al., 2012).
Analysis of parameters in the optimal model
Parameter estimates of the optimal model were investigated for age effects and association with brain structure and performance. To reduce the number of tests
performed, the 20 connections were grouped using two approaches. First, we organized the connections according to a well-established anatomical and functional asymmetry between forward and backward connections (e.g. Friston 2002, 2005, 2012; Fox and Friston, 2012). This forward vs. backward distinction is based on a hierarchical organization of brain function and structure that has accumulated considerable evidence, particularly in the context of executive prefrontal function (Badre, 2008; Badre and D’Esposito, 2007, 2009; Fuster, 2002, 2009; Koechlin and Summerfield, 2007; Miller and Cohen, 2001), predictive coding (Friston, 2002, 2005, 2012; Friston and Kiebel, 2009; Kilner et al., 2007) but also basic visual perception (Salin and Bullier, 1995). Second, on the basis of rs-fMRI data (Dosenbach et al., 2010; Fair et al., 2008; Rubia et al., 2012), we grouped the connections according to their length, contrasting frontoparietal long-range connections (to and from the IPL) and frontoinsular short-range connections (within the frontal cortex and between the frontal cortex and the insula).
17
multiple regressions were further used to investigate potential associations between effective connectivity measures, age, and brain structure measures.
Results
Behavioral results
Analyses were conducted on the 33 participants included in the DCM analyses (young adolescents N= 10, mid adolescents N=13, adults N=10), a slightly smaller total sample than described in Dumontheil et al. (2010). Results from a 2 (Condition: Relational, Control) x 3 (Age group: young adolescence, mid adolescence, and adulthood) mixed repeated measures ANOVA performed on accuracy revealed a main effect of Condition (F(1,30) = 26.62, P < 0.001) with lower accuracy in Relational (88.8% ± 8.5) compared to Control (96.4% ± 3.2) trials. The main effect of Age group and the Condition x Age group interaction were not significant (Ps > 0.2). However, using age as a continuous variable reveals a marginal decrease with age of the difference in accuracy between Relational and Control trials (F(1,31) = 3.42, P = 0.07, β = -0.315).
Analysis of reaction times (RT) showed a main effect of Condition (F(1,30) = 211.14, P < 0.001), with slower RT in Relational (2018 ms ± 393) compared to Control trials (1234 ms ± 200). There was no main effect of Age group (P = 0.33), but the Condition x Age group interaction was significant (F(2,30) = 3.46, P = 0.045) and predominantly
18
Thus although performance was high overall, there was some evidence of an improvement in accuracy and RT in Relational vs. Control trials with age.
Main effect on the Relational > Control contrast
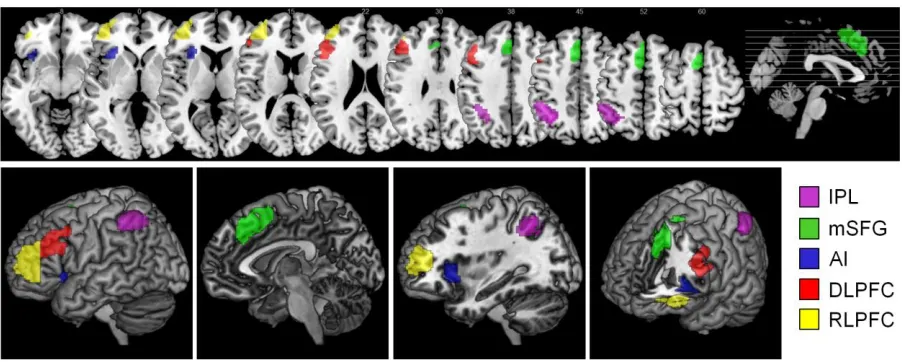
The main effect of the experimental condition (Relational > Control) revealed
bilateral activations in the RLPFC, AI, DLPFC, IPL, mSFG and occipital regions across all participants (Figure 2, Table 1) (Dumontheil et al., 2010).
DCM analyses were performed on activations from five regions in the left hemisphere (RLPFC, DLPFC, mSFG, AI, and IPL).
Post-hoc selection of DCM
19
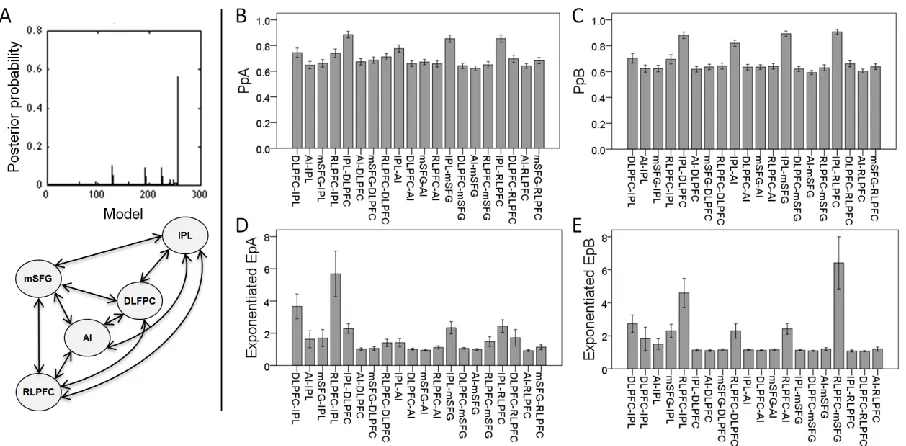
Connections probabilities for all individual fixed and modulatory connections were above chance (> 50%) (Figure 3B, 3C). Note that all the parameter estimates were scale parameters that were exponentiated prior to plotting to ensure positivity as per
convention for two state DCMs (Marreiros et al., 2008) (Figure3D, 3E), while all the statistical analyses were conducted on non-exponentiated data.
To summarise, the DCM analyses indicated that the full model had the highest evidence. Therefore, the statistical analyses below were conducted on parameter estimates from the full model estimated in each participant, to look at quantitative differences in fixed or modulatory connection strength.
Developmental changes in connection strength
To limit the number of statistical tests performed, we grouped the full DCM model parameter estimates of the 20 connections in two ways. We first organized the connections according to a well-established anatomical and functional asymmetry between forward and backward connections. Mixed repeated measures ANOVA
including Age group as a between-subject factor and Connection direction (forward vs. backward) as a within-subject factor showed no evidence of an interaction between Connection direction and Age group for fixed (EpA) (F(2,30) = 0.72, P > 0.4), or
modulatory (EpB) parameter estimates (F(2,30) = 0.38, P > 0.6). This grouping was thus not pursued further.
20
lobe). Mixed repeated measures ANOVA including Age group as a between-subject factor and Connection length (frontoparietal vs. frontoinsular) as a within-subject factor were performed on the fixed (EpA) and modulatory (EpB) parameter estimates.
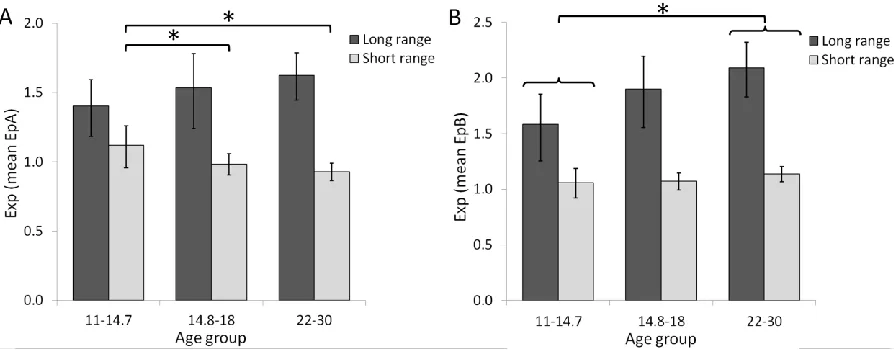
Analysis of the fixed connections showed a main effect of Connection length (F(1,30) = 68.91, P < 0.001), with stronger frontoparietal than frontoinsular connections, no main effect of age group (P > 0.9) but a significant interaction between Connection length and Age group (F(2,30) = 3.59, P = 0.04) (Figure 4A). Follow-up tests showed a main effect of Age group on the frontoinsular connections (F(2,30) = 4.54, P = 0.019) with greater connectivity strength in young adolescents than mid adolescents (P = 0.039), and adults (P = 0.006). There was no effect of Age group on frontoparietal connections (F(2,30) = 1.05, P > 0.3). Note that using Age as a continuous measure in the repeated measures ANOVA revealed a marginally significant interaction between Connection length and Age (F(1,31) = 3.96, P = 0.055).
Analysis of the modulatory connections also showed a main effect of Connection length (F(1,30) = 130.84, P < 0.001), and a main effect of Age group (F(2,30) = 3.64, P = 0.038), with greater connectivity strength in adults than young adolescents (P = 0.012) (Figure 4B). The other paired comparisons were not significant (Ps > 0.1). Moreover, there was no interaction between Connection length and Age group (F(2,30) = 1.85, P > 0.17).
21
frontoparietal modulatory connection strength (Pearson r = -0.313, P = 0.076). No other associations were observed (all Ps > 0.22). Although mean translation did not vary significantly with age (see methods section), we tested whether the association observed here may account for the increase in frontoparietal modulatory connection strength with age. A second mixed repeated measures ANOVA was performed, including mean translation as a covariate. The results showed that the main effect of age group became marginal (F(2,29) = 3.20, P = 0.055), however the difference between young adolescents and adults remained significant (P = 0.017).
To summarize, analysis of the parameter estimates from the full model showed that there was no difference in development of forward vs. backward connections. However, there were differential developmental changes of long vs. short-range fixed connections, with a decrease in frontoinsular short-range fixed connections strength with age and stable frontoparietal long-range fixed connections strength. Modulatory connections showed an increase in strength with age overall, with no distinction between
frontoinsular and frontoparietal connections.
Analysis of structural data
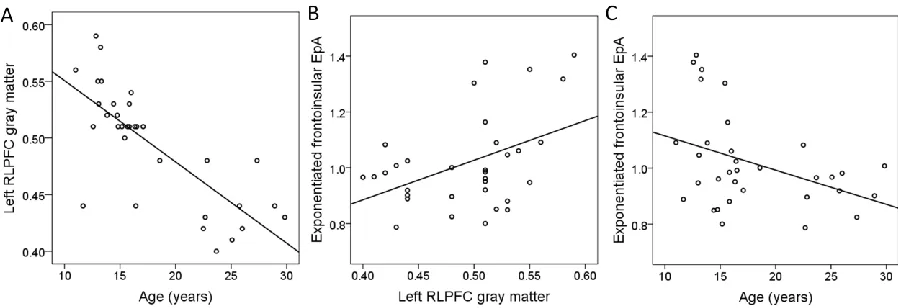
Gray matter volumes in all five ROIs decreased with age (β range -0.78 to -0.50, all Ps < 0.001, see Figure 5A for an example). A multiple regression analysis was conducted to investigate whether gray matter volumes, extracted from our five ROIs, could predict frontoinsular short-range fixed connectivity strength, which was found to decrease with age (previous section). All five gray matter volume measures were entered
22
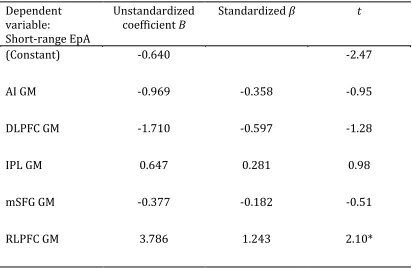
connections strength (β =1.24, P = 0.045, see Table 2) independently of gray matter volumes in the other ROIs.
To test for a possible mediation of the developmental change in short-range fixed
connectivity by left RLPFC structure (using the approach proposed by Baron and Kenny, 1986), we included age and left RLPFC gray matter volume in a multiple regression, with frontoinsular fixed connectivity as the dependent variable. This model was compared to the earlier regressions showing that age and RLPFC gray matter volume, when entered separately, both significantly predicted frontoinsular fixed connectivity, and that age predicts RLPFC gray matter volume. Although the multiple regression model including both age and RLPFC gray matter structure together significantly accounted for variance in frontoinsular fixed connectivity (R2 = 0.19, F(2,30) = 3.41, P = 0.046), neither
regressor was significant (Ps > 0.27). These results provide therefore no evidence that left RLPFC structure may have mediated the effect of age on frontoinsular fixed
connectivity.
Further analysis indicated that left RLPFC gray matter volume also positively predicted Relational vs. Control accuracy (R2 = 0.12, β = 0.35, P = 0.046).
To summarize (see Figure 5B and 5C), age and gray matter volume in the left RLPFC both predicted fixed frontoinsular short-range connection strength, but neither age or RLPFC provided additional predictive power, given the other. Gray matter volume in the left RLPFC further predicted Relational vs. Control accuracy.
23
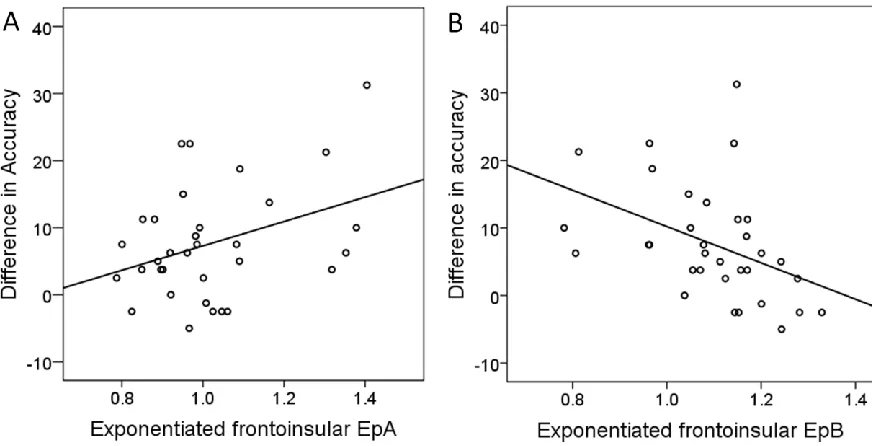
Regression analyses were performed on the four types of connections (fixed and modulatory, short and long-range) to test whether connectivity strength could predict the difference in accuracy between Relational and Control trials, which was found to decrease with age. The results indicate that Relational vs. Control accuracy was significantly predicted by the strength of fixed and modulatory frontoinsular short-range connections (R2 = 0.12, β = 0.35, P = 0.047 andR2 = 0.16, β = -0.40, P = 0.019, respectively). Weaker fixed connections and stronger modulatory connections predicted a smaller difference between Relational and Control accuracy, i.e. a relatively better performance in Relational trials (Figure 6A and 6B).No association between long-range connectivity and accuracy was observed.
The difference in accuracy between Relational and Control trials showed a trend decrease with age. We therefore performed further regressions including age as a second regressor to test whether the prediction of performance by frontoinsular
connection strength may be independent of the effect of age on performance. A multiple regression model including fixed frontoinsular connection strength and age as
regressors did not significantly account for Relational vs. Control accuracy (R2 = 0.16, P = 0.07); neither regressor was significant (fixed connectivity β = 0.27, P = 0.15; age β = -0.21, P = .25). However, a model including modulatory frontoinsular connection
strength and age significantly predicted 11.3% more variance in accuracy (R2 = 0.21, P = 0.03; modulatory connectivity β = -0.35, P = 0.046, age β = -0.23, P = .18) than a model including age alone as a single regressor.
24
greater modulatory frontoinsular connections also showed weaker fixed frontoinsular connections. Indeed, a correlation analysis showed revealed a significant negative correlation between the strength of fixed and modulatory frontoinsular short-range connections (Pearson Correlation r = -0.41, P = 0.018). This association remained significant when age was covaried in a partial correlation (r = -0.35, P =0.049).
Similar regression analyses were performed for reaction times. None of the four types of connections predicted the difference in RT between Relational and Control trials (all Ps > 0.3). Note that the results were similar when accuracy and RT in Relational trials, rather than the difference in accuracy and RT between Relational and Control trials, were entered in the analyses.
To summarize (see Figure 6A and 6B), fixed and modulatory frontoinsular short-range connections showed opposite patterns of development and association with accuracy in Relational vs. Control trials. On one hand, fixed frontoinsular connectivity decreased with age and was negatively correlated with performance overall, but not when age was covaried. On the other hand, modulatory frontoinsular connectivity did not change with age and was positively correlated with performance, independently of age.
Discussion
(11-25
14.7 y., 14.8-18.5 y., and 22.5-30 y.) and condition x age group effects in left RLPFC, left AI and mSFG. Our aim was to focus on the left hemisphere and see whether there were age-dependent changes in the strength of connections, when grouped into long- vs. short-range (i.e. frontoparietal vs. frontoinsular) and forward and backward
connections in line with previous research (e.g. Fair et al., 2008; Friston, 2002, 2005, 2012; Fuster, 2002, 2009). Secondly, we examined whether developmental changes in the strength of connectivity may be linked to structural changes with age. Finally, we tested whether behavioral changes seen in our relational reasoning task could be predicted by connectivity strength, in particular, whether PFC connections showed increasing developmental specificity for relational integration (Crone et al., 2009; Dumontheil et al., 2010; Wendelken et al., 2011).
26
relational reasoning network (reciprocal connections between RLPFC, DLPFC, AI, mSFG, and IPL, Figure 3), during young adolescence, mid adolescence, and adulthood.
Next, to examine whether there were age-dependent changes in the strength of fixed and modulatory connections, we grouped the connections according to their direction (i.e. forward vs. backward connections) or their length (long- vs. short-range), factors that have been distinguished in prior research (e.g. Fair et al., 2008; Friston, 2002, 2005, 2012). We did not find differential age effects on the connection strengths when the grouping was done according to direction. Thus this grouping was not pursued further. In contrast, our results revealed a significant interaction between age group and
connection length on the strength of fixed connections across the three age groups. This age-related difference was driven by a significant decrease in the strength of fixed frontoinsular (short-range) connections, strongest between young (age 11-14) and mid adolescence (age 14-17), while the fixed frontoparietal (long-range) connections
remained stable across the age groups (Figure 4A). Modulatory connections showed an increase in strength with age overall between young adolescence and adulthood, with no distinction between frontoinsular and frontoparietal connections, although the increase in connectivity with age was qualitatively more pronounced for frontoparietal long-range connections (Figure 4B).
27
was limited to the fixed connectivity, while the increased long-range connectivity was more pronounced in the modulatory connectivity measures. Rs-fMRI studies, which are limited by the unconstrained nature of the task and the sensitivity to group differences in movement, do not make a distinction between fixed and modulatory connectivity strengths. Our results suggest that more complex models using task-based designs, such as DCMs, are necessary to study connectivity changes during development in more details. Further work using both rs-fMRI and DCMs will be needed to better understand the relationship between these two types of connectivity measurement.
Indeed, the current study further showed an association between frontoinsular short-range effective connectivity and relational integration accuracy (as contrasted to accuracy during the manipulation of single relations). Fixed and modulatory
frontoinsular connectivity strengths showed an opposite relationship with accuracy (Figure 6A and 6B) such that greater relational integration accuracy was associated with weaker fixed and stronger modulatory frontoinsular connectivity. Only the latter association remained significant when age was included in the model. Indeed,
28
Note that RT decreased during adolescence only rather than over the whole age range, and no correlation between RT and connectivity measures were observed. It is possible that such associations may be observed during adolescence specifically, when RT shows improvements. However, the sample size in the current study was considered too small to repeat the correlation analyses within the adolescent group only.
This pattern of developmental changes in the control condition (here corresponding to the fixed connectivity) but not in the relational condition is similar to that observed in terms of BOLD activation by Wendelken et al. (2011). In a very similar experimental paradigm, left RLPFC activation in the control condition decreased with age, while activation in the relational integration condition remained stable with age. Therefore, the results of our effective connectivity lend further support for an increasing
specialization of frontal cortex function for relational integration during development, in line with previous fMRI data (Crone et al., 2009; Dumontheil et al., 2010; Wendelken et al., 2011).
29
Changes in the strength of connectivity may in part reflect the macro-level structural changes during development. Strengthening of long-range functional connections may be linked to increased myelination and signal transmission efficiency, which could facilitate the integration of information between functionally linked but distant regions (Bunge and Wright, 2007; Vogel et al., 2010). In contrast, the weakening of short-range connections may reflect selective synaptic pruning between brain regions, which
continues well into adolescence (e.g. Petanjek et al., 2011). DTI data was not collected in the present study, preventing us to test the association between underlying white matter changes and effective connectivity. However, using VBM, we tested whether gray matter volumes would predict connectivity strength. Our results showed that gray matter volume in the left RLPFC, along with age, predicted changes in the strength of fixed short-range frontoinsular connections. This effect was specific to this region as it remained when all five ROIs were included in the regression as predictors. Thus, the present data suggest that continued synaptic pruning with age in RLPFC could lead to a pattern of segregation of already connected regions within the frontal lobe and insula that is specific to relational integration.
30
adolescent and adult groups (Figure 4B). Therefore, while prior research suggests that the maturation of long-range connections may underlie aspects of integrative cognitive controls that are developing during adolescence (see Crone and Dahl, 2012, for review), in the current study, we found that performance was more directly associated with frontal connectivity, and RLPFC structure, which may be more directly relevant for the development of relational integration. In a study using a similar paradigm, Wendelken et al., (2011) observed that cortical thickness in the IPL decreased with age and predicted RLPFC and IPL activation during the manipulation of single relations, but not RLPFC activation (and less strongly IPL activation) during relational integration. This pattern suggests that maturation of IPL structure and function may be more directly associated with the manipulation of single relations, while (left) RLPFC may more specifically support relational integration, as proposed by neuroimaging studies in adults (Bunge et al., 2009; Christoff et al., 2001; Kroger et al., 2002; Wendelken et al., 2008).
This is the first study to investigate the development of relational reasoning through changes in effective connectivity with age. In line with previous rs-fcMRI results, we showed distinct developmental trajectories in the long-range frontoparietal and short-range frontoinsular connections and demonstrate how changes in connectivity may be linked to structural changes. We also showed how changes in connectivity strength could explain behavioral changes in response to the relational reasoning task, and how the frontal lobe and insulashows increasing selectivity for relational reasoning. One limitation of this study may be that the relational reasoning paradigm we used followed a block-design. Thus, specific neural processes through which the modulation of
31
time course data in rs-fcMRI studies (Power et al., 2012), which have lengthy ‘’rest’’ periods. Movement could potentially affect the connectivity changes in task based fMRI studies as well; however, a task based fMRI paradigm is more constrained than rs-fcMRI, with shorter duration and structured repetition of experimental blocks (here blocks lasted 20-32s), which reduces the likelihood that the group differences seen in our results could be substantially influenced by movement. Further, there was no age difference in mean movement amplitude in the present study, and parameter estimates were not correlated with mean movement amplitude across participants. Thirdly, the optimal DCM only partially explained the variance in the data and the range across participants was quite large (0-26%). We used a novel procedure, which selected the full connectivity model as optimal. Bayesian model selection considers a trade-off between accuracy and model complexity and may not necessarily represent the actual neural system engaged by the cognitive task (Stephan et al., 2010). In addition, the proportion of variance explained in DCMs may increase if methodological advances improve the modeling of interhemispheric connectivity (Stephan et al., 2007) and permit DCMs including regions in both hemispheres. Finally, because of the large number of regions involved in the Relational vs. Control comparisons, we grouped the connections
according to connection direction or connection length. A more stringent contrast, possibly using an event-related design, may identify a smaller network of brain regions specific to relational integration and enable the study of individual connections during development.
Conclusion
32
changes could partly account for the changes in RLPFC activity with age (Dumontheil et al., 2010). Results from the current study, give a better understanding of how the connectivity changes within PFC could further contribute to such complex pattern of functional activation during development. Studying the typical development of connectivity can inform future research investigating the atypical developmental trajectory of common neurologic and psychiatric illnesses, such as autism, attention deficit hyperactivity disorder (ADHD), or Tourette syndrome, which have all be found to show atypical patterns of resting state functional connectivity (see Uddin et al., 2010 and Vogel et al., 2010 for reviews). Here we show that the study of effective connectivity during an experimental paradigm can more specifically inform how particular cognitive processes develop. Combining behavioural, structural, functional and connectivity data will therefore be critical to further our understanding of the developmental mechanisms underlying the maturation of higher cognitive functions.
Acknowledgments
33 References
Ashburner J, Friston KJ (2000): Voxel-based morphometry--the methods. Neuroimage 11:805-821.
Badre D (2008) Cognitive control, hierarchy, and the rostro-caudal organization of the frontal lobes. Trends Cogn Sci 12:193-200.
Badre D, D'Esposito M (2007) Functional magnetic resonance imaging evidence for a hierarchical organization of the prefrontal cortex. J Cogn Neurosci 19:2082-2099.
Badre D, D'Esposito M (2009) Is the rostro-caudal axis of the frontal lobe hierarchical? Nat Rev Neurosci 10:659-669.
Barbalat G, Bazargani N, Blakemore SJ (2013) The influence of prior expectations on emotional face perception in adolescence. Cereb Cortex 23: 1542-1551.
Baron RM, Kenny DA (1986) The moderator-mediator variable distinction in social psychological research – conceptual, strategic, and statistical considerations. J Pers Soc Psychol 51:1173–1182.
Bitan T, Cheon J, Lu D, Burman DD, Booth JR (2009) Developmental increase in top-down and bottom-up processing in a phonological task: An effective connectivity, fMRI study. J Cog Neurosci 21:1135–1145.
Bunge SA, Helskog EH, Wendelken C (2009) Left, but not right, rostrolateral prefrontal cortex meets a stringent test of the relational integration hypothesis. Neuroimage 46:338-342.
34
Burnett S, Blakemore SJ (2009) Functional connectivity during a social emotion task in adolescents and in adults. Eur J Neurosci 29:1294-1301.
Burnett S, Sebastian C, Cohen Kadosh K, Blakemore SJ (2011) The social brain in
adolescence: Evidence from functional magnetic resonance imaging and behavioural studies. Neurosci Biobehav Rev 35:1654-1664.
Christakou A, Brammer M, Rubia K (2011) Maturation of limbic corticostriatal activation and connectivity associated with developmental changes in temporal discounting. Neuroimage 54:1344-1354.
Christoff K, Prabhakaran V, Dorfman J, Zhao Z, Kroger JK, Holyoak KJ, Gabrieli JD (2001) Rostrolateral prefrontal cortex involvement in relational integration during
reasoning. Neuroimage 14:1136-1149.
Christoff K, Ream JM, Geddes LP, Gabrieli JD (2003) Evaluating self-generated
information: anterior prefrontal contributions to human cognition. Behav Neurosci 117:1161-1168.
Cohen Kadosh K, Cohen Kadosh R, Dick F, Johnson, MH (2011) Developmental changes in effective connectivity in the emerging core face network. Cereb Cortex 21:1389-1394.
Colonnese M, Khazipov R (2012) Spontaneous activity in developing sensory circuits: Implications for resting state fMRI. Neuroimage 62:2212-2221.
Crone EA, Dahl RE (2012) Understanding adolescence as a period of social-affective engagement and goal flexibility. Nat Rev Neurosci 13:636-650.
35
Dosenbach NU, Nardos B, Cohen AL, Fair DA, Power JD, Church JA, Nelson SM, Wig GS, Vogel AC, Lessov-Schlaggar CN, Barnes KA, Dubis JW, Feczko E, Coalson RS, Pruett JR Jr, Barch DM, Petersen SE, Schlaggar BL (2010) Prediction of individual brain
maturity using fMRI. Science 329:1358-1361.
Dumontheil I, Burgess PW, Blakemore SJ (2008) Development of rostral prefrontal cortex and cognitive and behavioural disorders. Dev Med Child Neurol 50:168-181.
Dumontheil I, Houlton R, Christoff K, Blakemore SJ (2010) Development of relational reasoning during adolescence. Dev Sci 13:F15-24.
Fair DA, Cohen AL, Dosenbach NU, Church JA, Miezin FM, Barch DM, Raichle ME, Petersen SE, Schlaggar BL (2008) The maturing architecture of the brain's default network. Proc Natl Acad Sci USA 105:4028-4032.
Fair DA, Dosenbach NU, Church JA, Cohen AL, Brahmbhatt S, Miezin FM, Barch DM, Raichle ME, Petersen SE, Schlaggar BL (2007) Development of distinct control networks through segregation and integration. Proc Natl Acad Sci USA 104:13507-13512.
Ferrer E, O'Hare ED, Bunge SA (2009) Fluid reasoning and the developing brain. Front Neurosci 3:46-51.
Fox PT, Friston KJ (2012) Distributed processing; Distributed functions? Neuroimage 61:407-426.
Friston K (2002) Functional integration and inference in the brain. Prog Neurobiol 68:113-143.
Friston K (2003) Learning and inference in the brain. Neural Networks 16:1325-1352.
36
Friston K (2009) Causal modelling and brain connectivity in functional magnetic resonance imaging. PLoS Biol 7:0220.
Friston K (2012) Prediction, perception and agency. Int J Psychophysiol 83:248-252.
Friston KJ, Harrison L, Penny W (2003) Dynamic causal modelling. Neuroimage 19: 1273–302.
Friston KJ, Holmes AP, Poline JB, Grasby PJ, Williams SC, Frackowiak RS, Turner R (1995) Analysis of fMRI time-series revisited. Neuroimage 2:45-53.
Friston K, Kiebel S (2009) Predictive coding under the free-energy principle. Philos Trans R Soc Lond B Biol Sci 364:1211-1221.
Friston K, Li B, Daunizeau J, Stephan KE (2011) Network Discovery with DCM. Neuroimage 56:1202-1221.
Friston K, Penny W (2011) Post hoc Bayesian model selection. Neuroimage 56:2089-2099.
Fuster JM (2002) Frontal lobe and cognitive development. J Neurocytol 31:373-385.
Fuster JM (2009) Cortex and memory: Emergence of a new paradigm. J Cogn Neurosci 21:2047-2072.
Hillebrandt HF, Dumontheil I, Blakemore S-J, Roiser JP (2013). Dynamic Causal
Modelling of effective connectivity during perspective taking in a communicative task. Neuroimage 76:116-124.
37
Hyde KL, Zatorre RJ, Griffiths TD, Lerch JP, Peretz I (2006) Morphometry of the amusic brain: A two-site study. Brain 129:2562-2570.
Johnson MH (2001) Functional brain development in humans. Nat Rev Neurosci 2:475-483.
Jolles DD, van Buchem MA, Crone EA, Rombouts SA (2011) Functional brain connectivity at rest changes after working memory training. Hum Brain Mapp 21:385-391.
Kelly C, Biswal BB, Craddock RC, Castellanos FX, Milham MP (2012) Characterizing variation in the functional connectome: Promise and pitfalls. Trends Cogn Sci 16:181-188.
Kilner JM, Friston KJ, Frith CD (2007) The mirror-neuron system: A Bayesian perspective. Neuroreport 18:619-623.
Koechlin E, Summerfield C (2007) An information theoretical approach to prefrontal executive function. Trends Cogn Sci 11:229-235.
Kroger JK, Sabb FW, Fales CL, Bookheimer SY, Cohen MS, Holyoak KJ (2002) Recruitment of anterior dorsolateral prefrontal cortex in human reasoning; A parametric study of relational complexity. Cereb Cortex 12:477-485.
Luna B, Padmanabhan A, O'Hearn K (2010) What has fMRI told us about the
development of cognitive control through adolescence? Brain Cognition 72:101-113.
Marreiros AC, Kiebel SJ, Friston KJ (2008) Dynamic causal modelling for fMRI: A two-state model. NeuroImage 39:269-278.
Miller EK, Cohen JD (2001) An integrative theory of prefrontal cortex function. Annu Rev Neurosci 24:167-202.
38
regions associated with interference control and time perception. Neuroimage 43:399-409.
O’Brien LM, Ziegler DA, Deutsch CK, Kennedy DN, Goldstein JM, Seidman LJ, Hodge S, Makris N, Caviness V, Frazier JA, Herbert MR (2006) Adjustment for whole brain and cranial size in volumetric brain studies: A review of common adjustment factors and statistical methods. Harv Rev Psychiatry 14:141–151.
Paus T, Keshavan M, Giedd JN (2008) Why do many psychiatric disorders emerge during adolescence? Nat Rev Neurosci 9:947-957.
Petanjek Z, Judas M, Simic G, Rasin MR, Uylings HB, Rakic P, Kostovic I (2011)
Extraordinary neoteny of synaptic spines in the human prefrontal cortex. P Natl Acad Sci USA 108:13281-13286.
Power JD, Barnes KA, Snyder AZ, Schlaggar BL, Petersen SE (2012) Spurious but systematic correlations in functional connectivity MRI networks arise from subject motion. NeuroImage 59:2142-2154.
Rosa MJ, Friston K, Penny W (2012) Post-hoc selection of dynamic causal models. J Neurosci Meth 208:66-78.
Rubia K (2012) Functional brain imaging across development. Eur Child Adolesc Psy [epub ahead of print, doi: 10.1007/s00787-012-0291-8].
Salin P, Bullier J (1995) Corticocortical connections in the visual system: Structure and function. Physiol Rev 75:107-154.
Smith R, Keramatian K, Christoff K (2007) Localizing the rostrolateral prefrontal cortex at the individual level. Neuroimage 36:1387-1396.
39
Stephan KE, Friston KJ (2010) Analyzing effective connectivity with fMRI. WIREs Cogn Sci 1:446-459.
Stephan KE, Marshall JC, Penny WD, Friston KJ, Fink GR (2007). Interhemispheric
integration of visual processing during task-driven lateralization. Journal of
Neuroscience 27:3512–3522.
Stephan KE, Penny WD, Moran RJ, den Ouden HE, Daunizeau J, Friston KJ (2010) Ten simple rules for dynamic causal modeling. Neuroimage 49:3099-3109.
Stevens MC, Kiehl KA, Pearlson GD, Calhoun VD (2007) Functional neural networks underlying response inhibition in adolescents and adults. Behav Brain Res 181:12-22.
Supekar K, Musen M, Menon V (2009) Development of large-scale functional brain networks in children. PLoS Biol 7:1-15.
Supekar K, Uddin LQ, Prater K, Amin H, Greicius MD, Menon V (2010) Development of functional and structural connectivity within the default mode network in young children. Neuroimage 52:290-301.
Tzourio-Mazoyer N, Landeau B, Papathanassiou D, Crivello F, Etard O, Delcroix N, Mazoyer B, Joliot M (2002) Automated anatomical labeling of activations in SPM using a macroscopic anatomical parcellation of the MNI MRI single-subject brain. Neuroimage 15:273-289.
Uddin LQ, Supekar K, Menon V (2010) Typical and atypical development of functional human brain networks: insights from resting-state FMRI. Front Syst Neurosci 4:1-12.
Uddin LQ, Supekar KS, Ryali S, Menon V (2011) Dynamic reconfiguration of structural and functional connectivity across core neurocognitive brain networks with
40
Vogel AC, Power JD, Petersen SE, Schlaggar BL (2010) Development of the brain's functional network architecture. Neuropsychol Rev 20:362-375.
Wechsler D (1999) Wechsler Abbreviated Scale of Intelligence (WASI). San Antonio, TX. Harcourt Assessment.
Wendelken C, Nakhabenko D, Donohue SE, Carter CS, Bunge SA (2008) "Brain is to thought as stomach is to ??": Investigating the role of rostrolateral prefrontal cortex in relational reasoning. J Cogn Neurosci 20:682-693.
41
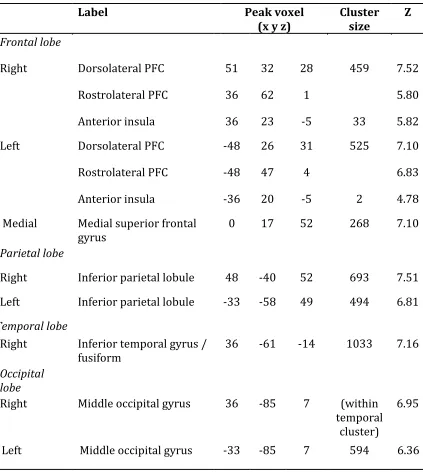
Table 1: Whole-brain analyses (FWE, p < .05) of the main effect of experimental condition (Relational > Control) averaged across the three age groups. PFC: prefrontal cortex; Z: z score. (See also Dumontheil et al., 2010).
Label Peak voxel
(x y z) Cluster size Z
Frontal lobe
Right Dorsolateral PFC 51 32 28 459 7.52
Rostrolateral PFC 36 62 1 5.80
Anterior insula 36 23 -5 33 5.82
Left Dorsolateral PFC -48 26 31 525 7.10
Rostrolateral PFC -48 47 4 6.83
Anterior insula -36 20 -5 2 4.78
Medial Medial superior frontal
gyrus 0 17 52 268 7.10
Parietal lobe
Right Inferior parietal lobule 48 -40 52 693 7.51 Left Inferior parietal lobule -33 -58 49 494 6.81
Temporal lobe
Right Inferior temporal gyrus /
fusiform 36 -61 -14 1033 7.16
Occipital
lobe
Right Middle occipital gyrus
36 -85 7 temporal (within
cluster)
6.95
42
Table 2: Fixed frontal short-range connections predicted by gray matter volumes in the five ROIs. This table presents results of a multiple regression analysis entering mean adjusted gray matter volumes in the five ROIs of the DCM in a single analysis (F(5,27) = 1.90, P = 0.13, R2 = 0.26). Greater gray matter volumes in the left RLPFC predicted greater fixed short-range connections strength (EpA) independently of gray matter volumes in the other ROIs. GM: Gray matter. * indicates significance at P < 0.05.
Dependent variable:
Short-range EpA
Unstandardized
coefficient B Standardized β t
(Constant) -0.640 -2.47
AI GM -0.969 -0.358 -0.95
DLPFC GM -1.710 -0.597 -1.28
IPL GM 0.647 0.281 0.98
mSFG GM -0.377 -0.182 -0.51
43 Figures
Figure 1: Stimuli of the experimental paradigm. In the Control condition (left),
44
Figure 2: Main effect of Relational > Control. The main effect of the experimental
45
Figure 3: Results of the post-hoc model search. (A) The full DCM, as illustrated here, had the highest probability compared with all other possible models. (B and C) Mean (± SE) connection probabilities for the fixed (PpA) and modulatory (PpB) connections.
46
Figure 4: Parameter estimates of the fixed and modulatory short-range and long-range connections plotted for each age group. (A) Exponentiated mean and 95% confidence interval (CI) of the parameter estimates of fixed connections (EpA). Long-range connections were stronger than short-range connections, and there was a significant interaction between Connection length and Age group. Short-range connections were stronger in young adolescents than mid adolescents and adults (indicated by *), while long-range connections did not differ between age groups. (B) Exponentiated mean and 95% CI of the parameter estimates of the modulatory connections. Long-range
47
48
Figure 6: Scatterplot of Relational vs. Control accuracy as a function of frontal fixed (EpA) and modulatory (EpB) short-range connections. (A) The difference in accuracy between Control and Relational trials (a greater positive value means poorer