0095-1137/04/$08.00⫹0 DOI: 10.1128/JCM.42.12.5793–5801.2004
Mapping of Genomic Segments of Influenza B Virus Strains by an
Oligonucleotide Microarray Method
Anna V. Ivshina,
1Galina M. Vodeiko,
1Vladimir A. Kuznetsov,
2Dmitry Volokhov,
1Rolf Taffs,
1Vladimir I. Chizhikov,
1Roland A. Levandowski,
1and Konstantin M. Chumakov
1*
Center for Biologics Evaluation and Research, Food and Drug Administration, Rockville,1
and SRA International Inc., Bethesda,2Maryland
Received 4 May 2004/Returned for modification 6 July 2004/Accepted 30 July 2004
Similar to other segmented RNA viruses, influenza viruses can exchange genome segments and form a wide variety of reassortant strains upon coreplication within a host cell. Therefore, the mapping of genome segments of influenza viruses is essential for understanding their phenotypes. In this work, we have developed an oligonucleotide microarray hybridization method for simultaneous genotyping of all genomic segments of two highly homologous strains of influenza B virus. A few strain-specific oligonucleotide probes matching each of the eight segments of the viral genomes of the B/Beijing/184/93 and B/Shangdong/7/97 strains were hybridized with PCR-amplified fluorescently labeled single-stranded DNA. Even though there were a few mismatches among the genomes of the studied virus strains, microarray hybridization showed highly significant and reproducible discrimination ability and allowed us to determine the origins of individual genomic segments in a series of reassortant strains prepared as vaccine candidates. Additionally, we were able to detect the presence of at least 5% of mixed genotypes in virus stocks even when conventional sequencing methods failed, for example, for the NS segment. Thus, the proposed microarray method can be used for (i) rapid and reliable genome mapping of highly homologous influenza B viruses and (ii) extensive monitoring of influenza B virus reassortants and the mixed genotypes. The array can be expanded by adding new oligoprobes and using more quantitative assays to determine the origin of individual genomic segments in series of reassortant strains prepared as vaccine candidates or in mixed virus populations.
Influenza viruses A and B possess segmented genomes con-sisting of eight separate RNA molecules, each coding for one or more viral proteins (15, 19). Upon coreplication in a cell, the viruses can exchange segments, leading to diversity of reassor-tant strains. Together with accumulation of point mutations, segment reassortment is the basis for evolution and mainte-nance of diversity for many viral pathogens. It provides them with the ability to rapidly adapt to the pressure of the host immune system and leads to the continuous emergence of new virus variants that cause seasonal outbreaks of influenza (17). Because of this ability, segmented viruses can exist in numer-ous genotypes and serotypes, presenting a challenge to the creation of protective vaccines. On the other hand, it also provides the basis for a rational approach to the development of influenza vaccines (2, 4, 21, 23).
Gradual antigenic drift and intermittent occurrences of more substantial antigenic shifts make the creation of new prospective seed virus strains for both inactivated and live attenuated influenza vaccines a continuous process that must be completed within a short period before each epidemic sea-son. To be effective, prospective vaccine strains must not only possess the antigenic properties of the currently circulating strains but also replicate well in the substrate used for their manufacture. Some naturally occurring influenza virus isolates do not grow well in substrates used for vaccine production (e.g., embryonated chicken eggs). Adaptation of influenza vi-ruses for optimal growth by passaging them in a target
sub-strate is a time-consuming process that may also allow the accumulation of random mutations that can alter antigenic specificity. An alternative strategy is to create reassortants be-tween the currently circulating strains and another strain pre-viously adapted for high growth in vitro (2, 21). The reassor-tants should contain genes coding for the protective antigens (hemagglutinin [HA] and neuraminidase [NA]), as well as genes determining the optimal replicative properties of the virus. Selection of appropriate reassortants is aided by reverse transcription (RT)-PCR and restriction fragment length poly-morphism (RFLP) tests of multiple candidate clones (13, 18) and multiplex RT-PCR with single-strand conformation poly-morphism analysis (1). However, none of these methods is fully adequate, and the creation of new rapid, highly specific, sen-sitive, and reproducible segment-mapping techniques remains highly desirable.
Hybridization with microarrays of immobilized oligonucleo-tides is a rapid alternative to DNA sequence analysis (6, 12) and has been used for the genotyping of viruses, bacteria, and genes of higher organisms (7, 9, 10, 20). Recently, a microarray method has been used for the successful genotyping of the VP7 gene of rotaviruses (8) and for analysis of intermolecular re-combinants of poliovirus (5), as well as for detection and dis-crimination of orthopoxviruses (14). Recently, the potential of microarray hybridization for detection and discrimination be-tween types and subtypes of influenza A viruses has been shown by using 24 long oligoprobes (average, 500 nucleotides [nt] [16]). Shorter oligoprobe microarrays (between 4 and 128 nt) have been developed for the detection of influenza viruses (22). However, in the latter study, the intensities of probe spots completely complementary to target sequences lacked
defini-* Corresponding author. Mailing address: CBER/FDA, 1401 Rock-ville Pike HFM-470, RockRock-ville, MD 20852. Phone: (301) 594-3720. Fax: (301) 827-4622. E-mail: [email protected].
5793
on May 15, 2020 by guest
http://jcm.asm.org/
tive boundaries between significant hybridization and nonspe-cific background binding, and most of the monospenonspe-cific NA and HA subtype probes have not been discriminated by the array.
For better discrimination of closely related segmented RNA viruses, we report a new high-throughput oligonucleotide mi-croarray-based method to map the origins of all segments of two closely related influenza B viruses, B/Beijing/184/93 and B/Shangdong/7/97, which were used as the models for devel-opment of the method. The two influenza B viruses were cho-sen for the study because B/Shangdong/7/97 is a naturally occurring reassortant with three segments (PA, NP, and M) derived from a precursor virus phylogenetically related to B/Beijing/184/93 and therefore presented a challenge by re-quiring the ability to distinguish between single-base substitu-tions. In addition, the strains possess different growth charac-teristics in embryonated chicken eggs (23) and may serve as a model for the reassortment approach to the creation of influenza B vaccines. The proposed microarray approach en-abled us to successfully discriminate all eight segments of the Beijing and Shangdong strains despite minimal differences be-tween them.
MATERIALS AND METHODS
Experimental methods. (i) Viruses and reassortants. The strains used to generate virus reassortants were previously described (23). The potential vaccine candidate influenza viruses Beijing/184/93 and Shangdong/7/97 passaged only in embryonated chicken eggs were received from the Centers for Disease Control and Prevention, Atlanta, Ga. The strains used to generate virus reassortants were previously described (23). The viruses were grown in 11-day-old embryonated chicken eggs. The allantoic cavities of the embryonated eggs were inoculated with the original allantoic fluids diluted 1:1,000 in phosphate-buffered saline
containing 10g of gentamicin/ml. Each egg was inoculated with 0.2 ml of
diluted allantoic fluid and incubated at 33°C for 72 h. To make reassortants, eggs were coinoculated with 1,000 50% egg infective doses (each) of the B/Beijing/ 184/93 and B/Shangdong/7/97 virus strains/0.2 ml. The mixed progeny from reassortment passage were harvested and neutralized with postinfection ferret anti-B/Shangdong/7/97 serum (1 volume of a 1:10 dilution of virus added to 1 volume of a 1:10 dilution of serum) for 1 h at room temperature. Subsequently, the embryonated eggs were inoculated with 10-fold serial dilutions of the virus-serum mixture. Viruses recovered from this passage that had HA titers of 1:128 to 1:256 were selected for cloning by the terminal-dilution method in two further passages in eggs.
(ii) RNA preparation and reverse transcription.Viral RNA was extracted from allantoic fluid using the Viral RNA Mini kit (QIAGEN, Valencia, Calif.), and cDNA was synthesized using Thermoscript RT polymerase (ThermoScript RT-PCR System; Invitrogen, Carlsbad, Calif.) with an AGCAGAAGC primer
complementary to the conserved 3⬘ends of all influenza B virus genome
seg-ments, either alone or in a mixture with a random hexanucleotide (dN6). The
resulting cDNA was used for multiplex PCR amplification.
(iii) Nucleic acid sequencing and analysis.The nucleotide sequences of all eight segments of B/Beijing/184/93 were obtained from GenBank. The sequences of genome segments of B/Shangdong/7/97 were determined in our laboratory (23).
cDNA samples were prepared by 30 cycles of PCR amplification (HotStarTaq Master Mix; QIAGEN) using primers specific for partial sequences of eight genome segments. Amplification products were separated by electrophoresis in 1% agarose gel, extracted with the QIAquick Gel Extraction kit (QIAGEN), and sequenced using a dRhodamine Terminator Cycle Sequencing kit (PE Biosys-tems, Warrington, United Kingdom) and an ABI Prizm model 377 (Applied Biosystems, Foster City, Calif.).
(iv) Multiplex PCR and synthesis of Cy5-labeled hybridization samples. Am-plicons of all eight influenza B virus genome segments were prepared in two multiplex PCRs; the primer pair for the PB2, PB1, PA, and HA segments in one multiplex PCR was B1-S1, and the primer pair for the NP, NA, M, and NS segments the other multiplex PCR was B2-S2 (B and S refer to Beijing and Shangdong, respectively). The sequences of the PCR primers are listed in Table
1. One primer in each pair was 5⬘biotinylated for strand separation and
prep-aration of Cy5 fluorescently labeled single-stranded DNA samples as previously
described (8). Briefly, 30l of a reaction mixture containing 1⫻AmpliTaq PCR
buffer with 1.5 mM MgCl2; a 200 nM concentration of each primer; 20M
Cy5-dCTP; 20M dCTP; 200M (each) dATP, dGTP, and dTTP; and 0.8 U of
HotStartTaq DNA Polymerase (QIAGEN) was used. Amplification was per-formed by 35 PCR cycles consisting of 30 s at 94°C, 30 s at 45°C, and 60 s at 72°C. Single-stranded DNA was prepared by the separation of DNA strands using streptavidin-coated magnetic beads (Dynal ASA, Oslo, Norway) according to the manufacturer’s protocol. Fluorescently labeled single-stranded DNA was eluted
from the magnetic beads by washing them with 50l of 0.1 M NaOH purified
through CentriSep spin columns (Princeton Separation, Adelphia, N.J.), concen-trated by vacuum drying, and finally resuspended in water.
(v) Preparation of oligoprobes and microchips and microarray hybridization.
Oligoprobes (17 to 22 nt) were designed to match the regions of each segment that were previously found to contain one or more nucleotide differences be-tween the RNA sequences of the B/Beijing/184/93 and B/Shangdong/7/97 strains.
The selected oligoprobe pairs differed by 1 to 7 nt (Table 2). The 5⬘end of each
oligoprobe contained an aminolink group (TFA Aminolink CE reagent; PE Applied Biosystems) added during the synthesis. The probes were covalently immobilized on the surfaces of aldehyde-coated glass slides. Additional spots of oligonucleotides complementary to one of the primers for PCR amplification were used as qualitative positive controls for sample preparation and hybridiza-tion (Table 2). These controls were not used for the normalizahybridiza-tion of array signals and therefore were not reflected in the results (i.e., they are not shown in Fig. 1).
Microarray fabrication and hybridization were described in detail earlier (8). The concentration of oligonucleotides in 0.25 M acetic acid was adjusted to 75 mM. After the oligonucleotides were spotted using a robotic arrayer (Cartesian Technologies Inc., Ann Arbor, Mich.), the slides were dried for 20 min at 84°C
and treated with a 0.25% aqueous solution of NaBH4for 5 min. Single-stranded
Cy5-labeled influenza B virus DNA samples were mixed with equal volumes of
2⫻hybridization buffer, denatured for 1 min at 95°C, and chilled on ice for 1 min.
The final concentration of each fluorescent sample in hybridization solution was
typically⬎0.1M; 3-l aliquots from each sample were applied to the array
area. Each array was covered with a 4- by 7-mm plastic coverslip, and hybrid-ization was allowed to proceed for 30 min at 42°C. After hybridhybrid-ization, the slides
were washed sequentially with 6⫻SSC (1⫻SSC is 0.15 M NaCl plus 0.015 M
sodium citrate), 2⫻SSC, and 1⫻SSC and dried in an air stream.
(vi) Array design.Figure 1 shows the layout of oligoprobes on the microarray. Each array consisted of four identical subarrays, and each subarray contained 20 oligoprobes redundantly representing eight segments of the B/Beijing/184/93 strain and 20 oligoprobes representing eight segments of the B/Shangdong/7/97 strain. Each subarray consisted of four areas containing oligoprobes complemen-tary to one of four fluorescently labeled cDNA samples designated B1, B2, S1, and S2 (see “Multiplex PCR and synthesis of Cy-5-labeled hybridization sam-ples” above).
[image:2.585.301.541.89.255.2]Eight identical arrays were printed on each slide. Therefore, each of the four fluorescently labeled cDNA samples could be hybridized twice on each slide. This design enabled us to produce eight replicates of the homotypic hybridization
TABLE 1. PCR primers used for amplification of genomic segments of influenza B virus
Primer name Sequence Tm(°C)
(basic)a
PB2-541POS-BIOT CCAAGAGAATCTACTTGGATACATA 53
PB2-844NEG AGTCTTGTTTGCAATTTCTACAGC 52
PB-1-790POS-BIOT GAAAATCTAGAACAAAGTGGTTTGC 53
PB-1-990NEG CAAAAATCCCGGAACCAAATTGG 53
PA-1845POS-BIOT CAGTATTGGGACTCAAGAAGG 52
PA-2061NEG CAAGGGTTGTTACTAATACATTCT 51
HA-327NEG TGTTCTGTCGTGCATTATAGGAAAG 54
HA-160-POS-BIOT TCTCATTTTGCAAATCTCAAAGGAACA 54
NP-4POS TCCAACATGGATATTGACGGT 50
NP-273NEG-BIOT GTTATAGAATTCACCCAGTT 46
NA-1006POS CAGATGATGGAAGCATAACAG 50
NA-1156NEG-BIOT CTCCATCATACTTGACATACAGTT 52
M-894-POS-BIOT AACAGAGAGGTATCAATTTTGAG 50
M-1053-NEG TTAATGCAATTCTTCTACCTCCAA 51
NS-264POS CCTATTTATGAACCCATCTGCT 51
NS-485NEG-BIOT CCTTCTTTCTGAGTGTTTACTTCC 54
a
Tm, melting temperature.
on May 15, 2020 by guest
http://jcm.asm.org/
FIG. 1. Influenza B virus array design. The array consists of four identical subarrays. A solid circle indicates a spot containing printed oligoprobe; an open circle indicates a control spot containing no printed oligoprobe to assess background sample binding. Each subar-ray contained 40 oligoprobes (Table 1). The left part of each subarsubar-ray contained 20 oligoprobes complementary to the Beijing strain; the right part contained 20 oligoprobes complementary to the Shangdong strain. The pairs of homologous oligoprobes of the Beijing and Shang-dong strains were printed symmetrically across the vertical axis of a subarray. Each subarray consisted of four areas. Each area contained oligoprobes complementary to one of the four fluorescently labeled cDNA samples: B1, B2, S1, or S2 (see “Multiplex PCR and synthesis of Cy-5-labeled hybridization samples”). To assist in the visual presen-tation, the areas of oligoprobes complementary to the B1 and S1 samples are separated from the B2 and S2 samples.
TABLE 2. Oligoprobes used for discrimination between Beijing and Shangdong strains of influenza B virusa
Oligoprobe Sequence Tm(°C)
(basic)b
PB2
PB2-B-625 CTTGAGAGGGAATTGGTTGC 52
PB2-S-625 CTTGAAAGAGAACTGGTTGC 50
PB2-B-643 CCAGAAGAAGGTTCCTGCC 53
PB2-S-643 CCCGAAGAAGATTCTTGCC 51
PB2-B-591 GAACGATGATAACTCCCATT 50
PB2-S-590 AACAATGATAACTCCAATT 49
PB2-665-F-cont TGGCAGGAGCAACATCAGC 53
PB1
PB1-B-929 AATGAATGCTTAAATCCAAGAA 46
PB1-S-929 AATGAATGTTTAAACCCAAGAA 46
PB1-B-823 GGAAATGAAAAGAAGGCCAA 48
PB1-S-823 GGAAACGAAAAGAAAGCCAA 48
PB1-990-F-cont CCAATTTGGTTCCGGGATTTTTG 53
PA
PA-B-1954 AGGGGTTTAGTGCCGAGT 50
PA-S-1954 AGGGATTTAGTGCAGAGT 46
PA-B-1979 GGAGACTTCTACTGTTG 45
PA-S-1979 GGAGACTTTTACTGTTG 42
PA-B-2034 GACTTAGAGGGAATGTA 42
PA-S-2034 GACTTAGAAGGAATGTA 40
PA-1107-F-cont GTTCAAACAGAGATGAATCTATTG 51
HA
HA-B-253 CCAATGTGTGTGGGGACCAC 56
HA-S-253 CCAAAATGCACGGGGAACAT 52
HA-B-207 CCCAAACTGTCTCAACTG 48
HA-S-207 CCCAAAATGCCTCAACTG 48
HA-327-F-cont CTTTCCTATAATGCACGACAGAA 52
NP
NP-B-30 TTGTCAGTTGTCCCAGTG 48
NP-S-30 TTGTCAATTGTTCCAGTG 43
NP-B-37 CGGTGTTTTGTCAGTTGT 46
NP-S-37 CGGTGCTTTGTCAATTGT 46
NP-B-188 CTTTTGGGCTTTCCTTC 45
NP-S-188 CTTTTGGGTTTTCCTTC 42
NP-4-R-cont ACCGTCAATATCCATGTTGGA 50
NA
NA-B-1051 TGATGCCACCACGCCCTT 53
NA-S-1051 CTTGATACCTCCATTCCCTT 50
NA-B-1108 GTTCGAGAATACCACCTTC 49
NA-S-1108 GTTCGAAAGTACCATCTTC 47
NA-1006-R-cont CTGTTATGCTTCCATCATCTG 50
M
M-B-970 ACAACATGGAGGTATTGA 43
M-S-970 ACAACATAGAAGTATTGA 39
M-B-1004 GAGACACAGTTACCAAAA 43
M-S-1004 GAGACACAATTACCAAAA 41
M-1053-F-cont TTGGAGGTAGAAGAATTGCATTAA 51
NS
NS-B-304 GCTATTGGAGGGATTTTTCA 48
NS-S-304 GCTATTTGAGGAACTTTTCA 46
NS-B-337 CCAATTGCAGTCTGGACA 48
NS-S-337 CCAATTGTATTTCGGACAG 47
NS-B-403 GTCACCAACATTCTCCGGTTC 54
NS-S-403 GTCATCAACATCCTCTGTTTC 50
NS-264-R-cont AGCAGATGGGTTCATAAATAGG 51
a
PB2, PB1, PA, HA, NP, NA, M, and NS, segments of influenza B virus. F-cont and R-cont indicate the oligoprobes complementary to forward primers and to reverse primers, respectively, which were used for PCR amplification. The homotypic hybridization signals of these oligoprobes were used as the qualitative indicators (positive controls) of sample preparation and hybridization.
b
Tm, melting temperature.
on May 15, 2020 by guest
http://jcm.asm.org/
[image:3.585.48.325.100.667.2]signal and eight replicates of the heterotypic hybridization signal (used as the negative control) for each of the 20 unique oligoprobes spotted on a slide. For example, the Beijing sample B1 could hybridize to eight homotypic Beijing-specific oligoprobes (PB2-B-591) and to eight heterotypic Shangdong-Beijing-specific oligoprobes (PB2-S-591).
(vii) Microchip scanning and data analysis.Microchip images were captured using a ScanArray 5000 confocal fluorescent scanner (Perkin-Elmer, Boston, Mass.) with two HeNe lasers (632 nm for excitation of Cy5 and 543 nm for Cy3). The fluorescent images were analyzed using QuantArray software (Perkin-Elmer).
(viii) Restriction enzyme digestion.Three micrograms of each NS segment
amplicon was digested at 30°C for 65 min in 20l of reaction mixture containing
2 U of the HgaI restriction enzyme (New England BioLabs Inc., Beverly Mass.). The products of digestion were separated by electrophoresis in 9.5% polyacryl-amide gels.
Statistical methods: background subtraction and signal normalization.LetA
represent the value of the intensity of the hybridization signal of a given fluo-rescently labeled cDNA sample hybridized with the homotypic oligoprobe on the
array; letBrepresent the value of the intensity of the hybridization signal of the
sample hybridized with the heterotypic oligoprobe on the same array. LetKbe
the value of the background intensity of the signal measured in mock spots on
this array (printed without oligoprobe) (Fig. 1). We measuredKvalues in 64
mock spots on each array.
To reduce the effect of background (nonspecific binding of the fluorescently labeled cDNA sample to the array) and to compare the homotypic hybridization signals across arrays and different slides, we estimated the relative level of homotypic hybridization signal for a given oligoprobe by the following formula:
I⫽IA⫺IB (1)
whereIA⫽(A⫺K)/(A¯⫺K) andIB⫽(B⫺K)/(A¯⫺K).Kis the mean value of
background intensities averaged over the 64 signals measured in mock spots on
the array (printed without oligoprobe [Fig. 1]).A¯ is the mean value of the
homotypic signal averaged over four subarrays on the array. Because the oligo-probes of the array were hybridized to only one of the four labeled cDNA samples, the local (on the array) normalization of the hybridization signal on
factorA¯⫺Kallowed us to compare the interarray and interslide variabilities of
the specific signals for a given oligoprobe.
The four pairs ofIAandIBvalues on each array were compared by Wilcoxon’s
signed-rank pair test. We also used the Kruskal-Wallis test for multiple
compar-isons of the arrays in the replicated experiments and a pairedttest and a one-way
analysis of variance test to compare theIAandIBvalues in the replicated
experiments. Estimation of the number of replicates of arrays and the confidence probabilities of the false-negative rate for hybridizations is described in the appendix.
The MLAB (Civilized Software, Inc., Silver Spring, Md.), Statistica-5 (Stat-Soft, Inc., Tulsa, Okla.), and JMP (SAS Institute Inc.) programs were used for statistical analysis.
Nucleotide sequence accession numbers.The sequences of genome segments of B/Shangdong/7/97 determined in our laboratory (23) were deposited in Gen-Bank under accession numbers AF 484967, AY044173, AF486835, AF486836, AY044169, AY044172, AY044171, AY044170, AF101974, AF101992, AF102009, AF050061, AF100367, AF100381, and AF100399.
RESULTS
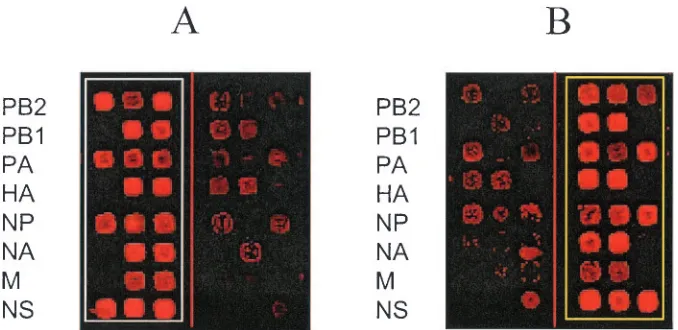
Analysis of hybridization patterns of Beijing and Shang-dong strains.Figure 2 shows typical hybridization patterns for the B/Beijing/184/93 and B/Shangdong/7/97 strains (only one of four identical subarrays is shown). All segments were un-ambiguously identified as either Beijing or Shangdong, even though for some oligoprobe pairs there was some cross-hybrid-ization.
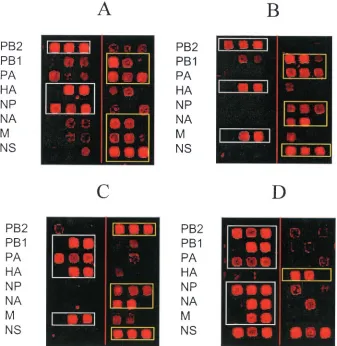
[image:4.585.123.462.67.232.2]We also obtained several hybridization patterns for reassor-tant samples. Representative examples are shown in Fig. 3. In reassortant A, the segments PB2, HA, and NP were derived from the Beijing parent while the other five segments were derived from the Shangdong parent. In reassortant B, the seg-ments PB2, HA, and M were derived from the Beijing parent while the other five segments were derived from the Shang-dong parent. In reassortant C, the segments PB1, PA, HA, and
FIG. 2. Typical hybridization for reference virus strains B/Beijing/184/93 and B/Shangdong/7/97 on a subarray. For purposes of visual presen-tation, hybridization patterns obtained for multiplex PCR products containing PB2, PB1, PA, and HA segments and NP, NA, M, and NS segments were combined in one image. (A) Hybridization spots for labeled single-stranded DNA samples of Beijing virus homotypically hybridized with 20 Beijing-complementary oligoprobes and heterotypically hybridized with 20 Shangdong-complementary oligoprobes (control). (B) Hybridization spots for labeled single-stranded DNA samples of Shangdong virus heterotypically hybridized with 20 Beijing-complementary oligoprobes (control) and homotypically hybridized with 20 Shangdong-complementary oligoprobes. The hybridization spots in the rows of a subarray represent hybridizations of a Cy-5 fluorescently labeled single-stranded DNA sample with different oligoprobes printed in the row. For purposes of visual presentation and inspection, the vertical line going through the subarray separates three columns containing the Beijing-complementary oligo-probes (on the left side of the subarray) and the three columns containing the Shangdong-complementary oligooligo-probes (on the right side of the subarray). Each row on a subarray represents oligoprobes of one genome segment of influenza virus. The oligoprobes were printed in a mirror symmetry manner relative to this line (see details in Fig. 1). The identifiers of genome segments are showed on the left in panels A and B. The PB2, PA, NP, and NS genome segments of the Beijing and Shangdong strains are represented by three different oligoprobes and by three observed hybridization spots. The PB1, NA, HA, and M genome segments of these strains are represented by two different oligoprobes and by the two hybridization spots. In the last case, two “empty” spots on the rows of the subarray are observed.
on May 15, 2020 by guest
http://jcm.asm.org/
M were derived from the Beijing parent while the other four segments were derived from the Shangdong parent. These results are in complete agreement with the sequence analysis data (not shown) and thus demonstrate that microarray hy-bridization of amplicons of reassortants between the Beijing and Shangdong strains can reveal the origins of the segments. However, in some instances, identification of the segment or-igin was not as clear. One such example is shown in Fig. 3: reassortant D consisted of segments PB2, PB1, PA, NP, NA, and M derived from the Beijing parent, while segment HA was derived from the Shangdong parent. However, the hybridiza-tion intensities of all Beijing- and Shangdong-specific oligo-probes binding the NS segment were comparable. This pattern could be a result of the mixture of two NS segment genotypes in the sample. To test this possibility and to determine the limits of the ability of the microarray to detect genetic heter-ogeneity, we performed a detailed quantitative analysis of microarray hybridization results (see “Identification of mixed genotype samples: microarray hybridization is superior to con-ventional nucleotide sequencing analysis” below). To do this, we had to determine the statistical significance of the microar-ray hybridization data.
Statistical analysis of microarray hybridization data.Seven independent hybridization experiments were performed and analyzed for evaluation of the discriminating power of
individ-ual oligoprobes. Each experiment included eight replicates of homotypic and heterotypic hybridization signals (fluorescence intensity) obtained from 20 pairs of oligoprobes (spotted on the slide) specific to B/Beijing/184/93 and B/Shangdong/7/97. Relative hybridization intensities were calculated by back-ground subtraction and normalization as described in Materi-als and Methods. For each of the 40 different oligoprobes, the normalized signal intensities did not differ significantly for the matching spot pairs located on the same slide (P⬎0.1 by the Wilcoxon and pairedttests) and for all seven slides (P⬎0.1 by the Wilcoxon and Kruscal-Wallis tests). Hence, the back-ground subtraction and normalization procedures allowed us to treat specific hybridization signals for the same oligoprobes on a slide and across different slides as samples chosen from the same population. The statistical comparisons of the 56 combined hybridization experiments (7 hybridization experi-ments, each including eight replicates) implies that the mi-croarray method is highly sensitive, specific, and reproducible (Table 3). Comparison of homotypic and heterotypic signals by thetand F tests showed that thePvalues for homotypic signal intensities were statistically significant (0.000001⬍P⬍0.01) for 40 oligoprobes.
Sample replication within each slide and redundancy of oli-goprobes for each segment of the influenza B virus genome increase the reliability of the method. In particular,
perfor-FIG. 3. Discrimination of hybridization patterns of four different reassortants on a subarray. See details in the text. Microarray elements specific to the prevailing RNA segment are boxed.
on May 15, 2020 by guest
http://jcm.asm.org/
[image:5.585.124.461.69.415.2]mance of the seven hybridization experiments reduces the like-lihood of making false-negative determinations of the presence of the segment from a given strain (Table 4). The maximum probabilities of false-negative determinations for each segment were calculated as described in the appendix. For all eight influenza B virus segments, the probabilities ranged from 0.027 to 0.00014, indicating the high power of the influenza B virus microarray to discriminate between the Beijing and Shangdong viruses.
Identification of mixed genotype samples: microarray hy-bridization is superior to conventional nucleotide sequencing analysis.We compared the discriminating abilities of micro-array hybridization and conventional nucleotide sequencing analysis. We tested the origins of all eight segments of six reassortant strains. Table 5 shows that for 35 of the 44 com-parisons both methods provided consistent results. In the re-maining nine instances, the results of hybridization revealed
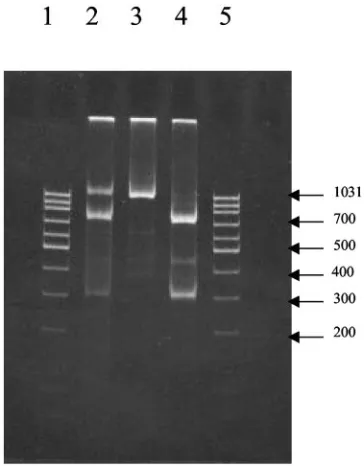
the presence of two genotypes similar to pattern D in Fig. 3 for the NS segment. To obtain an independent confirmation that more than one genotype was present in these samples and to rule out possible cross-hybridization, we used the RFLP method. The HgaI restriction enzyme is expected to cut the NS segment of the Shangdong amplicon, producing two fragments of 730 and 300 bp, but not to cut the NS segment of the Beijing amplicon. Figure 4 shows the restriction patterns for the reas-sortant strain analyzed by microarray hybridization. The pat-tern of DNA bands in Fig. 4 indicates that both Beijing and Shangdong sequences of the NS gene segment were present. The RFLP analysis suggests that the microarray hybridization multiple pattern was not the result of excessive cross-hybrid-ization but was due to the presence of a mixture of NS gene segments from the Beijing and Shangdong strains. Therefore, microarray hybridization could be more sensitive than
conven-TABLE 3. Significance of homotypic hybridizations for oligonucleotides of influenza B virus chipa
Oligonucleotide E(I) SD t F
PB2-B-643 0.935 0.188 37.3 1,284
PB2-B-625 0.886 0.169 39.2 1,342
PB2-B-591 0.895 0.177 37.9 1,225
PB1-B-929 0.811 0.235 25.8 576.7
PB1-B-823 0.803 0.249 24.1 487.9
PA-B-1979 0.864 0.244 26.5 660.9
PA-B-1954 0.708 0.388 13.6 150.8
PA-B-2034 0.886 0.206 32.1 948.8
HA-B-207 0.602 0.173 26 575.4
HA-B-253 0.864 0.148 48.8 1,647
NP-B-30 0.866 0.268 24.1 484.1
NP-B-37 0.992 0.409 18.2 326.2
NP-B-1108 0.779 0.292 20 250.7
NA-B-1051 0.923 0.193 35.7 1,141
NA-B-1108 0.995 0.186 39.9 1,566
M-B-970 0.979 0.229 32 986.1
M-B-1004 0.943 0.371 19 337.3
NS-B-304 0.98 0.135 54.2 2,809
NS-B-337 0.993 0.16 46.4 2,139
NS-B-403 0.978 0.16 45.8 2,001
PB2-S-643 0.947 0.174 40.7 1,531
PB2-S-625 0.801 0.171 35.1 936.2
PB2-S-591 0.349 0.23 11.4 73.29
PB1-S-929 0.575 0.277 15.5 187.7
PB1-S-823 0.864 0.181 35.7 1,052
PA-S-1979 0.657 0.303 16.2 206.4
PA-S-1954 0.889 0.254 26.2 601.7
PA-S-2034 0.654 0.277 17.6 261.3
HA-S-207 0.808 0.16 37.7 1,124
HA-S-253 0.996 0.12 62 3,823
NP-S-30 0.45 0.29 13.4 88.11
NP-S-37 0.68 0.533 9.54 85.12
NP-S-1108 0.657 0.329 14.4 178
NA-S-1051 0.986 0.141 52.4 2,674
NA-S-1108 0.906 0.24 28.3 714.3
M-S-970 0.937 0.241 29.1 782.5
M-S-1004 0.848 0.375 16.9 279.5
NS-S-304 0.913 0.116 59.1 3,308
NS-S-337 0.994 0.257 29 801.2
NS-S-403 0.992 0.14 53.2 2,708
a
E(I), mean value of the difference between normalized homotypic and
het-erotypic signals; SD, standard deviation of the difference;t, paired-samplettest
value; F, F statistic value (analysis of variance test). The 56 observations were from seven hybridization experiments in which eight replicates were produced.
Alltand F values are statistically significant atPvalues ranging between 0.01 and
[image:6.585.45.283.91.473.2]0.000001.
TABLE 4. Characteristics of reliability of influenza B virus chipa
Oligonucleotide No. of unlikely events pB PS
PB2-B-643 0 0.052 0.00014
PB2-B-625 0 0.052
PB2-B-591 0 0.052
PB1-B-929 0 0.052 0.027
PB1-B-823 0 0.052
PA-B-2034 0 0.052 0.00014
PA-B-1979 0 0.052
PA-B-1954 0 0.052
HA-B-207 0 0.052 0.027
HA-B-253 0 0.052
NP-B-30 0 0.052 0.00014
NP-B-37 0 0.052
NP-B-188 0 0.052
NA-B-1051 0 0.052 0.027
NA-B-1108 0 0.052
M-B-970 0 0.052 0.027
M-B-1004 0 0.052
NS-B-304 0 0.052 0.00014
NS-B-337 0 0.052
NS-B-403 0 0.052
PB2-S-643 0 0.052 0.00033
PB2-S-625 0 0.052
PB2-S-591 3 0.123
PB1-S-929 0 0.052 0.027
PB1-S-823 0 0.052
PA-S-2034 1 0.078 0.00032
PA-S-1979 1 0.078
PA-S-1954 0 0.052
HA-S-207 0 0.052 0.027
HA-S-253 0 0.052
NP-S-30 0 0.052
NP-S-37 4 0.143 0.00038
NP-S-1108 0 0.052
NA-S-1051 0 0.052 0.027
NA-S-1108 0 0.052
M-S-970 0 0.052 0.027
M-S-1004 1 0.052
NS-S-304 0 0.052 0.00014
NS-S-337 0 0.052
NS-S-403 0 0.052
aEstimations of the probability of unlikely events, e.g., of the probability of
rare false-negative hybridizations for each oligonucleotide probe and for each
segment.pBis the estimate of a maximum probability of unlikely events for a
given oligonucleotide based on all 56 replicated hybridizations.PSis the estimate
of a maximum probability of unlikely events for a given genomic segment (see the
appendix).PSis the multiplication ofpBfor a given segment.
on May 15, 2020 by guest
http://jcm.asm.org/
[image:6.585.303.541.292.675.2]tional nucleotide sequencing for detecting mixed influenza B virus genotypes.
Quantitative analysis of segment mixtures. The ability of microarray hybridization to detect the presence of mixed ge-notypes suggests that it can be used for quantitative assessment of the relative abundances of segment variants in strain mix-tures. To determine the sensitivity of the microarray for de-tection of mixed genotypes, we spiked an NS segment sample prepared from the Beijing strain (175M) with 5 and 10 or 50% of the NS segment of the Shangdong strain. Figure 5 shows that for all three NS oligoprobe pairs, the signals pro-duced by a Beijing sample spiked with 5% Shangdong DNA
significantly exceeded that with the unspiked sample. This re-sult suggests that microarray hybridization is sensitive to the presence of at least a 5% alternative genotype. However, de-spite the trend seen in Fig. 5, the difference between spikes with 5 and 10% and with 5 and 50% (not shown) was not statistically significant, meaning that quantification of genotype mixtures was unreliable. This may be due either to saturation of the probe or to a nonlinear dose-response of hybridization intensities.
DISCUSSION
Segment reassortment is an essential feature of many viral pathogens, including influenza viruses. More than one type of reassortant virus can be present simultaneously in natural pop-ulations, further complicating their analysis. Detailed genome segment mapping of virus isolates is needed to elucidate the mechanisms leading to the emergence and evolution of viral pathogens and to facilitate the creation of new protective vac-cines.
The rational design of vaccines against influenza includes the generation of reassortants between a recent field isolate and a reference strain adapted for efficient growth in the sub-strate used for vaccine production. After a variety of reassor-tant strains is generated in vitro by growing two parental strains together, a prospective vaccine strain is selected by genotyping all relevant genomic segments to identify the right combination of segments coding for immunogenic proteins and those de-termining high-growth characteristics. Traditionally, this time-critical task of selection of prospective vaccine strains has been accomplished by RFLP, sequencing of cDNA, or other ap-proaches (1, 13, 18). The recently developed high-throughput microarray analysis method appears to be ideally suited for one-step mapping of segmented viruses.
Microarray hybridization was previously used to genotype individual segments of influenza A virus (16, 22). In our work, we have developed and used an improved oligonucleotide
[image:7.585.302.542.68.237.2]mi-FIG. 4. RFLP of NS segments digested by HgaI. Lane 2, reassor-tant (the size of the band undigested by HgaI is 1,030 bp, and the sizes of the digested bands are 730 and 300 bp); lane 3, Beijing (the size of the band undigested by HgaI is 1,030 bp); lane 4, Shangdong (the sizes of the bands digested by HgaI are 730 and 300 bp); lanes 1 and 5, DNA ladders.
[image:7.585.44.284.98.226.2]FIG. 5. Hybridization of mixed samples with NS segment oligo-probes. The initial Shangdong sample (175 mM) was diluted to final concentrations of 10 and 5% in a Beijing sample (175 mM) and then hybridized with Shangdong-specific oligonucleotides. The heterotypic hybridization signal of the Beijing sample to Shangdong-specific oli-goprobes was set as the control. The hybridization was repeated five times. The error bars represent standard deviations.
TABLE 5. Comparison of sequencing and microarray methods by mapping of influenza B virus reassortants on all
influenza B virus genomic segmentsa
Reassortant Method PB2 PB1 PA HA NP NA M NS
18 Sequencing B S S B M M M S Microarray M S S B M M M M 19 Sequencing B S S B S M M S Microarray M S S B M M M M 21 Sequencing B S NA B B NA S S
Microarray B S S B B M S S 22 Sequencing B S S B B S S S Microarray B M M B B M S S 23 Sequencing NA S NA B B S S S Microarray B S S B B M S S 24 Sequencing B S S B B S S S Microarray B S S B B S S S
a
B, Beijing strain; S, Shangdong strain; M, mixed B-S genotype; NA, not applicable. For reassortant 24, the microarray hybridization pattern is presented in Fig. 3A. The boldface underlined letters indicate the inconsistent observations derived by sequencing and microarray methods.
on May 15, 2020 by guest
http://jcm.asm.org/
[image:7.585.72.254.433.666.2]croarray method to discriminate viruses with high levels of genomic homology through identification of minor genetic dif-ferences, including single-nucleotide variations, simultaneous-ly in all segments of influenza B viruses. We observed un-ambiguous discrimination between the B/Beijing/184/93 and B/Shangdong/7/97 influenza strains. These strains were dis-criminated with statistical certainty by using different oligo-probes, including PA-1979, PA-2034, NP-188, and M-1004, differing at only 1 nucleotide and representing the highly ho-mologous segments PA, NP, and M of both viruses. The high level of nucleotide homology between the PA, NP, and M segments of B/Shangdong/7/97 and B/Beijing/184/93 has been an obstacle to the genotyping of reassortants derived from the two strains by RT-PCR and RFLP because of the lack of suitable restriction sites (23).
Microarray hybridization, coupled with statistical inter-pretation of the results, allowed us to estimate the effects of cross-hybridization and to account for nonspecific sample binding (background). Our statistical analysis demonstrated high levels of sensitivity and reproducibility for all individual oligoprobes to all influenza B virus segments; P values for specific hybridization signals for all of the 40 selected oligo-probes were highly significant (P⬍0.01).
The statistical planning of the number of hybridization ex-periments developed in this work can be used in the future in the design of similar oligonucleotide microchip experiments to assess the discriminating power of individual oligoprobes and to select only those that produce the clearest results. Identifi-cation of the origin of each segment based on hybridization with two or more specific oligoprobes significantly increased the reliability of identification. To this end, we estimated the maximum probability of false-negative identification of each segment based on multiple results for individual oligoprobes in 56 hybridization experiments. The P values for segments of different origin were calculated by multiplication ofPvalues for homotypic hybridization with oligoprobes specific to each segment. They were statistically significant and demonstrated high overall discriminating power of the microarray for all eight segments of influenza B virus.
Note that our approaches for estimating the minimum number of replicate experiments and for estimating the false-negative error rate for a given gene segment seem novel for microarray genotyping. However, depending on the spe-cific designs of microarray experiments, other statistical ap-proached can also be useful (22a).
Interestingly, the influenza B virus microarray can detect the presence in mixed viral stocks of as little as 5% of a second closely related influenza B virus strain (Fig. 4). The greater ability to detect mixed viral populations is an important ad-vantage of the method over conventional methods based on nucleotide sequencing, since natural isolates often contain more than one genotype. Although the restriction pattern of DNA shown in Fig. 4 indicates that the NS segments of both the Beijing and Shangdong strains were present, similar anal-yses of other segments and other reassortant strains prepared as vaccine candidates need to be studied in the future. Our preliminary experiments presented here showed that the method could not be used to quantify the components of a mixture without further refinement. The ability to detect as little as 5% of a second strain in a mixture on one hand and the
lack of statistically significant hybridization between the values obtained for 5% and increasing spike concentrations on the other suggest that the dose-response curve may be nonlinear. There may a number of reasons for this, including saturation of immobilized probes during hybridization and nonlinear re-sponse of the fluorescence detector. Further experiments are needed to make this method more quantitative and to accu-rately assess the detection limit for mixtures.
The data presented in this paper suggest that the microarray method can be used for high-throughput screening of influenza B virus reassortants, substantially reducing the time needed for vaccine development. The influenza B virus array described in this paper contains only a few oligoprobes specific to each segment of two influenza B virus strains, Beijing and Shang-dong. The microarray method can be expanded by adding new oligoprobes, including those specific to other strains, possibly covering the entire repertoire of currently circulating influenza B virus strains. Such extension of the array might allow us to use a more quantitative assay to determine the origins of in-dividual genomic segments in a series of reassortant strains prepared as vaccine candidates or mixed virus populations.
Our preliminary analysis of the repertoire of vaccine reas-sortants suggests a highly biased (nonrandom) generation of certain segment combinations. Extensive studies of a large number of reassortant strains may help to reveal the preferred combination of segments and to examine the reason for this nonrandomness of the reassortment process.
It is known that rates of homologous recombination in neg-ative-sense RNA viruses, including influenza virus, are sub-stantially lower than their point mutation rates (24). However, patterns of sequence variations compatible with the action of recombination were recently observed in several RNA viruses, including influenza A virus and influenza B virus (3). A search for the evidence of within-segment recombination in influenza viruses could be done by a microarray method similar to the one developed to analyze recombinants in poliovirus (5).
The ability to perform rapid and comprehensive genomic analysis of multiple field isolates can help in efforts to recog-nize and respond to the emergence of new pandemic strains of influenza virus by providing a better understanding of the pro-cesses of viral evolution in populations of susceptible hosts. Similar approaches can also be developed for analysis of influ-enza A viruses and for other viruses with segmented genomes and can substantially advance our understanding of their evo-lution and help to create new effective vaccines.
ACKNOWLEDGMENTS
We thank David Asher for critical reading of the manuscript, Gen-nady Rezapkin for his helpful suggestions in planning the experiments, and Valery Pickalov for creation of a database of microarray experi-ments.
The work was supported by grants from the Defense Advanced Research Projects Agency (DARPA) and the National Vaccine Pro-gram Office (NVPO).
APPENDIX
Estimating the number of replicate experiments.To design an op-timal microarray experiment, we need to know how large a sample size
n(i.e., the number of replicate hybridizations [or experiments] for a homotypic oligoprobe) should be to give 95% confidence that⬍5% of specific hybridizations will produce false-negative results. In other
on May 15, 2020 by guest
http://jcm.asm.org/
words, we consider the question of how large the sample sizenmust be so that we can be at least 95% sure that the further use of the microarray gives false-negative values of indexI (index IA orIBin
equation 1) inⱕ5% of homotypic hybridizations.
Let us plan to draw random samplesX1,X2, . . .,Xnof then
hybrid-izations for a given homotypic oligoprobe. LetArepresent the homo-typic hybridizations showing a positive value ofI(true event). LetB represent the homotypic hybridizations showing a negative or zero value ofI(false-negative homotypic hybridization). We assume that the eventsBare rare or unlikely events. Letprepresent the probabil-ities of eventB, and let (1⫺p) represent the probability of eventA. TheseAandBevents can be considered mutually independent and identically distributed events. Let␣represent the level of significance for maximum probability of rejection of a null hypothesis, which is ascribed to a confidence probability of the eventsBafterntrue bino-mial experiments having probability (1⫺p) in each of then experi-ments. LetpBrepresent a maximum value of a probability of the event
Bfor a given oligoprobe. Then, using a binomial probability distribu-tion funcdistribu-tion BIN(0;n,pB) (11), we haveP(eventsBinntrue
homo-typic hybridizations)⫽(1⫺pB) n.
Then, assuming thatP⫽ ␣ ⫽1⫺ , we obtain:
共1⫺pB兲n⫽1⫺ (2)
and
n⫽log共1⫺兲/log共1⫺pB兲 (3)
Let␣ ⫽1⫺  ⫽1⫺0.95⫽0.05; then, using equation 3 we obtainn
⫽log0.05/log(0.95)⬇58. Thus, we expect that⬃58 replicated hybrid-ization experiments for each homotypic oligoprobe should be sufficient to get an expected reliability for the purpose of planning experiments. In actuality, we analyzed seven slides containing 56 replicates of each of the 40 distinct homotypic oligonucleotides.
Estimating the reliability of homotypic hybridizations for genomic segments.When no error is observed in all 56 of the replicated exper-iments, we can estimate the maximum probability of false-negative events (homotypic hybridizations), calledB, by equation 2:pB⫽1⫺
(1⫺ )1/n. Then,p
B⫽1⫺(1⫺0.95)
1/56⫽0.05209.
WhenI,2, . . .,k, . . . errors are found, the maximum probability of false-negative events,pB, can be estimated by the binomial probability
distribution BIN(k;n,pB) (11):
(4) P(ktimes ofBin the 56 homotypic hybridizations)⫽
冉
56k
冊
pBk共1⫺pB兲56⫺kWe can estimatepB(k⫽0)⫽0.05209;pB(k⫽1)⫽0.0781;pB(k⫽
2)⫽0.104;pB(k⫽3)⫽0.1432;pB(k⫽4)⫽0.1532;pB(k⫽5)⫽
0.1829 fork⫽0, 1, 2, 3, 4, 5, which have been observed in all slides. We selected from two to four homotypic oligoprobes for each of the eight genomic segments to use in hybridization experiments. Let
pB1,pB2, . . . represent the observed frequencies of false-negative
eventsB1,B2, . . .associated with homotypic hybridization on the
first, second, etc. distinct oligoprobes representing a given genome segment. Analysis of hybridization with two or more distinct oligo-probes covering a given segment in the same microarray experiment allowed us to increase the reliability of genomic-segment identifi-cation by estimating the joint probability function of false-negative events for a given genomic segment by the formulaPs⫽pB1pB2. . . .
For example, when two oligoprobes used for the identification of a given segment hadpB1⫽0.0781 andpB2⫽0.0108, respectively, the
maximum probability of false-negative identification of the given segment was estimated to bePs⫽pB1pB2⫽0.0079.
REFERENCES
1.Cha, T. A., J. Zhao, E. Lane, M. A. Murray, and D. S. Stec.1997. Determi-nation of the genome composition of influenza virus reassortants using
multiplex reverse transcription-polymerase chain reaction followed by fluo-rescent single-strand conformation polymorphism analysis. Anal. Biochem.
252:24–32.
2.Chanock, R. M., and B. R. Murphy.1980. Use of temperature-sensitive and cold-adapted mutant viruses in immunoprophylaxis of acute respiratory tract
disease. Rev. Infect. Dis.2:421–432.
3.Chare, E. R., E. A. Gould, and E. C. Holmes.2003. Phylogenetic analysis reveals a low rate of homologous recombination in negative-sense RNA
viruses. J. Gen. Virol.84:2691–2703.
4.Chen, H., Y. Matsuoka, D. Swayne, Q. Chen, N. J. Cox, B. R. Murphy, and K. Subbarao.2003. Generation and characterization of a cold-adapted in-fluenza A H9N2 reassortant as a live pandemic inin-fluenza virus vaccine
candidate. Vaccine21:4430–4436.
5.Cherkasova, E., M. Laassri, V. Chizhikov, E. Korotkova, E. Dragunsky, V. I. Agol, and K. Chumakov.2003. Microarray analysis of evolution of RNA viruses: new evidence of circulation of virulent highly divergent
vaccine-derived polioviruses. Proc. Natl. Acad. Sci. USA100:9398–9403.
6.Chetverin, A. B., and F. R. Kramer.1993. Sequencing of pools of nucleic
acids on oligonucleotide arrays. Biosystems30:215–231.
7.Chizhikov, V., A. Rasooly, K. Chumakov, and D. D. Levy.2001. Microarray
analysis of microbial virulence factors. Appl. Environ. Microbiol.67:3258–
3263.
8.Chizhikov, V., M. Wagner, A. Ivshina, Y. Hoshino, A. Z. Kapikian, and K. Chumakov.2002. Detection and genotyping of human group a rotaviruses by
oligonucleotide microarray hybridization. J. Clin. Microbiol.40:2398–2407.
9.Hacia, J. G.1999. Resequencing and mutational analysis using
oligonucle-otide microarrays. Nat. Genet.21:42–47.
10.Hacia, J. G., J. B. Fan, O. Ryder, L. Jin, K. Edgemon, G. Ghandour, R. A. Mayer, B. Sun, L. Hsie, C. M. Robbins, L. C. Brody, D. Wang, E. S. Lander, R. Lipshutz, S. P. Fodor, and F. S. Collins.1999. Determination of ancestral alleles for human single-nucleotide polymorphisms using high-density
oligo-nucleotide arrays. Nat. Genet.22:164–167.
11.Johnson, N. L., S. Kotz, and A. W. Kemp.1993. Univariative discrete dis-tributions, 2nd ed. John Wiley and Sons, Inc., New York, N.Y.
12.Khrapko, K. R., P. Y. Lysov, A. A. Khorlyn, V. V. Shick, V. L. Florentiev, and A. D. Mirzabekov.1989. An oligonucleotide hybridization approach to DNA
sequencing. FEBS Lett.256:118–122.
13.Klimov, A. I., and N. J. Cox. 1995. PCR restriction analysis of genome composition and stability of cold-adapted reassortant live influenza vaccines.
J. Virol. Methods52:41–49.
14.Laassri, M., V. Chizhikov, M. Mikheev, S. Shchelkunov, and K. Chumakov.
2003. Detection and discrimination of orthopoxviruses using microarrays of
immobilized oligonucleotides. J. Virol. Methods112:67–78.
15.Lamb, R. A., and R. M. Krug.2001. Orthomixoviridae: the viruses and their
replication, p. 1488–1524.InD. M. Knipe and P. M. Howley (ed.), Field’s
virology, 4th ed. Lippincott, Williams, and Wilkins, Philadelphia, Pa. 16.Li, J., S. Chen, and D. H. Evans.2001. Typing and subtyping influenza virus
using DNA microarrays and multiplex reverse transcriptase PCR. J. Clin.
Microbiol.39:696-704.
17.McCullers, J. A., G. C. Wang, S. He, and R. G. Webster.1999. Reassortment and insertion-deletion are strategies for the evolution of influenza B viruses
in nature. J. Virol.73:7343-7348.
18.Offringa, D. P., V. Tyson-Medlock, Z. Ye, and R. A. Levandowski.2000. A comprehensive systematic approach to identification of influenza A virus
genotype using RT-PCR and RFLP. J. Virol. Methods88:15-24.
19.Palese, P.1977. The genes of influenza virus. Cell10:1-10.
20.Proudnikov, D., E. Kirillov, K. Chumakov, J. Donlon, G. Rezapkin, and A. Mirzabekov.2000. Analysis of mutations in oral poliovirus vaccine by
hy-bridization with generic oligonucleotide microchips. Biologicals28:57-66.
21.Richman, D. D., B. R. Murphy, R. B. Belshe, H. M. Rusten, R. M. Chanock, N. R. Blacklow, T. A. Parrino, F. B. Rose, M. M. Levine, and E. Caplan.1977. Temperature-sensitive mutants of influenza A virus. XIV. Production and evaluation of influenza A/Georgia/74-ts-1[E] recombinant viruses in human
adults. J. Infect. Dis.136:256-262.
22.Sengupta, S., K. Onodera, A. Lai, and U. Melcher.2003. Molecular detection and identification of influenza viruses by oligonucleotide microarray
hybrid-ization. J. Clin. Microbiol.41:4542-4550.
22a.Simon, R.2003. Diagnostic and prognostic prediction using gene expression
profiles in high-dimensional microarray data. Br. J. Cancer89:1599–1604.
23.Vodeiko, G. M., J. McInnis, V. Chizhikov, and R. A. Levandowski.2003. Genetic and phenotypic analysis of reassortants of high growth and low
growth strains of influenza B virus. Vaccine21:3867–3874.
24.Worobey, M., A. Rambaut, O. G. Pybus, and D. L. Robertson.2002. Ques-tioning the evidence for genetic recombination in the 1918 “Spanish flu”
virus. Science296:211.