Journal of Chemical and Pharmaceutical Research, 2014, 6(2):170-177
Research Article
CODEN(USA) : JCPRC5
ISSN : 0975-7384
A novel evaluation approach to user psychological experience performance
based on ELECTRE method
Gao-Ming DU
Psychology of Education, Neijiang Normal University, Neijiang, P. R. China
_____________________________________________________________________________________________ ABSTRACT
The research to user psychological experience performance has an important theoretical significance. For this reason, a novel evaluation approach is proposed to the user psychological experience performance based on the ELECTRE method. The experimental results suggest that this approach is feasible, correct and valid.
Key words: Evaluation Approach, ELECTRE Method, Experience Performance
_____________________________________________________________________________________________ INTRODUCTION
The rapid development of information, computer science and technology as well as knowledge-based economy has forced the implementation of experience economy [1]. User experience is a kind of holistic subjective psychological feelings formed when users accept service [2-3]. Researchers in several fields such as computer science, psychology and sociology have made researches on user experience from their own perspectives and application backgrounds. When users are served, various factors in users themselves, computer application systems and current objective environment will all affect the quality of user experience. Most of the current study on user experience focuses on computer application systems rarely considers users’ own psychology and cognition and cannot improve user experience from their mind and psychology, which is a question in need of deep exploration.
Researchers in psychology, sociology and computer science have made qualitative and quantitative analysis on factors influencing the quality of user experience from different focuses. In the qualitative aspect, some researchers think that macro factors can be classified from such aspects as surface, framework, structure, range and strategy, and micro factors mainly include organization, reconstruction and expression of service contents. In the quantitative aspect, researchers proposed some quantitative indexes to measure user experience. For example, Jim Lewis designed CSUQ and PSSUQ [4-5]. CSUQ is aimed at e-mail or on-line tests and PSSUQ is aimed at face-to-face tests. These two questionnaires are mainly used to analyze system effectiveness, information quality, interface quality and overall satisfaction [6]. Arnie Lund designed usefulness, satisfaction and ease questionnaires (USE) containing thirty rated items and four features such as usefulness, satisfaction, ease and learnability.
The integrated research result shows that, factors influencing user experience quality include the following aspects. Usability which can be further divided into response rate, easy to learn, easy to navigate, simple operation, consistent operation and visual appeal. Usefulness is further divided into meeting user demand, improving user working efficiency and creating value for users. Other factors such as ones aimed at users’ characteristics, individual information data and emotion etc.
EVALUATION INDEX SYSTEMS
There are several factors influencing user experience and the most important are usefulness and usability.
(1) Usefulness, also called effectiveness, refers to whether the service contents systems provide and recommend are useful or not. It is featured with:
1) Resource coverage, namely the coverage rate of the resource that systems provide on the knowledge domain that users should learn.
2) Hit ratio of recommendation. The hit ratio is defined as the ratio between the hit count and the recommendation count during users’ one login process. Users have learnt the content recommended by systems, and if the evaluation score on the content is bigger than the corresponding threshold value, it is called a recommendation hit. If the overall count that systems recommend contents to users is
n
rand the total count of recommendation hits isn
s, then the hit ratio of recommendation is the ratio between the hit count and recommendation count.s H
r
n
R
n
=
(1)
3) User loyalty. It is defined as the willingness that user uses the system once again and can be measured by calculating the frequency of user’s visit. According to the standard time number
N
defined based on experts’ experience, if the user uses the systemn
utimes each week, the user loyalty is1,
,
uu u
n
N
L
n
n
N
N
≥
=
<
(2)
(2) Usability. It refers to whether the operation, learning, navigation and use that the user should grasp during the system service accord with user’s habits. Usability of e-learning system owns following features.
1) Response rate. The time interval between user’s service request and service provision of the system is defined as response time. It can be obtained through analyzing system log data and the response rate can be obtained through calculating response time:
1, (
)
, (
)
re tsRS ts
re ts re
t
t
t
t
t
t
t
<
=
>
(3)
In which,
t
reis the response time, namely the time that user login spends, andt
tsis the standard response time.2) Navigation definition. During the use of the system, the ratio between the number of visited target knowledge and that of all the target knowledge is the navigation definition. It is defined as:
C
=
N
N
M
(4)
In which,
M
is the number of knowledge items visited by the user when he/she has completed the task successfully andN
is the number of knowledge items successfully grasped by the user. If the user finds the target knowledge directly, navigation definition is 100%. If the user cannot find the target knowledge, it is 0%. Thus it can be seen that, the smallerM
is, the better the system navigation performance is, and users can easily find desired knowledge items.3) Task-performing efficiency. During the use of the system, the ratio between the total time spent in learning target knowledge and that spent in using the system is task-performing efficiency.
T
is one learning task for users designed in the e-learning system and users should learn one or more knowledge items, and then the task-performing efficiency isT
=
ek,
ken
t
E
e
E
t
∈
∑
∑
(5)
Here,
t
ekis the learning time, namely the time interval between the click on the thon the next one, also the time spent in learning knowledge item
e
k.t
enis the time spent in successfully learning then
thknowledge item ofN
ones.E
is the set of target knowledge items, namely the set of knowledge items users should learn during one learning task,E
=
{
e e
1,
2
}
.The login time is
t
in. The task starting time, namely the time when the system completed loading and starts to present knowledge, ist
s. The time interval from system login to the moment when the system is loaded is the response timet
re.t
re= −
t
st
in(6)
E-learning system provides users learning resources with knowledge items. The least time users spend in learning target knowledge items is the least time duration. If one user’s learning time has not reached this least time duration, the user is considered to have not completed the corresponding learning task. Least time durations corresponding to knowledge items
e e
1,
2,
ist
e1,
t
e2,
which is defined by expert teachers or depends on the average learning time duration among user populations.If the time duration
t
ekone user spends in learning knowledge iteme
kis bigger than the corresponding least time durationt
ekmand the user thinks he/she has successfully grasped the knowledge, namely that the learning for knowledge iteme
khas been completed, the successful learning completion function is valued with 1, otherwise it is 0. The corresponding expression is1, (
)
0, (
)
ek ekm ek
ek ekm
t
t
S
t
t
≥
=
≤
(7)
If one user thinks he/she has completed the current learning task when he/she has successfully learned
N
knowledge items ofE
, the successful task completion function is valued with 1, otherwise it is 0. The corresponding expression is1,
,
0,
,
ek
ek k
S
ek k
S
N e
E
T
S
N e
E
≥
∈
=
<
∈
∑
∑
(8)
The time interval from the moment that the task is successfully loaded to the moment of task completion is the task time, namely
T
t=
∑
T
en(9)
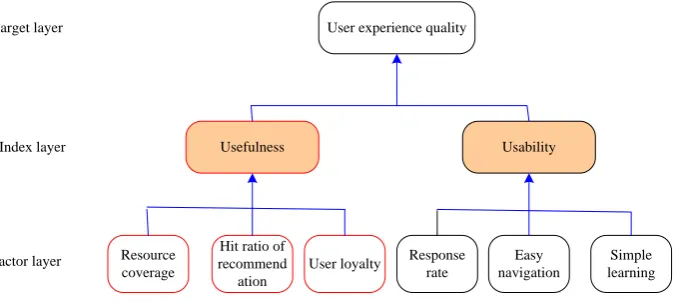
(3) Evaluation Index System. E-learning user psychological experience is a kind of holistic subjective psychological feelings formed when users use the system for learning. According to the analysis of this section, the overall user experience quality is featured with usefulness and usability which can be further divided. The hierarchical structure of features of the e-learning user psychological experience quality is shown in Figure 1.
Target layer
Index layer
Factor layer
User experience quality
Usefulness Usability
Resource coverage
Hit ratio of recommend
ation
User loyalty Response rate
Easy navigation
[image:3.595.147.485.582.733.2]Simple learning
THE PROPOSED APPROACH
To ensure the clarity and universality of the evaluation, Cj (j=1, 2,…,m) are supposed to be benefit attributes. pj, qj
and vj respectively represent the seriously superior threshold, no difference threshold and the veto threshold between
solutions in Cj. As to the first threshold, ai is considered to be strictly better than ak if pj is smaller than the difference
between ai and ak according to Cj. As to the second threshold, no difference exists between ai and ak if qj is bigger
than the difference between ai and ak according to Cj. And as to the last threshold, the overall level of ai is vetoed to
be better than ak if vj is no bigger than the difference between ak and ai according to Cj (ak is bigger than ai).
Therefore, 0≤qj≤pj≤vj.
(1) Definitions of Three Indexes
1) Concordance index, represented with c(ai, ak), refers to the supporting degree for the inference “the level of ai is
higher than that of ak”. It can be defined as
1
1
( ,
)
( ,
)
m
i k j j i k
j
c a a
w c a a
w
==
∑
(10)In which 1 m j j
w
w
==
∑
(11)
0,
( )+
(
)
( ,
)
1,
( )+
(
)
( )
(
)
,
j i j j k
j i k j i j j k
j i j j k
j j
if y a
p
y a
c a a
if y a
q
y a
y a
p
y a
other
p
q
≤
=
≥
+
−
−
(12)
The index cj(ai, ak) refers to the superiority degree of ai compared with ak as to attribute Cj.
2) Discordance index, represented with dj(ai, ak), refers to the denying degree for the inference “the level of ai is
higher than that of ak”. It can be defined as
0,
( )+
(
)
( ,
)
1,
( )+
(
)
(
)
( )
,
j i j j k
j i k j i j j k
j k j i j
j j
if y a
p
y a
d a a
if y a
v
y a
y a
y a
p
other
v
p
≥
=
≤
−
−
−
(13)
3) Reliability index, represented with s(ai, ak), refers to the credibility for the inference “the level of ai is higher than
that of ak”. It can be defined as
( ,
),
,
( ,
)
( ,
)
1
( ,
)
( ,
)
( ,
)
,
,
( ,
)> ( ,
)
1
( ,
)
j
i k j j i k i k
j i k i k
i k j j i k i k
c i k
c a a
if
C d a a
c a a
d a a
s a a
c a a
if
C d a a
c a a
c a a
∀
≤
−
=
×
∀
−
∏
(14)
(2) Construct Preference Matrix Based on Qualitative Evaluation. Usually, different decision-makers assess problems from different angles and own different preferences, so they often adopt different measures and standards to make decisions. After sorting alternatives through the ELECTRE-III method, we cannot integrate single decision-making results to generate the group result solely through the average method or Borda method, because it is unrealistic. Therefore, a new method should be proposed in which different measures and standards can be reflected during the group ranking process. These measures and standards are closely related with the ranking order of alternatives and the value of reliability indexes, so we should study the following two problems at the same time: 1) Differences between alternatives when reliability indexes are respectively s (ak, ai) and s (ai, ak). 2) The ranking
order of the alternative when the reliability index is s (ai, ak).
SupposeΔQl(ai, ak)represents the ranking order of the alternative as to the reliability index s(ai, ak) and Ql(ai) refers
to the ranking order of ai made by the lthperson. If there are m alternatives for ranking and the lth person considers
that ai is the best one, then Ql(ai)=1. If ai is considered to be the worst one, then Ql(ai)=m. The relative difference
between the ranking order of ai and that of other alternatives
( ,
)
l i k
Q a a
( )
(
),
(
)
( )
2
( )
(
),
<
(
)
( )
2
( ,
)
( )
(
),
(
)
( )=0
( )
(
),
<
( )
(
)
2
( )
(
),
( )
(
)
2
l i l k l k l i
l i l k l k l i
l i k l i l k l k l i
l i l k l i l k
l i l k l i l k
n
Q a
Q a
if Q a
Q a
n
Q a
Q a
if
Q a
Q a
Q a a
Q a
Q a
if Q a
Q a
n
Q a
Q a
if
Q a
Q a
n
Q a
Q a
if Q a
Q a
>>
−
>
>
−
≤
∆
=
=
−
<
−
≤
<<
−
>
0
0
In which,
Q a
l( )
i>>
Q a
l(
k)
refers to that the alternative ai is far better than ak according to the lth person,( )
(
)
l i l k
Q a
>
Q a
refers to that the alternative ai is a little better than ak according to the lth person,( )
(
)
l i l k
Q a
=
Q a
refers to that the alternative ai is similar to ak according to the lth person,Q a
l( )
i<
Q a
l(
k)
refers to that the alternative ai is a little worse than ak according to the lthperson andQ a
l( )
i<<
Q a
l(
k)
refers to that the alternative ai is far worse than ak.In traditional ELECTRE-III method, when the superior sequence of all alternatives should be determined, the outrnaking relation exists only when s(ai, ak) ≥λmax- β in which max
,
max ( ,
)
i k
i k a a A
s a a
λ
∈
=
, β is the capture threshold and its value is set by decision-makers according to their own experience. Among all outranking relations, the quality of alternative ai depends on the difference between the numuber of its flow-out directed arcs and that offlow-in directed arcs. Therefore, the relative zone between the reliability indexes sl(ai, ak) and sl(ak, ai) as to each
pair of alternatives can be defined as:
Zone
Ⅰ
:
s a a
l( ,
i k)
≥
λ
max−
β
,
s a a
l(
k, )
i≥
λ
max−
β
Zone
Ⅱ
:
s a a
l( ,
i k)
≥
λ
max−
β
,
s a a
l(
k, )
i<
λ
max−
β
Zone
Ⅲ
:
s a a
l( ,
i k)
<
λ
max−
β
,
s a a
l(
k, )
i≥
λ
max−
β
Zone
Ⅳ
:
s a a
l( ,
i k)
<
λ
max−
β
,
s a a
l(
k, )
i<
λ
max−
β
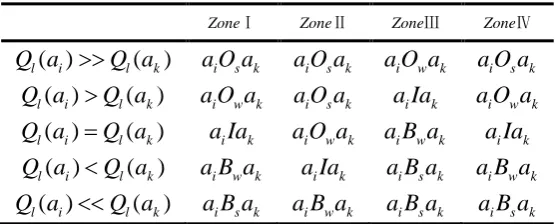
2) Construct the preference evaluation matrix (shown in Table 1). It is a matrix used to evaluate the superior sequence of alternative ai and ak based on the given relative sequence location
( ,
)
l i k
Q a a
∆
of (ai, ak) and the [image:5.595.167.445.536.648.2]relative zone between reliability indexes sl(ai, ak) and sl(ak, ai).
Table 1 Preference Evaluation Matrix
ZoneⅠ ZoneⅡ ZoneⅢ ZoneⅣ
( )
(
)
l i l k
Q a
>>
Q a
a O a
i s ka O a
i s ka O a
i w ka O a
i s k( )
(
)
l i l k
Q a
>
Q a
a O a
i w ka O a
i s ka Ia
i ka O a
i w k( )
(
)
l i l k
Q a
=
Q a
a Ia
i ka O a
i w ka B a
i w ka Ia
i k( )
(
)
l i l k
Q a
<
Q a
a B a
i w ka Ia
i ka B a
i s ka B a
i w k( )
(
)
l i l k
Q a
<<
Q a
a B a
i s ka B a
i w ka B a
i s ka B a
i s kIn which,
a O a
i s krefers to that alternative ai is far better than (O
s) ak,a O a
i w krefers to that alternative ai is a littlebetter than (
O
w) ak,a Ia
i krefers to that there is no difference between alternative ai and ak (I),a B a
i w krefers to that alternative ai is a little worse than (B
w) ak anda B a
i s krefers to that alternative ai is far worse than (B
s) ak.1) Consistent reliability
Φ
+( )
a
i refers to the superior degree of alternative ai, defined as:( )
( ,
),
k
i i k k
a A
a
s a a
a
A
+
∈
Φ
=
∑
∀ ∈
(15)
2) Inconsistent reliability refers to the superior degree of other alternatives as to ai, defined as:
( )
(
, ),
k
i k i k
a A
a
s a a
a
A
−
∈
Φ
=
∑
∀ ∈
(16)
3) Net reliability
Φ
( )
a
i is the difference between the consistent reliability and inconsistent reliability, defined as:Φ
( )
a
i= Φ
+( )
a
i− Φ
−( )
a
i(17)
Quality of all alternatives can be ranked in certain order according to the value of net reliability
Φ
( )
a
i . Generally speaking, the bigger the value of net reliabilityΦ
( )
a
i is, the better the corresponding alternative is.(4) Construct the group outranking relationship
1) Group concordance index CG(ai, ak) refers to the reliability that the inference “alternative ai is better than ak” is
supported from the angle of groups. It can be defined as:
1
( ,
)
( ,
)
m
G i k l l i k
l
C
a a
v f a a
==
∑
(18)
In which
1,
0.75,
( ,
)
0.5,
0.25,
0,
i s k i w k
l i k i k
i w k i s k
if a O a
if a O a
f a a
if a Ia
if a B a
if a B a
=
(19)
2) Group discordance index DG(ai, ak) refers to the reliability that the inference “alternative ai is better than ak” is
denied from the angle of groups. It can be defined as:
1
( ,
)
( ,
)
m
G i k l l i k
l
D a a
v g a a
==
∑
(20)
In which
( ,
)
{
1,
,
( )
(
)
0,
i w k i s k l i l kl i k
if a B a or a B a
Q a
Q a
g a a
others
<<
=
且
(21)
3) Group reliability index SG(ai, ak) refers to the reliability of the inference “alternative ai is better than ak” and can
be defined as:
S
G( ,
a a
i k)
=
C
G( ,
a a
i k) (1
⋅ −
D a a
G( ,
i k))
(22)
(5) Ranking of group decision-making
1) Group consistent reliability
Φ
G+( )
a
i refers to the reliability that alternative ai is better than others from the angleof groups and can be defined as:
1
( )
( ,
)
n
G i G i k
k
a
S
a a
+
=
Φ
=
∑
(23)
2) Group inconsistent reliability G
( )
a
i −Φ
refers to the reliability that other alternatives are better than ai from the angle of groups and can be defined as:1
( )
(
,
)
n
G i G k i
k
a
S
a a
−
=
Φ
=
∑
(24)
3) Group net reliability
Φ
G( )
a
i refers to the difference betweenΦ
G+( )
a
i andΦ
G−( )
a
i and can be defined as:Φ
G( )
a
i= Φ
G+( )
a
i− Φ
G−( )
a
i(25)
RESULTS
Usually, pairwise comparison is adopted to decide the feature weights, namely obtaining features with high weights through comparing any two features those are attached to some index. Scale like 1~9 is used for measurement during the comparison. Weight judgment matrix of features can be obtained only through experts’ experience, but different experts own different views, so consistency check should be made on the matrix.
As to usefulness indexes, the feature vector is
W
=
(0.38, 0.15, 0.92)
, and after normalization it turns toW
=
(0.26, 0.10, 0.64)
of which the values are respectively corresponding to such relative weights as resource coverage, hit ratio of recommendation and user loyalty. As to usability indexes, the feature vector obtained through normalizing the feature vector isW
=
(0.10, 0.64, 0.26)
of which the values are respectively corresponding to such relative weights as response rate, navigation definition and task-performing efficiency.Total ranking weight refers to the relative weight of all elements in each layer as to the total target in the hierarchical structure. It is indicated that the consistency passes the test and the relative weight
W
=
(0.75, 0.25)
.The approach mentioned in this paper is used to make an analysis on the user psychological experience in e-learning system used in junior classes in a Chinese university. 110 learners are selected stochastically. The learning task required in the experiment is to learn circuit switching and packet switching in e-learning system.
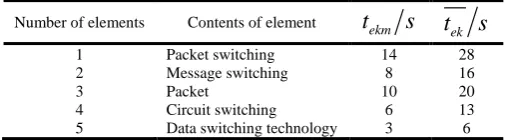
[image:7.595.179.432.398.468.2]The total target knowledge item set that needs learning is
E
= [packet switching, message switching, packet, circuit switching, data switching technology]. Suppose that the least time duration learners spend in learning some target knowledge item is equal to half of the average time the learner population spends in learning this item, shown in Table 2.Table 2 The least time learners spend in learning target knowledge items
Number of elements Contents of element
t
ekms
ek
t
s
1 Packet switching 14 28 2 Message switching 8 16
3 Packet 10 20
4 Circuit switching 6 13 5 Data switching technology 3 6
According to experts’ experience, it is considered that the learning task is completed when learners have grasped three knowledge items of
E
. The standard times of loyalty is 2, namely the times learners use e-learning system each week. The standard response time is 10 seconds.The analytic hierarchy process in section 2.3 is used to build the total quantitative evaluation model of e-learning user psychological experience, constructing user psychological experience quality from two features and indexes like usefulness and usability and then obtaining the total ranking weight vector
(0.1937, 0.0785, 0.4778, 0.0262, 0.1593, 0.0646)
W
=
of six child features such as resource coverage, hitratio of recommendation, user loyalty, response time, navigation definition and task-performing efficiency.
The focus of the experiment is to study and analyze child indexes like user loyalty, response rate, navigation definition and task-performing efficiency as well as the total index of the whole user psychological experience. The average value is 31%, indicating that, as to learners, the attraction of this system is weaker and fewer users will continue using it for learning.
The response time ranges from 10 seconds to 70 seconds due to the influence of internet environment and the average response rate is 44%. The fact that the system response rate as to 25% users is 0% indicates that users close the system when waiting for the system response and as a result, no response time is obtained.
The average value of navigation is 11%. It shows that the value is 0% as to 51% users, namely 51% users can hardly find required knowledge items when using this system.
The highest value for experience quality is 62%, the lowest 27% and the average value 38%, indicating that the user psychological experience quality in this e-learning system remains to be further improved.
CONCLUSION
This paper has made a research and analysis on such aspects as feature selection, feature quantification measurement and the quantification evaluation modeling of total user psychological experience that influence e-learning user psychological experience quality. The research focus lies on features and factors of usefulness and usability. Further researches will be made on the influence of other factors, like emotions etc., on the user psychological experience quality, so as to build more integrated quantification evaluation approaches of user psychological experience.
REFERENCES
[1]Lin C; Hu J; Kong XZ, Chinese Journa., 2012, 35(1), 1-15 [2]Hu CP; Deng SL, J. INTELL., 2006, 24(3), 321-325
[3]L Dudek, ACM Trans. Comput. Hum. Interact., 2006, 18(1), 1-30 [4]Li XQ, J. INTELL., 2010, 28(5), 763-767
[5]Pang QH, Computer Engineering, 2007, 33(18), 59-61