Usability Recommendations for an Academic
Website: A Case Study
D.P.Jayathunga*, J.M.D.R. Jayawardana**,S.T.C.I. Wimaladharma*,H.M.U.M. Herath*
*
Department of Computer Science and Technology, Uva Wellassa University of Sri Lanka **
Department of Animal Science, Uva Wellassa University of Sri Lanka
Abstract- With the advent of the Internet, most of the academic institutions in the world are providing up-to-date information over their official websites. Nowadays it has been more concerned that the importance of the presence of information through websites to the public. Since web-based information sharing has become more popular and effective, it is required to focus on the usability of a website from the user’s viewpoint. The main objective of the study was to evaluate the usability of the official website of Uva Wellassa University of Sri Lanka under four main dimensions which are website content and organization , website navigation and links, user interface design and website performance. The questionnaire was designed and developed based on twenty usability criteria that are belong to the above four categories. A descriptive survey conducted and simple random sampling strategy employed to collect data from 194 undergraduates who have the domain knowledge about the usability of a website. The each category has a selected predictor that used to find the correlation between other four factors by using ordinal logistic regression model. The results exhibited a strong correlation between the content and organization of the website. The analysis of the results further justified that there is no significant relationship between the navigation and the composition of the links/menus of the website. But result shows it is important to consider ease of move forward/backward, usefulness of links and prevention of pop-ups and new browser windows. The negative correlation between the interface design and the attractiveness of the website implied the less importance of its design while highlighting the importance of the learnability and use of comfortable colors in interfaces. It is vital to consider the loading time of the web pages and the availability of the website to ensure the reliability of the information. As a conclusion, the overall design and the navigation of the current website is in an acceptable level while the content and the organization of the website needs to improve in order to make users more comfortable in accessing the university website. Therefore, it can be recommended that improving the factors such as content, organization, and readability of a website will significantly affect to the usability of it.
Index Terms- usability evaluation, educational websites, usability factors, website usability, HCI
I. INTRODUCTION
herapid development of Information and Communication Technology (ICT) has changed the way people look at the world. Moreover, the globalization of workflows of most of the organizations is benefitted from the advancement of communication technology. Therefore, different areas such as Business, Governance, Healthcare, Engineering, Agriculture and Education have a significant influence of ICT. Computers, the Internet, and electronic delivery systems such as radios, televisions, and projectors are widely used in ICT [1]. Further, the use of different devices such as smartphones and tablet computers is increasing rapidly with respect to the technology.
On top of every other ICT tools and techniques, the Internet plays a premier role by providing a solid infrastructure to connect billions of people and devices all over the world in a second. One of the most popular services of the Web of Documents (WDOC) is World Wide Web (WWW). With the invention of WWW, and the advancement of information sharing, the dominance of internet usage has rapidly grown in the academia as well [2]. Thus, the usage of website has become the most popular method of sharing information over the Internet. Since the number of websites and the users are increasing day-by-day, the necessity of improving the usability of websites has become more important in order to fulfill the users’ expectation.
Thus, the necessity of examining and evaluating the usability of university websites became more important. The aim of this study is to evaluate the factors influencing the usability of Uva Wellassa university website using user-based method in which the users are having the domain knowledge in technical and theoretical.
The objectives of the study are to:
1. Evaluation the Uva Wellassa University website (http://www.uwu.ac.lk) for usability factors using the users who are having the technical and theoretical knowledge about the Human-Computer Interaction.
2. Identify the main areas that are affecting for the usability of a university website from students point of view and identify the usability issues of the existing website of Uva Wellassa University of Sri Lanka.
II. RELATED WORK
This section includes some found literature which covers website usability of academic institutions. “Usability is a quality attribute that assesses how easy user interfaces are to use”. The word "usability" also refers to methods for improving ease-of-use during the design process”. Website usability is identified with five quality components named as Learnability, Efficiency, Memorability, Errors and Satisfaction [3]. Several evaluation methods have been identified to assess the usability of websites under the categories of user testing methods, tool based testing methods and evaluator based testing methods [5].
In 2015, a usability evaluation research conducted by a group [6] has implied the user based testing method to assess the usability of educational websites. They have given a questionnaire which was arranged based on their developed heuristic guidelines document, to undergraduates in King Abdul Aziz university of Saudi Arabia. The purpose of this research was to figure out the usability issues in an educational website using King Abdul Aziz university website as their case study. From the evaluation results, they have identified some issues such in navigation, design, and content of the websites.
Similarly, in 2012 another research conducted by Layla Hasan [5] developed evaluation criteria and conducted a rating survey to obtain the ratings for nine Jordanian University websites based on various categories of the developed usability criteria such as navigation, organization, ease of use, design, and content of the websites. The aim of this research was to investigate the usability of educational websites in Jordanian using user based method. Two hundred thirty-seven students were requested to give ratings for each nine selected university websites of Jordan. The results showed that the majority of the students was satisfied with the usability of each given university websites specifically with the content and navigation, but they were dissatisfied with the design of the websites.
Samsur Rahman and Zabed Ahmed have done a study in 2013 [4] to assess the usability of the Dhaka University website of Bangladesh based on university student preferences. They have gathered information from Dhaka University students by giving a specific questionnaire which they have developed. After the analyzing of these data, Rahman and Ahmed have found that the most students were not satisfied with the Dhaka university website. Moreover, they have determined the factors which caused the usability issues of the website such as lack of content and updates of the information.
Mustafa and Al-Zoua'bi have applied two methods [7] namely user based method and tool-based methods for their research in 2008, to identify the usability problems in Jordan's university websites. They have used two online automated tools called html toolbox and web page analyze along with a questionnaire which was given to websites' users. In this research, they have used the above-mentioned tools to measure the internal attribute of the websites such as html code errors while questionnaire was used to measure the user satisfaction.
Though user based method and tool based method are the most widely used methods to evaluate the usability of websites, some research studies have been conducted using evaluator methods as well. For example, in 2013 Alotaibi has used an evaluator method named Heuristic Evaluation (HE) to assess twelve Saudi Arabian university websites [8]. Results of this research revealed that even though the selected universities maintain an acceptable level of quality usability practices, private university websites has 5% of lower level usability compared to government universities.
Even there are many methods to evaluate the usability of websites, there were some few research studies were conducted to assess the usability of academic websites. This literature summarized that there is a lack of researches concerning to the evaluation of the usability of academic websites of Sri Lanka. Hence the assessing the usability of academic websites have become more important aspect today, this research was conducted to determine the factors which can use to enhance the usability of academic websites of Sri Lanka, using Uva Wellassa University of Sri Lanka website as a case study:
III. METHODOLOGY
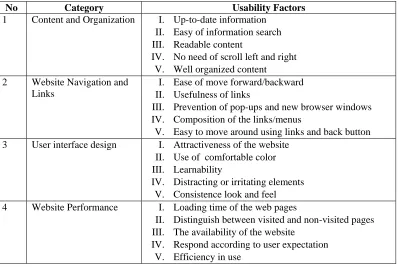
[image:3.612.104.503.128.395.2]In order to collect the data, a survey questionnaire was designed and developed based on twenty usability factors under four different identified usability categories [9] [7] as shown in Table 1.
Table 1: Usability Category and factors
No Category Usability Factors
1 Content and Organization I. Up-to-date information II. Easy of information search III. Readable content
IV. No need of scroll left and right V. Well organized content 2 Website Navigation and
Links
I. Ease of move forward/backward II. Usefulness of links
III. Prevention of pop-ups and new browser windows IV. Composition of the links/menus
V. Easy to move around using links and back button 3 User interface design I. Attractiveness of the website
II. Use of comfortable color III. Learnability
IV. Distracting or irritating elements V. Consistence look and feel 4 Website Performance I. Loading time of the web pages
II. Distinguish between visited and non-visited pages III. The availability of the website
IV. Respond according to user expectation V. Efficiency in use
The survey questionnaire consists of 25 categorical questions which enables a better understanding and an insightful interpretation of the results from the study. The survey was conducted within six weeks of time period and the population of the research survey was the undergraduates who have the knowledge in website usability and currently in second and third level of study years attached to the Department of Computer Science and Technology of Uva Wellassa University. The simple random sampling technique was adapted to collect the data from the responses and the sample size was 194 students.
In order to analyze the collected data, the basic descriptive statistical analysis and confirmatory statistical analysis were performed using Minitab software. There is a selected predictor in each category as used to find correlation with other four each category questions and measure the usability of the category. The ordinal logistic regression model was fitted for each usability category since the outcome results of the survey were ordered categorical scale data. Thus, interpreted result can use to determine the respondents’ interested main area of the website which needs to be more concern in improving and suggesting the further development of the website.
The Chi-squared test and Goodness of fit tests were used to identify the statistical significance of the fitted model and model is either well fitted to the data or not. Further using the Chi-squared test the null hypothesis (H0) was tested as all the coefficients associated with the predictor variables are equal to zero and alternative hypothesis(H1) that at least one coefficient is not equal to zero. The Goodness-of-fit test was used to identify whether the model is well fitted to the data or not with the null hypothesis and alternative hypothesis respectively.
Research Hypothesis
1. Chi squared Test
H0: All the coefficients associated with predictors (i.e. the slopes) equal zero
H1: At least one of coefficients not being equal to zero
2. Goodness of fit test
H0: The model is adequate fitted for the data
The log model of the ordinal logistic regression model is mentioned below in where the ordinal response is y and the expected value of the y is given as E(y) = π.
Through the algebraic manipulation:
k k
o Bx B x B x
B + + + +
=
− ....
1
ln 1 1 2 2
π π
Where,
1. B0, B1 ,….Bk are the parameter of the ordinary logistic regression model 2. X1, X2, ….Xkare the predictor variables
In above regression model even though the right side of the formula is linear, the left side is a non-linear function of the response variable π (ordinal responses) known as the logit link function. Since it is non-linear, the usual least square methods cannot be used to estimate the parameters. Therefore the method known as maximum likelihood is used in order to obtain above estimates. The log-likelihood ratio is used to identify the significance of the fitted model. Ordinal logistic regression was applied to multi-level responses with five-point likert scale (Strongly Disagree – 1, Disagree – 2, Fair- 3, Agree – 4, Strongly Agree - 5) with the multiple explanatory variables.
IV. RESULT AND DISCUSSION
As shown in Table 2, among the total number of participants 101 (52.1%) was male and 93(47.9%) was female participants. Furthermore, Table 2 indicates that out of these participants 103(53.09%) of participants were second year undergraduate students and 91 (46.90%) were the third year students who had responded to the survey.
Table 2: Student participation by gender and level of study year
Gender Second Year Third Year Grand Total Percentage
Female 47 46 93 47.9%
Male 56 45 101 52.1%
Grand Total 103 (53.09%) 91(46.90%) 194 100%
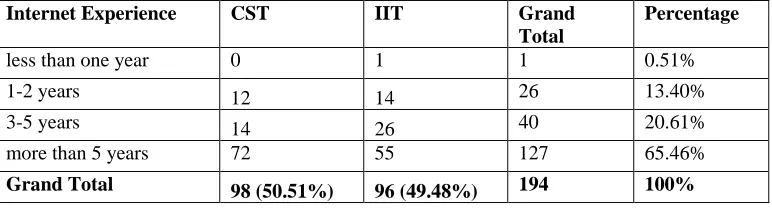
[image:4.612.115.501.546.650.2]According to the descriptive statistical analysis of the students’ internet experience the results emphasized that the majority of the students (65.46%) has more than five year of the internet experience and 20.61% has 3-5 year of internet experience. Additionally it presents that the approximately equal percentage of students from two degree programs named Computer Science and Technology (CST) and Industrial Information Technology (IIT) have been participated for the survey.
Table 3: Student participation by Internet Experience and degree program
Table 4 mentioned below is consisted of the results of the best fitted ordinal logistic regression model under the first usability category (Content and Organization) as well as the results of the log-likelihood value and goodness of fit test.
Internet Experience CST IIT Grand
Total
Percentage
less than one year 0 1 1 0.51%
1-2 years 12 14 26 13.40%
3-5 years 14 26 40 20.61%
more than 5 years 72 55 127 65.46%
Table 4: result summary of Content and Organization category
Ordinal logistic regression model for the first usability category (Content and Organization) is shown in below formula.
Where,
𝑥𝑥1= Up-to-date information
𝑥𝑥2= Easy of information search
𝑥𝑥3= Readable content
𝑥𝑥4= No need of scroll left and right
From the logistic regression result table of first usability category, the p-values are used to test the statistical evidence that the respective predictors have an effect on the response. Hence the the table shows that the p-value are less in 95% of significance level (alpha=0.05), it is verified that the usability factors of the first usability category has significance effect to the overall content and organization of the website. The values labeled as B0, B1, B2, B3 are estimated intercepts for the logits of the cumulative probabilities. Since the coefficients for the predictors represent the increments of log odds for four usability factors indicated under the first category, these factors are significantly effect to the content and organization of the website.
The statistic G tests value (114.001) of the Chi-squatted test and p-value (0.000) are shown that there is sufficient evidence to accept the coefficient for model is different from zero. The goodness-of-fit tests, with p-values of 1.000 denote that there is sufficient evidence to claim that the model is well filled with the data adequately.
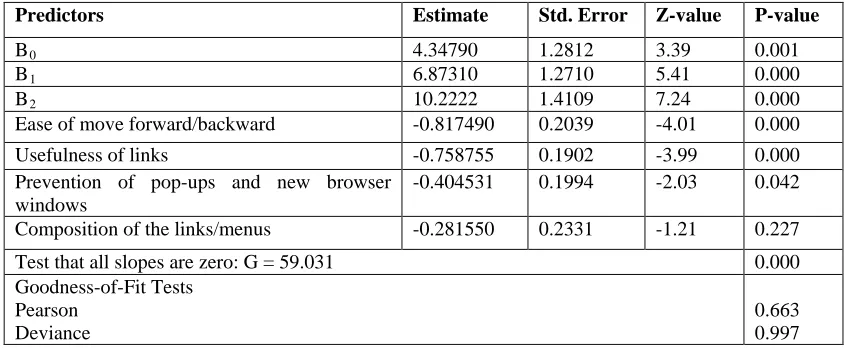
[image:5.612.89.511.549.724.2]The fitted ordinal regression model for second (Website Navigation and Links), third (User interface design) and fourth (Website Performance) usability categories of the website are shown in Table 5, Table 6 and Table 7 respectively.
Table 5: result summary of Navigation and Links
Predictors Estimate Std. Error Z-value P-value
B0 4.34790 1.2812 3.39 0.001
B1 6.87310 1.2710 5.41 0.000
B2 10.2222 1.4109 7.24 0.000
Ease of move forward/backward -0.817490 0.2039 -4.01 0.000
Usefulness of links -0.758755 0.1902 -3.99 0.000
Prevention of pop-ups and new browser windows
-0.404531 0.1994 -2.03 0.042
Composition of the links/menus -0.281550 0.2331 -1.21 0.227
Test that all slopes are zero: G = 59.031 0.000
Goodness-of-Fit Tests Pearson
Deviance
0.663 0.997
Predictors Estimate Std. Error Z-value P-value
B0 6.98555 1.62000 4.31 0.000
B1 10.0209 1.42328 7.04 0.000
B2 12.6739 1.55342 8.16 0.000
B3 16.6663 1.76496 9.44 0.000
Up-to-date information -0.872650 0.252254 -3.46 0.001
Easy of information search -1.48370 0.254650 -5.83 0.000
Readable content -0.912825 0.228386 -4.00 0.000
No need of scroll left and right -0.374317 0.181639 -2.06 0.039
Test that all slopes are zero: G = 114.011 0.000
Goodness-of-Fit Tests Pearson
Deviance
Ordinal Logistic Regression Model for the Navigation and Links:
Where
𝑥𝑥1= Ease of move forward/backward
𝑥𝑥2= Usefulness of links
𝑥𝑥3= Prevention of pop-ups and new browser windows
From the above Table 5, it can be concluded that the fitted model is significance at 95% of significance level and the goodness of fit test shows that the model is adequately fitted to the data since the p-values are 0.663 and 0.997.
[image:6.612.89.513.324.505.2]According to the fitted model results, the second usability category is mainly affected from three factors named as ease of move forward/backward, usefulness of links and prevention of pop-ups and new browser windows. Hence the p-value of the factor ‘composition of the links/menus’ is more than 0.05, the relevant factors has no significance effect to the navigation and links.
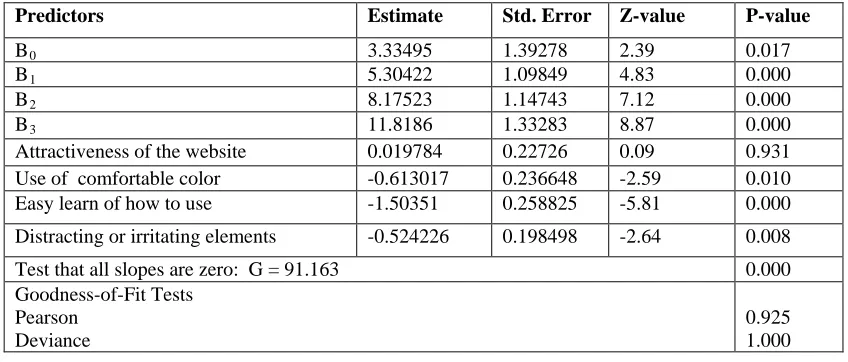
Table 6: result summary of User interface design
Predictors Estimate Std. Error Z-value P-value
B0 3.33495 1.39278 2.39 0.017
B1 5.30422 1.09849 4.83 0.000
B2 8.17523 1.14743 7.12 0.000
B3 11.8186 1.33283 8.87 0.000
Attractiveness of the website 0.019784 0.22726 0.09 0.931 Use of comfortable color -0.613017 0.236648 -2.59 0.010
Easy learn of how to use -1.50351 0.258825 -5.81 0.000
Distracting or irritating elements -0.524226 0.198498 -2.64 0.008
Test that all slopes are zero: G = 91.163 0.000
Goodness-of-Fit Tests Pearson
Deviance
0.925 1.000
Table 6 presents the result of fitted model under the category of user interface design which used to identify the user satisfaction regarding the interface design of the website.
Ordinal Logistic Regression Model for the User interface design:
Where,
𝑥𝑥1= Use of comfortable color
𝑥𝑥2= Easy learn of how to use
𝑥𝑥3= Distracting or irritating elements
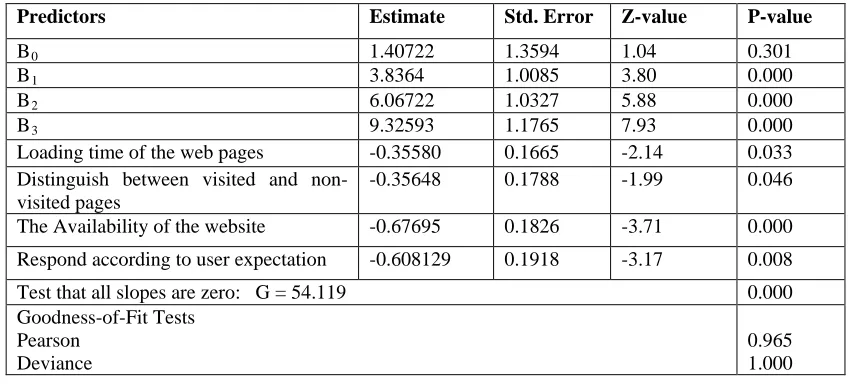
Table 7: result summary of Website Performance
Predictors Estimate Std. Error Z-value P-value
B0 1.40722 1.3594 1.04 0.301
B1 3.8364 1.0085 3.80 0.000
B2 6.06722 1.0327 5.88 0.000
B3 9.32593 1.1765 7.93 0.000
Loading time of the web pages -0.35580 0.1665 -2.14 0.033 Distinguish between visited and
non-visited pages
-0.35648 0.1788 -1.99 0.046
The Availability of the website -0.67695 0.1826 -3.71 0.000
Respond according to user expectation -0.608129 0.1918 -3.17 0.008
Test that all slopes are zero: G = 54.119 0.000
Goodness-of-Fit Tests Pearson
Deviance
0.965 1.000
Ordinal Logistic Regression Model for the Performance and Effectiveness:
Where,
𝑥𝑥1= Loading time of the web pages
𝑥𝑥2= Distinguish between visited and non-visited pages
𝑥𝑥3= The availability of the website
𝑥𝑥4= Respond according to user expectation
Based on the results mentioned in Table 7, it can be concluded that all the factors under the performance and effectiveness category is effected to the relevant category. Furthermore, the results emphasize that the model is significance at 95% significance level and it is well fitted to the data.
V. CONCLUSIONS
A University website needs to be more charming websites with respond to today’s advanced technological era in order to improve user satisfaction while strengthens the university brand and its webometrics among other universities. By evaluating the usability of Uva Wellassa University website, the above aimed aspects of the university can be acquired and enhanced. In this study, a descriptive survey was conducted to collect the opinions from the undergraduate users regarding the usability of the university website and collected data has been used to investigate whether the identified usability factors have an impact on Uva Wellassa University website. The results obtained from the survey statistically proved that there is a strong associations between the usability and the content and organization as well as performance of the websites. It further revealed that the navigation and user interface design of the websites is in acceptable level according to the user perspective. Therefore, it is recommended that the usability factors under the two dimensions namely content and organization as well as website performance should be taken into consideration when improving the university website. Thus, it will significantly affect to the quality design of the university website which make the users more comfortable in accessing the websites.
REFERENCES
[1] M. M. Yunus and A. Suliman, “Information & Communication Technology (ICT) tools in teaching and learning literature component in Malaysian secondary schools,” Asian Soc. Sci., vol. 10, no. 7, pp. 136–152, 2014.
[2] R. R. Ahmed, J. Vveinhardt, and N. Ahmad, “Empirical Analysis of Internet Usage and Academic Performance of Students: Evidence From Pakistan,” no. July, pp. 3883–3892, 2016.
[3] J. Nielson, “Usability 101: Introduction to Usability,” Nielsen Norman Group, 2012. [Online]. Available: https://www.nngroup.com/articles/usability-101-introduction-to-usability/. [Accessed: 01-Aug-2016].
[4] M. S. Rahman and S. Z. Ahmed, “Exploring the factors influencing the usability of academic websites: A case study in a university setting,” Bus. Inf. Rev., vol. 30, no. 1, pp. 40–47, 2013.
[5] L. Hasan, “Evaluating the usability of nine Jordanian university websites,” Int. Conf. Commun. Inf. Technol. - Proc., pp. 91–96, 2012.
[7] S. H. Mustafa and L. F. Al-Zoua’bi, “Usability of the academic websites of Jordans’ Universities An evaluation study,” Fac. Inf. Technol. Yarmouk Univ., pp. 1–9, 2008.
[8] M. B. Alotaibi, “Assessing the usability of university websites in Saudi Arabia: A heuristic evaluation approach,” in Proceedings of the 2013 10th International Conference on Information Technology: New Generations, ITNG 2013, 2013.
[9] T. K. Chiew and S. S. Salim, “Webuse: Website usability evaluation tool,” Malaysian J. Comput. Sci., vol. 16, no. 1, pp. 47–57, 2003.
AUTHORS
First Author – D.P. Jayathunga, Bachelor of Science in Computer Science and Technology, Uva Wellassa University of Sri Lanka,
Second Author – J.M.D.R. Jayawardana, Bachelor of Science, Uva Wellassa University of Sri Lanka,[email protected]
Third Author – S.T.C.I. Wimaladharma, Bachelor of Science, MSc.GIS, Uva Wellassa University of Sri Lanka,
Fourth Author – H.M.U.M. Herath, Bachelor of Science, MSc, Pasbridge Inc, UK, [email protected]
Correspondence Author – H.M.U.M. Herath, Bachelor of Science, MSc, Pasbridge Inc, UK, [email protected]