ISSN 2250-3153
Future Predictions of Rainfall Using GCMs: A Case
Study for Mandalay, Myanmar
Aye Aye Thant*1, Win Win Aye**2
o*1 Department of Civil Engineering, Mandalay Technological University, Myanmar
**2 Department of Civil Engineering, Technological University (Monywa), Myanmar
DOI: 10.29322/IJSRP.8.7.2018.p7903
http://dx.doi.org/10.29322/IJSRP.8.7.2018.p7903
Abstract- Future predictions of rainfall patterns in water-scarce regions are important and essential for effective water resources management. Global circulation models (GCMs) are commonly applied to conduct such predictions. However these models are complex and expensive. Moreover, their results are associated with uncertainties and variations for various greenhouse gas emission scenarios. This study involves predicting future rainfall under different scenarios of GCMs for Mandalay, upper Myanmar. Four GCM models under RCP4.5 and RCP8.5 scenarios are used to predict the future rainfall. Linear scaling method was applied for bias correction of GCM data relative to observed rainfall in Mandalay (1981-2005). Coefficient of determination (R2) and root mean square error (RMSE) are determined before and after bias correction to check the model’s performances. Among studied GCM models, MIROC-ESM model is found as the best and therefore, this model is applied to predict future rainfall. While comparing with RCP4.5 and RCP8.5 data and, observed data (2006-2015), RCP4.5 is fitter than RCP8.5. Under RCP4.5 scenario, the highest monthly rainfalls in 2020, 2050, 2080 and 2100 are 160mm, 171mm, 169mm and 180mm respectively. From this study, it is observed that the annual rainfall shows increasing trend under RCP4.5 scenario.
Index Terms- GCM models, Bias correction, Linear scaling method, RCP scenarios, Rainfall I. INTRODUCTION
lobal climate change is affecting and influencing water resources and several other aspects of life in developing countries. Most of regions in the world are facing with challenges due to the climate change. Climate change causes significant risks to the security of water resources in Asia region. Likewise, Myanmar’s climate is changing and climate variability affects communities and social-economic sectors in the country. Some climate change impacts are already observable and there is broad scientific consensus that further change will occur. Climate change profoundly affects the natural and social environment. The regional climate has been changing as evidences by increasing in temperature and rainfall intensity.
Climate change causes many impacts on changes in precipitation, availability of fresh water, floods and droughts of hydrological systems. Particularly, changes in precipitation or rainfall patterns are very important because it is the main driver of hydrologic cycle. Water resources are facing with considerable uncertainties at the regional, national, and local levels due to the impacts of climate change. Changes of future temperature and precipitation trend are likely to have impact on the climate conditions of regions.
For weather prediction and climate simulation and projection, general circulation models (GCMs) are used as a primary tool. Nowadays, GCM simulations are performed in many research studies. However, the GCMs output remains relatively coarse in resolution and is generally considered insufficient for representing local variability necessary for climate change impact studies. So, Linear Scaling method can be used for bias correction.
Forecasting future climate is very important because water resources can be managed more efficiently and necessary plans of adaption can be prepared. Due to forecasting the rainfall, people can prepare to protect from damage to crops, soil erosion, water logging, flooding, disease outbreak and socio-economic challenges. Therefore, this study aims at future prediction of rainfall for the selected area, Mandalay in Myanmar.
II. STUDY AREA
The case study area, Mandalay is the second largest city in Myanmar and the former capital city of Myanmar (Burma). It is located on the east bank of the Ayeyarwady River. The latitude and longitude coordinates for Mandalay are 21° 58' 29" N, 96° 05' 01" E. Mandalay enjoys a semi-tropical climate, which characterized by warm to hot summer and mild to cold winter. Mandalay receives the less rainfall than other regions, fluctuating from 10 to 180 mm, with the heaviest rainfall occurring in May, June, August, September and October (rainy season). The location of Mandalay is shown in Figure 1.
G
2019 ISSN 2250-3153
Fig. 1 Observed Monthly Average Rainfall (1981-2005)
III. DATA DESCRIPTION
Rainfall data for Mandalay station is collected for 35 years record (1981-2015) from the Department of Meteorology and Hydrology, Myanmar. GCMs are used to simulate the present climate and projected future climate. Daily data of climate variable (precipitation) are built by converting the original download file (net CDF) of GCMs into raster data using ArcGIS 10.1. Figure 2 shows observed monthly average rainfall for baseline period (1981-2005) of Mandalay station.
Fig. 2 Observed Monthly Average Rainfall (1981-2005)
IV. METHODOLOGY A. Description of bias correction
[image:2.612.204.440.455.609.2]International Journal of Scientific and Research Publications, Volume 9, Issue 9, September 2019 ISSN 2250-3153
climate, bias correction has led to a higher level of agreement among the models in predicting the magnitude and capturing the spatial pattern of extreme climate indices.
Among various kinds of methods for bias correction, linear scaling method is applied in this study. Linear scaling method aims to perfectly match the monthly mean of corrected values with that of observed ones. The linear-scaling approach operates with monthly correction values based on the differences between observed and raw data as described in equation (1).
=
(1)
where,
= corrected rainfall on the dth day of mth month = the raw rainfall on the dth day of mth month
= the mean value of observed rainfall at given month m
= the mean value of raw rainfall (GCMs) at given month m
B. Selection of GCMs
There are many GCMs, which provide projections of future climate under scenarios that might alter the evolution of the climate system. Four GCM models (CanESM2, GFDLCM3, MIROC-ESM and MIROC-ESM-CHEM) under RCP4.5 and RCP8.5 simulations data are used to show the range of future projections. GCMs are selected depending on data availability and, their performances are checked with statistical criteria. In this study, coefficient of determination (R2) and root mean square error (RMSE) are determined for selection of the best-fit GCM model. Table I shows the resolution and data availability of GCMs.
Table I
GCM MODELS,THEIR ORIGIN,RESOLUTION AND CLIMATE SCENARIOS
Sr Model
Name Origin Scenarios
Grid (Long-Lat)
1 CanESM2 Canadian Earth System Model Version 2
RCP4.5
RCP8.5 128 x64
2 GFDL-CM3 Geophysical Fluid Dynamics
Laboratory Climate Model Version 3
RCP4.5
RCP8.5 144x90
3
MIROC-ESM
Model for Interdisciplinary Research on Climate-Earth System
RCP4.5
RCP8.5 128x64
4
MIROC- ESM-CHEM
Atmospheric Chemistry Coupled Version of Model for Interdisciplinary Research on Climate-Earth System
RCP4.5
RCP8.5 128x64
C. Root Mean Square Error (RMSE) and Coefficient of Determination (R2)
Root Mean Square Error (RMSE) in equation (2) is used to measure the similarity and the difference between values predicted by a model and observed values.
∑ 1/2 (2)
where,
= observed data
= modeled data
Coefficient of determination (R2) in equation (3) measures the strength of a linear relationship between two variables of modeled and observed rainfall.
R= NΣxy - (Σx) (Σy) / (√(N Σx2
- (Σx)2)√(N Σy2 - (Σy)2)) ( 3 )
where,
ISSN 2250-3153
V. RESULTSANDDISCUSSION
Table II describes root mean square error (RMSE) and coefficient of determination (R2) for before and after bias correction. The model with lower RMSE and the higher R2 means the best one. MIROC-ESM model gives them and it becomes the best for Mandalay (R2 = 0.51, RMSE = 60). The observed monthly rainfall and bias corrected rainfall for Mandalay is illustrated in Figure 3. It is noticed that the observed and simulated average monthly rainfall values (given by MIROC-ESM model) are much closed.
Table II
R2 AND RMSE VALUES BEFORE AND AFTER BIAS CORRECTION
Fig. 3 Observed Rainfall and Bias-Corrected Rainfall for the Base Line Period (1981-2005)
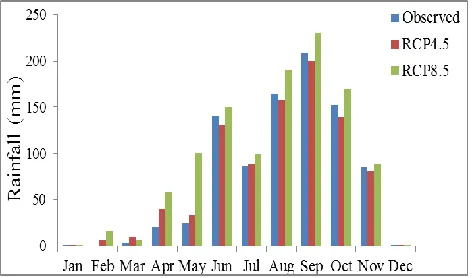
[image:4.612.189.425.564.703.2]For evaluation of best fit scenario, rainfall under two different scenarios RCP4.5 and RCP8.5 are compared with observed rainfall data (2006-2015) for Mandalay station as shown in Figure 4. It is observed that RCP4.5 is fitter than RCP8.5. The predictions of monthly rainfall under RCP4.5 scenario are compared with the baseline period for Mandalay as shown in Table III. Under RCP4.5 scenario, the predicted annual rainfalls are observed to be 836, 886, 841 and 921mm in the 2020, 2050, 2080 and 2100 respectively.
Fig. 4 Comparison between Different Scenarios and Observed Rainfall (2006-20015) GCM Models
R2 RMSE
Before Correction
After Correction
Before Correction
After Correction
CanESM2 0.11 0.32 143 66
GFDL-ESM 0.19 0.2 87 83
MICRO-ESM 0.24 0.51 83 60
International Journal of Scientific and Research Publications, Volume 9, Issue 9, September 2019 ISSN 2250-3153
Table III
MONTHLY RAINFALL FOR FUTURE PERIODS TOGETHER WITH BASELINE PERIOD (1981-2005) UNDER RCP4.5 SCENARIOS
Future monthly rainfall is predicted from the best fit GCM models under RCP4.5 scenario for Mandalay. The future monthly rainfall for the years 2020, 2050, 2080 and 2100 are illustrated in Figure 5. September shows the maximum rainfall in 2020, 2050, 2080 and 2100. In 2100, May and August show the second-maximum rainfall. May has the second highest rainfall in 2080. In both 2020 and 2050, August has the second-maximum rainfall.
[image:5.612.130.485.102.396.2]The projected seasonal rainfall for 2020, 2050, 2080 and 2100 is illustrated in Figure 6. The rainy season (June-September) in the 2020, 2050, 2080 and 2100 gets 491mm, 494mm, 478mm and 523mm under RCP4.5 scenario. Figure 7 illustrates the annual rainfall for the future period (2020-2100) under RCP4.5 scenario. The annual rainfall of Mandalay shows increasing trend under RCP4.5 scenario.
Fig. 5 Future Monthly Rainfall in Mandalay Month
Monthly Rainfall (mm)
Base Line Period (1981-2005) RCP4.5 Scenario
2020 2050 2080 2100
J 0 1 2 1 1
F 4 15 7 8 8
M 6 7 3 7 2
A 48 57 57 53 46
M 128 121 122 126 152
J 103 113 119 107 108
J 70 82 89 78 84
A 132 137 163 125 152
S 153 160 171 169 180
O 115 100 99 112 122
N 43 40 49 50 66
D 4 3 5 5 1
ISSN 2250-3153
Fig. 6 Future Seasonal Rainfall in Mandalay
Fig. 7 Annual Rainfall under RCP4.5 Scenario
VI. CONCLUSION
By simulating four GCM models for the historical period (base line period) (1981-2005), future rainfall for the periods: 2020, 2050, 2080 and 2100 under RCP4.5 and RCP8.5 scenarios are predicted. The model having the highest R2 value and the lowest RMSE show good agreement with the observed data for Mandalay station. MIROC-ESM model is the most suitable among the studied models for Mandalay. The monthly, seasonal and annual rainfall for the current time period and future are analyzed. It is observed that the rainfall mostly occurred in the future periods through 2020-2100 are fluctuated. The annual rainfall under RCP4.5 scenario has a rather fluctuation throughout 2020-2100 period with the increasing trend.
REFERENCES
[1] S. Sipple et al, A novel bias correction methodology for climate impact simulations, Ensemble bias correction 2016
[2] Aung Ye Htut, et al., J 2014, Forecasting Climate Change Scenarios in the Bago River Basin, Myanmar, Earth Sci Clim Change 2014
[3] Watterson, I.G. 2003.Simulated Changes Due to Global Warming in Daily Precipitation Means and Extremes and Their Interpretation Using the Gamma Distribution,” Journal of Geophysical Research, Vol.108 No. D13:
[4] Naw Mya Mya Thin 2013. “Impact of Climate Change on Yield and Irrigation Water Requirements for Rice Production in Myanmar, ” M.E Thesis, School of Engineering and Technology, Asian Institute of Technology, Thailand.
[5] Tarawneh, Q.Y, Chowdhury, S. Trends of Climate Change in Saudi Arabia: Implications on water resources. Climate 2018, 6, 8.
[6] Mekonnen, D,F; Disse, M. Analyzing the future climate change of Upper Nile River Basin using statistical downscaling techniques. Hyd. Earth Syst. Scie. 2018, 22, 2391-2408.
[7] Byun, K.; Hamlet, A. F. Projected changes in future climate over the Midwest and Great lakes region using downscaled CMIP5 ensembles. Int. J. Climato. 2018, 38, e531-e553.
[8] Sharma, T.; Vittal, H.; Chabra, S.; Salvi, K.; Ghosh, S.; Kamakar, S. Understanding the cascade of GCM and downscaling uncertaintities in hydro-climatic projections over India. Int. J. Climatol, 2018, 38, e178-e190.
[image:6.612.176.438.242.391.2]International Journal of Scientific and Research Publications, Volume 9, Issue 9, September 2019 ISSN 2250-3153
AUTHORS
First Author – Aye Aye Thant, M.Engg (Civil & Environmental) Japan-Saitama University, M.E (CWRE)Y.T.U, Mandalay
Technological University, [email protected]