Reviewable v1 Project Report
Semi-automated Robust Quantification of Lesions
(SRQL) Toolbox
Kaori L Ito, Julia M Anglin, Sook-Lei Liew
‡ University of Southern California, Los Angeles, United States of America
Corresponding author: Kaori L Ito ([email protected])
Received: 13 Feb 2017 | Published: 14 Feb 2017
Citation: Ito K, Anglin J, Liew S (2017) Semi-automated Robust Quantification of Lesions (SRQL) Toolbox. Research Ideas and Outcomes 3: e12259. https://doi.org/10.3897/rio.3.e12259
Abstract
Quantifying lesions in a robust manner is fundamental for studying the effects of neuroanatomical changes in the post-stroke brain on recovery. However, the wide variability in lesion characteristics across individuals makes manual lesion segmentation a challenging and often subjective process. This makes it difficult to combine stroke lesion data across multiple research sites, due to subjective differences in how lesions may be defined. We developed the Semi-automated Robust Quantification of Lesions (SRQL;
https://github.com/npnl/SRQL; DOI: 10.5281/zenodo.267213) Toolbox that performs several analysis steps: 1) a white matter intensity correction that removes healthy white matter voxels from the lesion mask, thereby making lesions slightly more robust to subjective errors; 2) an automated report of descriptive statistics on lesions for simplified comparison between or across groups, and 3) an option to perform analyses in both native and standard space to facilitate analyses in either space, or comparisons between spaces. Here, we describe the methods implemented in the toolbox and demonstrate the outputs of the SRQL toolbox.
Keywords
stroke, neuroimaging, software, neuroanatomy, robust, MRI, analysis
‡ ‡ ‡
Introduction
In stroke neuroimaging research, robust lesion quantification is important for performing statistical analyses relating brain changes to behavior after stroke. Specific lesion characteristics (e.g., stroke volume and location) can provide information about inter-individual differences in post-stroke neuroanatomy. However, as conventional practice for lesion segmentation involves manually tracing lesions from structural brain images, potential inconsistencies can arise due to subjective differences in the way lesions are defined. This would be particularly problematic for large, multisite collaborative efforts that involve many different individuals segmenting lesions. Thus, we aimed to develop a robust, user-friendly toolbox to improve standardization of lesion segmentation and to capture lesion characteristics for statistical analysis across individuals.
Method
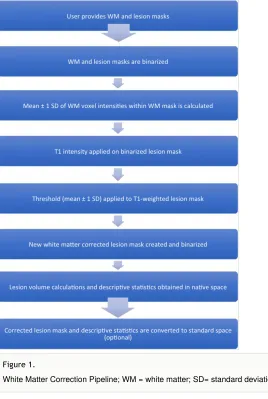
The SRQL toolbox incorporates three important features to make lesion analyses more robust: (1) a semi-automated white matter intensity correction, (2) a report of descriptive statistics on lesions, and (3) an option to perform analyses in native or standard space.
White Matter Intensity Correction
A semi-automated white matter intensity correction was implemented to remove healthy white matter voxels that may have accidentally been included in manual lesion segmentations (see Fig. 1 for pipeline). This correction was modified from an approach used by Riley and colleagues (Riley et al. 2010) to adjust lesion masks based on white matter intensity. This correction standardizes lesion segmentation across sites by limiting the range of healthy white matter voxels included in the lesion mask and removing ones that are within the healthy white matter range.
Descriptive Lesion Statistics
The SRQL toolbox additionally outputs a single descriptive lesion database file, organized by dataset (group) and subject. For each subject, the following descriptive statistics on white matter corrected lesions are reported and stored into the lesion database file: the hemisphere of the lesion (left or right), the lesion volume (mm ), the total brain volume (mm ), and the percentage of lesion volume to total brain volume. Specifically, the hemisphere of the lesion is estimated by extracting the x-coordinate of the center of gravity of the lesion (where a positive x-coordinate indicates a right hemisphere lesion, and a negative value indicates a left hemisphere lesion). The total lesion volume, total (skull-stripped) brain volume, and percentage of lesion-to-brain volume are then calculated using FSL's fslstats (Jenkinson et al. 2012) command.
3 3
Figure 1.
Registration to Standard Space
Finally, we implemented an option to convert the outputs (the adjusted lesion mask file and descriptive statistics) into standard space. As registration to standard space is computationally expensive, we elected to make this an optional feature for users who wish to compare lesion data across multiple subjects. To do this, the toolbox uses FSL's FLIRT toolbox (Jenkinson and Smith 2001, Jenkinson et al. 2002) to register each skull-stripped brain to a user-selected standard space template. If users have already completed this step, they can instead use their own registration matrix file and standardized brain image
files. The toolbox then registers each subject's adjusted lesion mask to the standard space. Lastly, descriptive statistics as described above are calculated in standard space and reported into the lesion database file.
Results
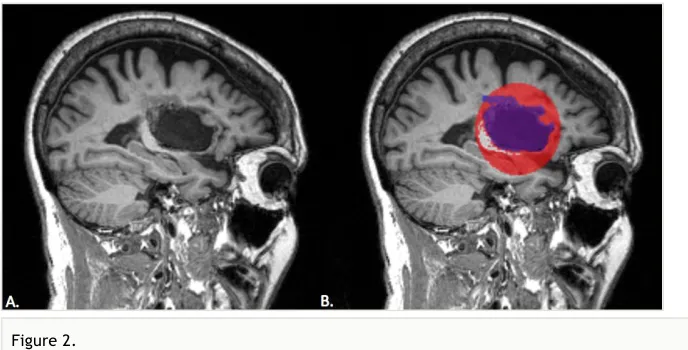
We first tested the toolbox on a single stroke subject's anatomical scan (Fig. 2a). To visualize the output of the white matter adjustment, we created a mock lesion mask that covered a substantial amount of healthy white matter. We then applied our toolbox to the mock lesion mask, and demonstrated that it only removed healthy white matter, but not lesioned matter voxels (Fig. 2b).
We then tested the SRQL toolbox on datasets from two different sites consisting of sixty subjects in total. Our script successfully ran on the two datasets, and we manually checked the hemispheric categorization of each lesion. We also checked the total number of voxels removed from the original lesion volume on average, which was 4.19±12.19%. Put another
Figure 2.
way, for each brain, there were approximately 4% of voxels that fell within the healthy white matter range that were subsequently removed.
Conclusion
We developed a toolbox to optimize quantification of lesions across research sites. The toolbox offers a robust analysis pipeline for performing lesion analyses across multiple datasets. Specifically, this toolbox improves the performance of statistical analysis on lesions through standardizing lesion masks with white matter adjustment, reporting descriptive lesion statistics, and normalizing adjusted lesion masks to standard space.
Future directions for the toolbox include: (1) automating the creation of each subject's white matter mask to decrease intensive labor demands and (2) constructing a report of group statistics on lesion data as well as a group probability map for visual identification of lesions across individuals.
Acknowledgements
The authors would like to thank the organizers and attendees of Brainhack LA, our research participants, and collaborators for their contributions.
Author contributions
KLI, JMA, & S-LL developed the software, performed tests, and wrote the report.
Conflicts of interest
We have no conflicts of interest to declare.
References
• Jenkinson M, Smith S (2001) A global optimisation method for robust affine registration of brain images. Medical Image Analysis 5 (2): 143‑156. https://doi.org/10.1016/ s1361-8415(01)00036-6
• Jenkinson M, Bannister P, Brady M, Smith S (2002) Improved Optimization for the Robust and Accurate Linear Registration and Motion Correction of Brain Images. NeuroImage 17 (2): 825‑841. https://doi.org/10.1006/nimg.2002.1132
• Jenkinson M, Beckmann C, Behrens TJ, Woolrich M, Smith S (2012) FSL. NeuroImage