Issues
ISSN: 2146-4138
available at http: www.econjournals.com
International Journal of Economics and Financial Issues, 2016, 6(2), 765-775.
The Effect of Information and Communication Technology on
Economic Growth: Arab World Case
Rami Hodrab
1, Mansoor Maitah
2*, Smutka Luboš
31Department of Economics, Faculty of Economics and Management, Czech University of Life Sciences Prague, Czech Republic, 2Department of Economics, Faculty of Economics and Management, Czech University of Life Sciences Prague, Czech Republic, 3Department of Economics, Faculty of Economics and Management, Czech University of Life Sciences Prague, Czech Republic. *Email: [email protected]
ABSTRACT
Information and communication technology (ICT), population growth, gross capital formation, openness and inflation are frequently well-thought-out as important drivers of economic growth in all countries especially for developing ones and so for Arab countries in our case. This paper aims to examine the effect of these factors on 18 selected Arab countries’ economic growth during the period from 1995 to 2013. Econometric analysis using panel regression has been adopted to test this impact. Ordinary least square model (OLS), random effects and fixed effects model have been applied for the study sample of 341 observations, and in order to choose the appropriate model, Hausman test has been used. For our analysis we used a basic model that includes the dependent variable gross domestic product per capita as an economic growth factor and the main concerned independent variable info density index that represents the capital and labor stock of ICT. Then we extended the model with other standardized macroeconomic control variables mentioned above and applied the three methodologies of regression. The outcomes illustrate that ICT has positive impact on the selected Arab countries’ economic growth as well as the other factors except for inflation which has a negative impact on economic growth for these countries. The impact degree of ICT on economic growth is less than that of other countries especially emerging and developed economists. Keywords: Information and Communication Technology, Information and Communication Technology Index, Population Growth, Gross Capital Formation, Openness, Inflation, Economic Growth, Arab Countries
JEL Classifications: C33, E22, O47
1. INTRODUCTION
The importance of information and communication technologies (ICTs) in economic and social development arisen dramatically with high impressing position since the starting of rapid growth of these technologies and their market in the mid-nineties. The world as developed, emerging and developing communities started enormously to harness ICT for sustainable development and advance creative and innovative knowledge societies (Mansell and Wehn, 1998). The importance role of ICT is in enabling humans, governments and organizations to transform information into knowledge as a robust driver in evolving lasting change in the
economy and society (Conole and Dyke, 2004; Gómez-Barroso and Pérez-Martínez, 2005; Kim, 2013; Lyon, 2013). Needed role
of ICT is considered to be in fostering sustainable long-term growth as a production technology through carefully designed ICT
systems and employment of ICT development programs (Avgerou,
2003; Dedrick et al., 2003; Zwass, 1996), such as investing in
contemporary ICT infrastructure which advance sustainable economic growth and a high standards of living, with an intelligent
administration of natural resources (Caragliu et al., 2011).
ICT is a dynamic area for investment, due to the continuing decline
of ICT equipment, tools and applications prices. In general ICT
investment involves three parts computers and their peripherals, software, and telecommunications devices. The last three decades
have seen a significant decrease in the price of computers and their components, and in the prices of communication equipment and networks (Jorgenson, 2001). This decline has encouraged different
types of enterprises to invest in ICTs to improve their performance
and to gain other benefits of ICTs. In the United States the real
in 1995 to $510 billion in 1999, and the software’s share of this
investment increased from $82 billion in 1995 to $149 billion in
1999 (Colecchia and Schreyer, 2002). In Canada the evolution
rate of investment for computers and associated devices has nearly double than that of software, and that of software has nearly doubled than that of telecommunications devices, where for the period from
1981 to 2007, real investment in computers increased at a 24.7% compound annual rate, compared to 13.5% for software and 5.4% for telecommunications devices (Sharpe and Arsenault, 2008). ICT
sector contributes in economy by creating work opportunities where this sector leads to create new job positions in the ICT production sector or ICT providing services. As an example the companies that provides mobile phone services by employing thousands of employees directly and indirectly. The report of International Telecommunication Union (ITU) denotes that in Nigeria with high population density where the sector of wires and wireless communication is considered as the main sector that creates job
positions specially the mobile phone sector. In March 2004 Nigerian
control communication estimated that telecommunication sector
led to employ 5000 new direct job positions driven by the evolving
of the mobile phone sector, and at the same month there was a
creation of 400,000 new job positions indirectly resulting from the
foundation of new businesses specialized in selling and maintaining mobile phones and their peripherals. Also ICT sector can facilitate the ways of searching for new jobs by using web applications and systems that facilitates recruitment process such as LinkedIn web system. Investing in ICT that includes ICT infrastructure, interpersonal communication, knowledge creation systems, infrastructure and support services for electronic commerce applications and others can advance country’s digital economy
and consequently growth and development (Zwass, 1996). Digital
divide is the concern of both rich and poor countries, which stimulates these countries to develop strategic plans that intended to narrow the digital divide between developed and developing countries. As the advances of ICT goes rapidly with continuous
decreasing of its cost (Jorgenson, 2001) the developing countries
will be enabled to narrow the gap of digital divide between them and developed countries. The revolution of ICT in developing countries is expanding and spreading giving the hope for these countries to achieve technology advances that contribute in advancing and
developing their economies (Zwass, 2003). Arab countries as part
of developing countries have to develop strategies and policies that encourage knowledge creation and spreading, as a part of a complete strategy to achieve sustainable development taking into account the contribution of ICT in building knowledge community. In order to achieve the needed sustainable development, ICT will help Arab countries in positively affecting economic growth as
many related studies illustrated (World Bank, 2012; Kraemer and Dedrick, 2001; Schreyer et al., 2003; Yamamichi, 2011; Salahuddin et al., 2015).
The role of ICT in economic growth has an important place in
economic research; While the focus of these studies was mostly
to identify the level effects of ICT on growth, more recent literature, however, places increasing weight to the role of ICT on technology and knowledge transfer and its potential role in
stimulating economic growth (Roberts, 2000; Carayannis et al., 2006). Measuring the effect of ICT for the country as a whole
is critical and associated with complex factors. As evaluating the effect of ICT at country level is challenging, the effect at the
lower parts of the economy such as firms and individuals is also
challenging. Intangible effects of ICT such as customer satisfaction
and quality improvements for products and services encounters difficulties in measurement (Brynjolfsson and Hitt, 1998). Facing the challenges and difficulties of measuring the intangible effect of ICT at the firm or individual level sums up at the country-level.
ITU and United Nations World Summit on Information Society developed a measurement index for ICT effects called “ICT
Development Index” (WSIS, 2003). ORBICOM proposed a main indicator for ICT which is Infostate, where ORBICOM followed
a comprehensive approach to measure the spread, absorption rate
and different effects of ICTs in all the world. ORBICOM led a conceptual framework that includes specific considerations of
connection, e-readiness, as well as ICT skills, and how to use ICT by individuals and corporation. This index consists of two indices
(infodensity and info-use) (Sciadas, 2005).
In this regard we will examine the impact of ICT on 18 Arab countries listed in Table 1 within the Middle East and North Africa (MENA) region according to the availability of information, in order to investigate if the impact of ICTs is positive to economic growth of these Arab countries and to what degree. We will represent economic growth by gross domestic product (GDP) per
capita and ICT by infodensity index developed by ORBICOM.
Also we will examine the impact of other variables on economic growth in addition to ICT such as population growth, openness,
gross capital formation (GCF) and inflation. We apply a panel regression in our investigation including least squares, fixed effects
(FEs) and random effects (REs) regression. We use Hausman test (Hausman, 1978) to investigate weather FEs or REs is the appropriate one for our data structure.
2. LITERATURE REVIEW
The direct economic effect of ICT can be measured as a percent of GDP. This is done by calculating the overall returns from the production of ICTs, or revenue resulting from the delivery of services of these technologies. The revenues of ICTs is more for developed countries than developing ones and continue increasing, although some developing countries achieved increased revenues from ICTs
(Wilson, 2004). For returns of ICT services, it also continues to
increase than the returns of their produced sector itself. Since that access to ICT services is not restricted to the developed countries as the production of ICTs themselves, where the penetration rates to telecommunications and wireless services for developing countries exceeded developed countries and the revenues as a percentage of GDP resulting from access to these services, were in developing countries higher than in developed countries.
The study entitled “ICT Investment and Economic Growth in
the 1990s” compared the impact of ICT investment on economic
growth in 9 OECD countries1. The study results showed that ICT
capital investment contributed between 0.2% and 0.5% points
1 These countries include Australia, Canada, Finland, France, Germany,
per year to economic growth according to the country. For the
period from 1995 to 2000, ICT contributed higher percentage from the preceding period ranging from 0.3% to 0.9% points
per year. Results showed that the United States was not the only
country that gained benefits from the positive impacts of ICT
capital buildup on economic growth. Impacts have obviously been biggest in the United States, and then in Australia, Canada and Finland, but the countries Germany, Japan, Italy, and France recorded the bottommost contribution of ICT investment impact on economic growth among the nine studied countries. One of the
most influential drivers of growth as ICT investment in the study
case is preparing appropriate ICT framework conditions and not
essentially in ICT sectors itself (Colecchia and Schreyer, 2002).
In a study of 15 European countries to examine how the infrastructure of broadband telecommunications penetration
affects these countries’ economic growth for the period 2003-2006, a macroeconomic production function was used. The consequences of this study show a significant positive relation
between broadband investment and GDP, where these percent
of effects ranged from 1.04% for Netherlands to 0.57% for Ireland with an average impact of 0.63% for the study sample
of 15 European Union (EU) countries. The impact of broadband infrastructure on GDP increases as the investment in broadband infrastructure increases and the highest level of impact was recorded to the Scandinavia countries (Netherlands, Denmark, Finland and Sweden) with high broadband penetration level more
than 20% (Koutroumpis, 2009).
Many researches relied on Cobb and Douglas (1928) production function to estimate the impact of ICT on economic growth. This used production function includes three independent variables which are labor, non-ICT capital, ICT capital and the constant that represents the other variables. The dependent variable here is GDP which represents economic growth. The challenge of using
this model is the difficulty of specifying the ICT capital especially
in developing countries, where in our case of study we faced
this difficulty, in addition to the unavailability of these related
information impeding us from using this model. Many studies
used this model such as the study held by Adel Ben Youssef on the case of Tunisia for the period from 1974 to 2001. He used the least squares model to estimate the related equation after adding a
dummy variable that takes the value of zero for the period 1981-1989 and 1 for the remaining period. The results of this study are
shown in the following equation:
Log (Y) = 1.265 + 0.756 Log (L)+ 0.108 Log (ICT capital) +
0.150 Log(non-ICT capital) − 0.02 D80 + εt (1)
Where, Y represents GDP, L represents labor, D the added dummy
variable and εt represents the random factor. All variables were
significant and the model as a whole also was significant with 99.7% R2 that reflects the explanation rate of the model.
The results in the equation above illustrate that, (i) If labor work rises by 1%, then production will rise by 0.756%, (ii) if non-ICT capital rises by 1%, then the production will rise by 0.150, (iii) if ICT capital increases by 1%, then production will increase by
0.108%. We note that the capital contribution of non-ICT is more
than the capital contribution of ICT, and this is present in the majority of developing countries because they still don’t realize the importance of the ICT sector, and they are not effectively using
these technologies in all sectors (Ben Youssef and M’Henni, 2003).
In a study of Khelifi (2010) about the relationship between the
digital divide and development level, the sample included 17 states
during the period 1995-2007. These states divided into two groups. The first group includes the countries Algeria, Tunisia,
Marco, Egypt, Israel and Jordan of the MENA region. The second
group includes the countries Bulgaria, Denmark, Finland, France, Germany, United Kingdom, Sweden, Italy, Holland, Spain, and
Slovenia of the EU. Author tried in this study to investigate the relationship between economic growth represented by GDP and the ICT spread indicators. Of all the ICT indicators author used the Internet usage index as it has the greatest impact on economic growth, as well as the digital divide appear more in the online index, this study was based on data scheduled methodology as follows:
Log (GDP/capitat,i) = α0 + α1 ln(Invt,i) + α2ln(Intt,i)+ α4ln(Ht,i) +
εt (2)
Where (GDPt) represents GDP per capita over time, (Invt) represents investment measured by the percentage of private and public ICT capital investment to GDP per capita over time, (Intt) represents internet usage over time, Ht represents human capital,
each (α) represents the elasticity of each variable, i represents
corresponding country, and (εt) represents the random factor.
The model was estimated using generalized squares method
applied to the three groups containing MENA region, EU and the third group represents the whole sample. The elasticities of the
variables of Internet usage and ICT investment were significant
and positive, but the elasticity of human capital was negative
and insignificant. However, these elasticities of internet and ICT
investment that represent their impact on GDP per capita were more for the European countries than the MENA countries. The results for this study were as follows: (i) If the uses of internet
rises by 1%, then GDP per capita will rise by 0.026% for the whole group of MENA and European countries, and it rises by 0.27 for EU and 0.07 for MENA countries, (ii) if ICT investment rises by 1%, then the GDP will rise by 0.018% for the whole group, 0.15% for EU and 0.093% for MENA countries. This study concluded
that the Internet usage index and ICT capital affect positively economic growth, but it did not take into consideration the rest
of the ICT indices such as mobile phone technology that frequent studies illustrated its positive impact on economic growth (Khelifi, 2010). In our study we will take several significant ICT indices in our consideration, according to the classification of International
ICT institutions such as ITU.
Some studies have used the technique of vector autocorrelation
through identifying a set of variables that are considered
determinants of economic growth, which includes fixed and mobile
A study done by ITU about the impact of broadband as an
ICT indication on economic growth of 120 countries, mostly
developing countries. The adopted model is composed of GDP
per capita growth rate for the period 1980-2006, as a dependent variable, GDP per capita in 1980, investment to GDP ratio from 1980 to 2006, primary school enrollment rate, average penetration
of broadband in addition to other telecommunication services for
developed and developing countries between 1980 and 2006 and
dummy variables for Latin America, sub Saharan and Caribbean countries. The results of this study showed that there is positive impact of ICT investment and broadband on GDP per capita, and
the elasticities of these variables are significant. After that other ICT variables were added such as fixed telephone subscriptions
and mobile phone subscribers. The results for this study were as
follows: (i) If fixed-line penetration rate in countries with low and mid incomes rises by 1%, then the economic growth rises by 0.043%, and 0.073% in high-income countries, (ii) if mobile phone penetration increases by 1%, then the GDP per capita will increase by 0.06% for low and mid income countries, and 0.081%
for countries with high income, (iii) if broadband penetration
increases by 1%, then GDP per capita will increase by 0.121% for countries with low and mid incomes, and 0.138% for high income countries (Qiang et al., 2009).
International Network of UNESCO Chairs in Communications
(ORBICOM) held a study for the impact of ICT on economic
growth including 146 developed, emerging and developing
countries, covering the period from 1995 to 2003. The main
model that was adopted in this study includes GDP per capita as a dependent variable and ICT infodensity index as an independent variable and transformed into logarithmic format. The details of this used model and the extended used model is illustrated later in the data and method section. The results found that ICT represented by infodensity index positively affect GDP per capita, where this
impact rangers from 0.85% in the year 1995 with 146 economics in the study sample to 1.24% in 2003 with 134 economies in the
sample in an increasing basis. The elasticity of the ICT index was
significant for all years of study. Also the results showed that the
impact of ICT varies between countries according to their stage of development and different infodensity levels, as the study found that there is a strong impact of ICT for countries with high levels
of infodensity (Sciadas, 2005).
In reference to above discussed related studies about their investigation to measure the impact of ICT on economic growth, and according to the availability of related ICT information we
will use the ORBICOM model in our investigation of the effect
of ICT on economic growth of Arab countries. Also as infodensity
ICT index was used in ORBICOM model as an index that captures
the ICT capital and labor stocks, where this index includes several
significant sub-indices representing ICT capital such as fixed lines
subscriptions, mobile phone subscriptions and bandwidth available for each internet user, and at the same time this index includes the various enrollment and literacy skills.
In what follows, Section 3 discusses ICT situation in Arab countries. In Section 4 we discuss method of the study and illustrate the sources of data. In Section 5, we describe the study
related data. In Section 6, we illustrate the study results and discussion. In Section 7, we conclude our research.
3. ICT IN ARAB COUNTRIES
Since the beginning of the 21st century, Arab countries began the planning and developing of strategies to reach certain levels in terms of the deployment and the provision of online Arabic, English and other contents. Arab countries represented by public and private institutes tried to simulate the developed countries in the adoption of internet and ICT applications in various economic,
social and scientific activities. Statistics of ITU indicates that the
percentage of the citizens of the Arab world who have already used
the internet, does not exceed 1% in the year 2001, despite that the Arab world’s 170 million people make up 5% of the total world
population at the time, but after this the percentage of the citizens
of the Arab world who have used the internet reached 5.61% in the year 2014, with Arab world’s 360 million population that make up 5.38% of the total world population. This is a good pre indication
of the involvement of Arab population in internet usage. In the light of the rapid and successive developments in ICTs and their robust
positive impact in economic and social fields, the involvement
of Arab nations in the information society has become essential.
The internet penetration is represented by the percentage of a population using the internet as stated by the internet users
indicator defined by ITU through the HH7 indicator which defines
internet users as internet use in the previous 12 months from any
location by in-scope individuals (Core ICT Indicators, 2010). Arab
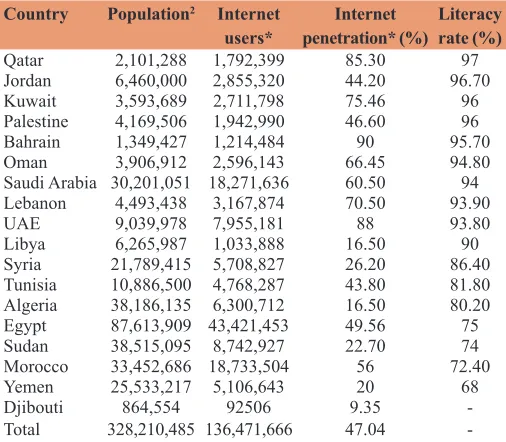
countries as other countries differ in their implementing of internet user parameters, such as for Qatar which collected data for internet penetration for the age 15 and more without considering the labor camps so as for other gulf states that have high foreign labor population compared to their original population except for Saudi Arabia and Oman, UAE follows the criteria of ITU. The source data of internet penetration shown in Table 1 is from ITU in order to be able to compare between different Arab countries. As we clarify from Table 1, Bahrain has the highest internet penetration between other Arab countries with 90% in the year 2013, followed by UAE and Qatar with 88% and 85.3% respectively. The gulf
Arab states have the highest internet penetration, as these rich
oil countries invest more in internet technology infrastructure; in addition to Lebanon with 70% in the year 2013.
As shown in Figure 1 the highest internet penetration rate is recorded for the six Gulf countries beside Lebanon. There is a big gap of internet penetration rate between Arab countries with
the highest rate recorded for Bahrain with 90% in 2013 and the lowest one with Djibouti recording 9.35%, followed by Libya
and Algeria as the second lowest internet penetration rate with
16.5%. The low internet penetrated countries such as Yemen and
Libya with positions 15 and 17 in the penetration index, have
highest internet growth rate with 17.61% and 17.53% respectively
replacing them in the third and fourth ranks in the growth index, increasing the number of internet subscribers of Arab countries.
Egypt has the highest internet users’ number with 43,421,453.3 in
2013 achieving an increase in internet growth rate with 15.20% from the year 2012 with 37,690,797 internet users. For internet penetration rate Egypt is in the ninth place as for the year 2013.
Figure 2 shows the number of fixed-line subscribers for the 18 Arab countries belonging to the years 2010, 2011, 2012 and 2013. The sequence by country is organized according to the growth of fixed-line subscription for the years 2010 and 2013. As shown in
the Figure 2 UAE has the highest growth rate and Libya has the
lowest growth rate. Egypt has the highest number of fixed-line
subscription according to its population.
For broadband and as shown in Figure 3, the two countries that represent the highest number of broadband subscribers are
Egypt and Saudi Arabia with 2,674,800 and 2,120,000 in 2013
respectively. The broadband growth rank place of Egypt is the
eighth one accounted from the year 2012 to 2013, with a rate of 15.95%. Saudi Arabia place of broadband growth rank is the twelfth one accounted from the year 2012 to 2013, with a rate of 7.84%. Syria placed third in broadband growth rate of 42.94% by a total of 346,146 subscribers representing 1.58% penetration rate in 2013, up from 242,154 representing 1.11% penetration rate in 2012. Kuwait placed 17 in broadband growth list with 0.0% rate and same number of subscribers reaching 47,000, and with decreasing penetration rate from 1.45% in 2012 to 1.4% in 2013. Arab countries stand out as the states with the fewest fixed-broadband subscriptions per 100 inhabitants, at 3.7 in 2015
compared with Europe with 29.6.
Mobile-broadband penetration level reached 41 active subscriptions
per 100 populations compared with Europe and the Americas, at about 78 in 2015 (TU, 2015).
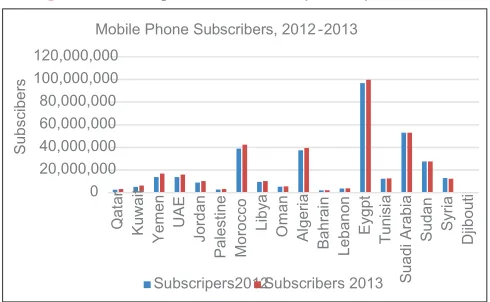
For mobile phone data the concerned information for the 18 Arab countries are shown in Figure 4, where Egypt and Saudi Arabia
have the largest amount of mobile subscribers with 99,705,000 and 53,104,000 respectively, followed by Morocco with 42,423,800 subscribers in 2013.
4. DATA AND METHOD
The main sources of the data needed to hold the analysis are extracted for each Arab country from the World Development Indicators3 where the data set contains annual data for each Arab Source: Author depending in information from ITU and World Bank
Figure 1: Internet penetrations by country, 2012-2013
Source: Author depending in information from ITU, World Bank and UNESCO
0 2,000,000 4,000,000 6,000,000 8,000,000 10,000,000 12,000,000
UA
E
Qa
ta
r
Bahrai
n
Oman
Su
adi Arabia Djibouti Palestin
e
Yeme
n
Sy
ria
Al
geri
a
Kuwait
Lebano
n
Tunisi
a
Jordan
Morocco Su
da
n
Eygp
t
Liby
a
Subscriptions
Fixed line growth by country, 2010-2013
subscriptions 2010 Subscriptions 2011 Subscriptions 2012 Subscriptions 2013
Figure 2: Fixed line growth by country, 2010-2013
Source: Author depending in information from ITU and World Bank
0 500,000 1,000,000 1,500,000 2,000,000 2,500,000 3,000,000
Su
da
n
Yeme
n
Sy
ria
Oman
Morocc
o
Djibout
i
Qa
ta
r
Eygp
t
Palestine Al
geri
a
UA
E
Su
adi Arabia Lebano
n
Jordan Tunisi
a
Bahrai
n
Kuwait Liby
a
Subscribers
Broadband subscribers by country, 2012-2013
Subscribers 2012 Subscribers 2013 Figure 3: Broadband subscribers by country, 2012-2013
2 http://data.worldbank.org/country/
Table 1: Internet users, penetration and literacy rates for the year 2013
Country Population2 Internet
users* penetration* (%)Internet Literacy rate (%)
Qatar 2,101,288 1,792,399 85.30 97
Jordan 6,460,000 2,855,320 44.20 96.70
Kuwait 3,593,689 2,711,798 75.46 96
Palestine 4,169,506 1,942,990 46.60 96
Bahrain 1,349,427 1,214,484 90 95.70
Oman 3,906,912 2,596,143 66.45 94.80
Saudi Arabia 30,201,051 18,271,636 60.50 94
Lebanon 4,493,438 3,167,874 70.50 93.90
UAE 9,039,978 7,955,181 88 93.80
Libya 6,265,987 1,033,888 16.50 90
Syria 21,789,415 5,708,827 26.20 86.40
Tunisia 10,886,500 4,768,287 43.80 81.80
Algeria 38,186,135 6,300,712 16.50 80.20
Egypt 87,613,909 43,421,453 49.56 75
Sudan 38,515,095 8,742,927 22.70 74
Morocco 33,452,686 18,733,504 56 72.40
Yemen 25,533,217 5,106,643 20 68
Djibouti 864,554 92506 9.35
-Total 328,210,485 136,471,666 47.04
country such as GDP per capita, population growth, GCF, Openness
and inflation. According to the availability of information we chose
18 Arab countries as they represent the majority of Arab countries
for the period from 1995 to 2013. We used the infodensity index developed by ORBICOM as an indication of ICT. The values of ICT infodensity for the period from 1995 to 2003 were obtained from ORBICOM study and the corresponding values for the years from 2004 to 2013 were calculated by the author using the related equations illustrated later in this section, depending in the
information for the concerned network sub index variables from ITU42 and the information for skills index from different UNESCO
related bulletins.
There are two-fold of ICT nature, the productive side (infodensity) and the consumption one (info-use). Infodensity refers to the part of a country’s whole capital and labor stocks related to ICT and represent the productive side. Info-use denotes to the ICTs consumption side. In principle, the two can be combined to represent the amount of a country’s ICT indication, or infostate. The difference in infostates among economies can comparatively assess the Digital Divide. Infodensity represents the per capita stock of ICT capital and labor skills and GDP per capita measures cumulative per capita output as an alternative for growth and development. Per capita conversion of networks and skills to compute the infodensity index is not the same as the per capita conversion of GDP. Regarding infodensity index the capital
stock is calculated by per 100 persons in some situations such
as Internet access and per household in others such as computer devices. In the GDP per capita computation, GDP is divided by the country population. The differences in data calculations between infodensity parameters and GDP result in sensitive outputs that
need more detailed assessment (Sciadas, 2003).
The relationship between GDP per capita and infodensity is linear, and there is strong correlation between them, that is, over time as infodensity increases, GDP per capita increases. Also this relation can be proved by Granger causality test as illustrated in Section 5.
This model can be expressed as follows:
Log (GDP/capitat,i)= Log (A) + α Log (IDt,i) + εt (1)
3 http://data.worldbank.org/country/
4 http://www.itu.int/ITU-D/ict/statistics/index.html.
Where (GDPt) represents GDP per capita over time, (IDt)
represents infodensity over time, (α) represents the elasticity of infodensity of GDP per capita and (εt) represents the random factor. The model can be estimated using panel regression using ordinary
least squares methodology, FEs and REs.
Our case study here is 18 Arab countries, as we need to measure the impact of ICT on Arab world economic growth during the
period (1995-2013). The production level in the economy depends on significant factors as illustrated in the above and following model which is adapted from the study of ORBICOM (Sciadas, 2005). ORBICOM model is provided by specialized institution as ORBCOMM network which is the “Global Network of UNESCO
Chairs Communications Telecommunications and the ITU,” the model, based on one explained variable that is information density and technical progress. The factors of production in a country by
their two-fold quality and quantity specify its productive capacity,
as in the case of infodensity. The calculation of infodensity
according to ORBICOM (Sciadas, 2005) is as follows:
Infodensity (ID) =
i k
n ti j c
k I
=
∏
1 ,
, ( ) (2)
With Π representing product and n the number of each component’s individual indexes, I represents the guide value and i represents
the used indexes. As illustrated by ORBICOM, for the year 2001,
networks with n = 5 (fixed line, mobile phone, cable, internet
user and bandwidth (bits/s)), skills with n = 2 (literacy and gross enrolment) and uptake with n = 4 (television, residential lines, PCs, internet users). Networks and skills (k = 2) are united into the infodensity index as follows:
ID = 2networks*skills (3)
Networks =
fixed inhabitants mobile inhabitants bandwidth
/ * /
* ( / ) /
100 100
b s iinternet user
3
(4)
Igross enrolment = (primary + 2 × secondary + 3 × tertiary)/6 (5)
Skills=2literate rate*Igrossenrolment (6) The above conceptual model may overvalue the degree of the
effect because a number of significant variables are not considered.
Even though the conceptual model accurately captures the way of infodensity’s impact on per capita GDP. The estimated extended
model (Sciadas, 2005) is as follows:
Log ( / ) 1
( )
, ,
,
GDP capita Population Growth
GCF GDP
t i t i
t
=α +α +
α
0
2 ii +α3Opennesst i, +α4Inflationt i, +αtLog ID( )t i, +εt
(7)
We will use the natural logarithmic format for the average per capita of the gross domestic product (GDP) according to
purchasing power parity (PPP) (constant 2011 international $).
Source: Author depending in information from ITU and World Bank
0 20,000,000 40,000,000 60,000,000 80,000,000 100,000,000 120,000,000
Qa
ta
r
Kuwait Yeme
n
UA
E
Jordan
Palestin
e
Morocc
o
Liby
a
Oman Algeri
a
Bahrai
n
Lebano
n
Eygp
t
Tunisi
a
Su
adi Arabia
Su
da
n
Sy
ria
Djibouti
Subsciber
s
Mobile Phone Subscribers, 2012-2013
Subscripers2012Subscribers 2013
GDP per capita based on (PPP). PPP GDP is gross domestic product converted to international dollars using PPP rates. An international dollar has the same purchasing power over GDP as the U.S. dollar has in the United States. GDP is the sum of gross value added by all resident producers in the economy plus any product taxes and minus any subsidies not included in the value of the products. It is calculated without making deductions for depreciation of fabricated assets or for depletion and degradation of natural resources.
The independent variables are divided into two types, first the main
independent variable which is the infodensity index that represents the ICT as illustrated before, and we express it in the model by the natural logarithmic format. The other types of independent variables are the macroeconomic standardized control variables. These variables are:
A. Population growth which reflects the percent annual growth
of the population of the country
B. Openness which are the sum of exports and imports of goods
and services divided by GDP. Exports of goods and services represent the value of all goods and other market services provided to the rest of the world. Imports of goods and services represent the value of all goods and other market services
received from the rest of the world. Data are in constant 2011
international dollars.
C. Investment proxy which is represented by GCF as percent of GDP. GCF (formerly gross domestic investment) consists of
outlays on additions to the fixed assets of the economy plus
net changes in the level of inventories. Fixed assets include
land improvements (fences, ditches, drains, and so on); plant, machinery, and equipment purchases; and the construction of roads, railways, and the like, including schools, offices,
hospitals, private residential dwellings, and commercial and industrial buildings. Inventories are stocks of goods held
by firms to meet temporary or unexpected fluctuations in production or sales, net acquisitions of valuables are also
considered capital formation.
D. Inflation, GDP deflator (annual %) where inflation is measured by the annual growth rate of the GDP implicit deflator shows
the rate of price change in the economy as a whole. The GDP
implicit deflator is the ratio of GDP in current local currency
to GDP in constant local currency.
Investment represented by capital formation is an important
element of economic growth (Nafziger, 1984; Solow, 1956). The
use of the capital formation as an independent variable refers
to its significant impact on GDP per capita as that positively
cumulate the volume of output needed for production, then value
added and productivity will increase, and consequently will be positively reflected on GDP per capita. Openness (that represents
the overall bulk of trade in GDP) as a standardized control factor
of growth positively stimulates economic growth (Bahmani-Oskooee and Niroomand, 1999; Dollar, 1992; Harrison, 1996).
Via exports openness is traditionally related to economic growth, where exports advance total factor productivity, advance technical progress, increase saving, enhance credit rating and
increase country’s income (Balassa, 1978; Krueger, 1978; Colombatto, 1990). Lower levels of inflation will decrease the
cost of production in real terms and this will positively affect economic growth, as the economic proxies properly realize the actual prices to be able to take coherent investment decisions
leading to more efficient use of resources, increase in total factor productivity and consequently increase in output growth
(Harberger, 1998).
5. DESCRIPTIVE STATISTICS
As we clarify from Figure 5, the relationship between the average values (for the study sample of 18 Arab countries) of Log (GDP per capita) and Log (infodensity) is linear with strong correlation. As the average value of the ICT index increases the average value of GDP per capita also increases, for the period
from 1995 to 2013.
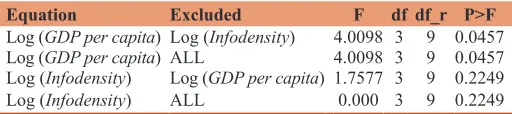
As shown in Table 2 we applied Granger causality test and according to the results in this table, we test the null hypothesis as follows:
“H0: Log (GDP per capita) does not granger cause of Log (Infodensity)”
“H0: Log (Infodensity) does not granger cause of Log (GDP per capita)”
The first hypothesis is accepted because the significance level is 0.225 which is more than the significance level of 0.05, so Log
(GDP per capita) does not cause Log (Infodensity). For the second
null hypothesis it is rejected as the significance level 0.0457 is <0.05, so the ICT index (Log (Infodensity)) does cause Log (GDP per capita) according to granger causality test.
Source: Author depending on information from World Bank, ITU and own calculations
0 0.5
1 1.5
2 2.5
4.36 4.38 4.4 4.42 4.44 4.46 4.48 4.5
Log(Infodensity)
Log(GDP per capita)
Relationship between GDP per capita and infodensity in Logarithmic format
Figure 5: Relationship between average gross domestic product per capita and average infodensity in logarithmic format for the period
from 1995 to 2013
Table 2: Granger causality Wald tests between Log (GDP per capita) and Log (Infodensity)
Equation Excluded F df df_r P>F
Log (GDP per capita) Log (Infodensity) 4.0098 3 9 0.0457
Log (GDP per capita) ALL 4.0098 3 9 0.0457
Log (Infodensity) Log (GDP per capita) 1.7577 3 9 0.2249
Log (Infodensity) ALL 0.000 3 9 0.2249
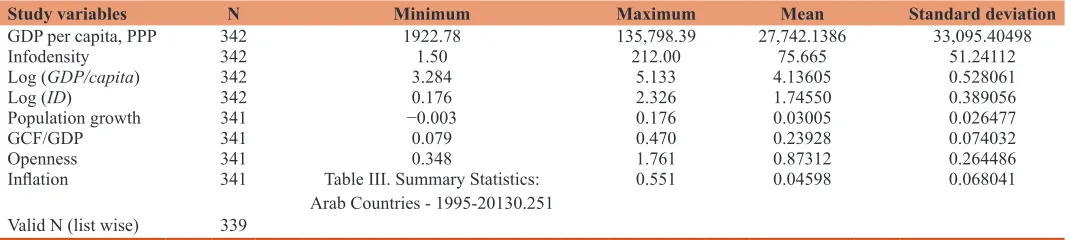
Table 3 shows the descriptive statistics of the 18 Arab countries
for the period from 1995 to 2013. The average GDP per capita53 in
the sample of 18 Arab countries is 27,742.14 US Dollars with the minimum value for Sudan in 1995 reaching 1922.78 US Dollars,
and the maximum value for Qatar in 2013 approaching 135798.39
US Dollars. The main variable for interest is ICT index represented by infodensity which represents ICT capital and labor stock with an average value of 75.6, the minimum value for Sudan with 1.5 in
1995, and the maximum value for Bahrain with 212 in the year 2012. The average population growth for Arab countries is 3%, ranging from -0.3% for Libya in the year 2013, to 17.6% for Qatar in the year 2007. The average value of GCF as a percent of GDP is 23.9%, with the minimum value of 7.9% for Bahrain in 1999, and the maximum value of 47% for Algeria in the year 2009. The average value of openness is 87.3%, with the minimum value of 34.8% for Libya in the year 1999 and the maximum value 176.1% for United Arab Emirates in the year 2013. The average value of inflation is 4.6%, with the minimum value of −25.1% for Oman in the year 2009, and the maximum value of 55.1% for Yemen
in the year 1995.
6. RESULTS AND DISCUSSION
In what follows we will assess the model equations, and analyze the results. We quantitated the research model using the
econometric program STATA 14.1. The research results were estimated for the full sample of 18 Arab countries for the period
from 1995 to 2013. We estimated the impact of ICT represented
by the infodensity, using the pooled OLS (POLS), the REs and the FEs as shown in Table 4. FEs allow for heterogeneity between the 18 Arab countries by permitting these countries to have their own intercept value. The FEs are time invariant as intercept does not vary over time although it may differ across countries. For the REs model the 18 Arab countries have a shared mean value
for the intercept. In order to investigate which model fit our data,
the FEs or REs we applied Hausman test. Hausman test illustrates that for the null hypothesis the REs model is the appropriate, and the alternative hypothesis illustrates that the FEs model is the suitable one. If in the results we get a statistically significant P
value, we shall procedure with FE model, or else the RE model is the suitable one. The impact of ICT on GDP per capita is showed with coeffcients using the three models as in Table 4. Using
5 GDP per capita, in purchasing power parity (PPP) adjusted US Dollars
constant 2011 international.
POLS approach the elasticity of ICT approaches 0.434 which is significant as the P value is zero. Using the FE approach the
elasticity of ICT which is represented by the infodensity index
is 0.261 and it is significant as the P value is zero. This elasticity means that if the ICT index increases by 1% then the GDP per capita will increase by 0.261% which is a positive indication
of the impact of ICT on economic growth. The RE approach
indicates that the elasticity of ICT positive with 0.262% value and it is significant as the P value is zero. The two models used
FEs and REs, approximately give the same output elasticity for the effect of ICT on GDP per capita for the full sample of 18 Arab
countries. In order to investigate which model is fit for our data FE
or RE, we apply Hausman test and the result shows a statistically
significant P value, so FE is the appropriate model.
Although the previous used model reflects our main goal to
measure the impact of ICT on economic growth represented by
GDP per capita and measured in PPP, there are other significant
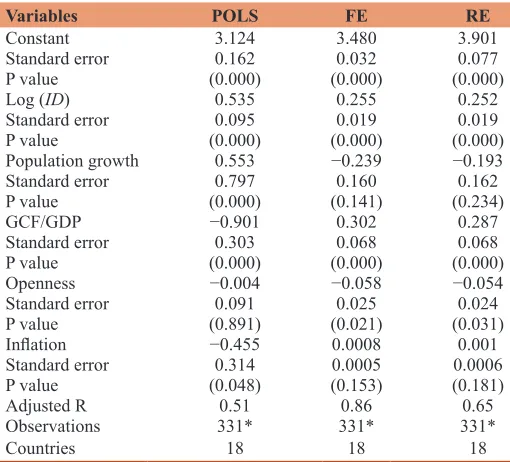
variables that may affect the GDP per capita. This extended model is illustrated in the previous section. After applying panel regression using POLS, FE and RE models, the results we obtained are shown in Table 5. Via POLS approach the elasticity of ICT
index approaches 0.535 which is significant as the P value is zero, meaning that if the ICT index increases by 1% then the GDP per capita will increase by 0.535% which is a positive indication of the
impact of ICT on economic growth. The elasticity of population
growth approaches 0.553 which is significant as the P value is zero. The elasticity of GCF as percent of GDP approaches −0.901 which is significant. The elasticity of openness approaches −0.004, but it is insignificant as the P = 0.891. The elasticity of inflation approaches −0.455, but it is significant. The constant value is Table 4: Impact of ICT on GDP per capita with dependent variable: Log (GDP per capita) - 1995-2013 - Full sample
Variables POLS FE RE
Constant 2.660 3.627 3.625
Standard error (0.107) (0.017) (0.079)
P value (0.000) (0.000) (0.000)
Log (ID) 0.434 0.261 0.262
Standard error (0.060) (0.009) (0.009)
P value (0.000) (0.000) (0.000)
Adjusted R 0.46 0.5 0.522
Observations 341 341 341
Countries 18 18 18
P<0.05. Source: author using STATA 14.1. GDP: Gross domestic product, ICT: Information and communication technology
Table 3: Summary statistics: Arab countries - 1995-2013
Study variables N Minimum Maximum Mean Standard deviation
GDP per capita, PPP 342 1922.78 135,798.39 27,742.1386 33,095.40498
Infodensity 342 1.50 212.00 75.665 51.24112
Log (GDP/capita) 342 3.284 5.133 4.13605 0.528061
Log (ID) 342 0.176 2.326 1.74550 0.389056
Population growth 341 −0.003 0.176 0.03005 0.026477
GCF/GDP 341 0.079 0.470 0.23928 0.074032
Openness 341 0.348 1.761 0.87312 0.264486
Inflation 341 Table III. Summary Statistics:
Arab Countries - 1995-20130.251 0.551 0.04598 0.068041
Valid N (list wise) 339
3.124, which includes the impact of other factors not included in
the model. The overall model is significant as the F-value is 54.96
and it is less than the tabular value. The adjusted R2 for the model
is 0.51 which reflects the explanation rate of the model.
In order to reflect the nature of panel data we have to use models that reflect the differences between various 18 Arab countries such
as data heterogeneity between different countries or if the time is invariant it may differ across countries.
Using the FE approach the elasticity of Log (infodensity)
approaches 0.255 which is significant as the P value is zero
giving a positive indication of the impact of ICT on economic
growth. The elasticity of population growth approaches −0.239 which is insignificant as the P = 0.141. The impact of GCF as percent of GDP is positive and significant with 0.302% value. The elasticity of inflation approaches 0.0008, but it is insignificant as the P = 0.153. The elasticity of openness approaches −0.058, and it is significant as the P = 0.021 at 95% confidence level. The
constant value is 3.58, which includes the impact of other factors
not included in the model. The overall model is significant as
the F-value is 44.77 and it is less than the corresponding tabular value. The adjusted R2 for the model is 86% which reflects the explanation rate of the model.
The results of RE approach illustrates that the ICT index
approaches has positive and significant impact of 0.252% value. The elasticity of population growth approaches −0.193 which is insignificant as the P = 0.234. The impact of GCF approaches 0.287%, which is significant as the P = 0.000 <5% of confidence. The elasticity of inflation approaches 0.001, but it is insignificant as the P = 0.181. The impact of openness is negative and significant
with −0.054 effect on GDP per capita. The constant value is 3.901.
The adjusted R2 for the model is 65%.
The two models used FE and RE, approximately give the same output elasticity for the effect of ICT on GDP per capita for the
full sample of 18 Arab countries, 0.255 and 0.252 respectively. In order to investigate which model is fit for our data FE or RE,
we apply Hausman test and the result shows that a statistically
significant P value, so the FE is the appropriate model.
According to our results and as the appropriate model is FE one,
the equation that represents the impact of ICT and other control
variables on GDP per capita is represented as follows:
Log GDP capita Population Growth
GCF GDP
/ . .
. )
(
)
=3 48− 239 +3 2(
0
0 0 −−0 058. Openness+ 0 000. 8Inflation+0.255
From the above equation and as our main concern is the impact
of ICT, we recognize the positive impact of ICT on GDP per
capita with a weight of 0.152, this result accommodates with many related studies (Ben Youssef and M’henni, 2003; Colecchia and Schreyer, 2002; Koutroumpis, 2009; Nour, 2002; Qiang et al., 2009; Sciadas, 2005). The positive impact of ICT index
that contains both the labor and capital stocks, giving indication that it is worth to continue on and increase the investment and adopting of ICT’s in various sectors of Arab countries. So it is important to continue and increase the investment on ICT capital stock Internet, broadband and mobile infrastructure and related systems, in the other hand it is important to invest more in labor skills related to ICT. The impact of ICT for Arab countries is less than the average value of different world countries such as the
result of ORBICOM, where ICT impact ranged from 0.85 to 1.24
according to different years.
Population growth positively affect GDP per capita with an
effect of 0.068, this positive impact is accommodated with the
new endogenous growth theory (Howitt, 1999). GCF positively affects economic growth and this is similar to many research studies such as Artelaris et al. (2006). Solow (1962) proposed that capital formation and investment are significant to growth. The
positive impact of openness on GDP per capita matches many related researches that propose a positive effect of openness on
economic growth rate at the long-run (Romer, 1998; Barro and
Sala-i-Martin, 1995). This suggestion stems from the propose that production increase of domestic products for external exports and the increase of imports availability in local markets will stimulate local companies that face the pressure of competitiveness to adopt
new technologies or innovate new efficient ways of production, so
as to increase productivity and lower the cost of production, and
this will be reflected positively on economic growth. The research results show that inflation rates negatively affect economic growth
and this is similar to some related research results (Fischer,
1993; Barro, 1996; Guerrero, 2006). Some of the research results concerning the impact of inflation levels on economic growth
propose that this impact depends on the countries within the
study sample and/or the period of the study (Sarel, 1996; Ghosh
and Phillips, 1998).
Table 5: Impact of ICT, population growth, GCF/GDP,
openness and inflation on GDP per capita with dependent
variable: Log (GDP per capita) - 1995-2013 - Full sample
Variables POLS FE RE
Constant 3.124 3.480 3.901
Standard error 0.162 0.032 0.077
P value (0.000) (0.000) (0.000)
Log (ID) 0.535 0.255 0.252
Standard error 0.095 0.019 0.019
P value (0.000) (0.000) (0.000)
Population growth 0.553 −0.239 −0.193
Standard error 0.797 0.160 0.162
P value (0.000) (0.141) (0.234)
GCF/GDP −0.901 0.302 0.287
Standard error 0.303 0.068 0.068
P value (0.000) (0.000) (0.000)
Openness −0.004 −0.058 −0.054
Standard error 0.091 0.025 0.024
P value (0.891) (0.021) (0.031)
Inflation −0.455 0.0008 0.001
Standard error 0.314 0.0005 0.0006
P value (0.048) (0.153) (0.181)
Adjusted R 0.51 0.86 0.65
Observations 331* 331* 331*
Countries 18 18 18
7. CONCLUSION
Depending on a sample of 18 Arab countries that represents the majority of Arab countries, we investigated the effect of ICT on
economic growth for the period from 1995 to 2013. The main
issue in this study is to examine whether the accumulation of ICT labor and capital positively affect economic growth for these Arab countries and to what extent. A penal regression is used in this study with 341 observations for the basic model and 331 observations for the extended model which includes other
significant macroeconomic variables. To measure the impact of ICT we used the infodensity index proposed by ORBICOM as a
lonely independent index in the basic model, the panel regression
result showed that ICT has a positive and significant impact on
GDP per capita for the study sample of 18 Arab countries with
impact of 0.261 using the FE model as an appropriate model,
according to Hausman test. This result is accommodated with other research results illustrated in this study. The extended
model showed that ICT positively and significantly affects GDP per capita with impact of 0.255, in addition, GCF have positive and significant effect on GDP per capita with elasticity of 0.302.
Although the factor population growth has positive impact on
GDP per capita, it’s insignificant, so as for inflation. The variable openness has negative and significant impact on GDP per capita with a −0.058% of effect. For the extended methodology the FEs
model was the appropriate one using Hausman test.
Our significant concluded point that it is worth for the Arab
countries to invest more in ICT capital and labor as they have positive impact on economic growth, so these countries should plan to invest more in ICT capital sectors such as Internet, mobile and broadband communication infrastructure, electronic commerce practices and others, in addition to invest more in ICT skills such as education. As the impact of ICT in Arabic countries less than that of other countries, it is important to restructure the strategies and policies concerning the investment and adoption of ICT capital and labor stock.
ACKNOWLEDGMENTS
The paper is supported by Grant no. 20161014 - Is there any
possibility for functional co-operation of the post-soviet countries? Grant is provided by FEM, CULS in Prague.
REFERENCES
Artelaris, P., Arvanitidis, P., Petrakos, G. (2006), Theoretical and Methodological Study on Dynamic Growth Regions and Factors Explaining Their Growth Performance, (No. DYNREG02). Avgerou, C. (2003), The link between ICT and economic growth in
the discourse of development. In: Proceedings of the International Federation of Information Processing. Vol. 9. p373-386.
Bahmani-Oskooee, M., Niroomand, F. (1999), Openness and economic growth: An empirical investigation. Applied Economics Letters, 6(9), 557-561.
Balassa, B. (1978), Exports and economic growth: Further evidence. Journal of Development Economics, 5(2), 181-189.
Barro, R.J. (1996), Determinants of economic growth: A cross-country
empirical study (No. w5698). National Bureau of Economic Research.
Barro, R.J., Sala-i-Martin, X. (1995), Economic Growth, Advanced Series in Economics. New York, London and Montreal: McGraw-Hill. Ben Youssef, A., M’henni, H. (2003), Les effects des technologies de
l’information et de communication sur la croissance économique; le cas de la Tunisie [ICT contribution to growth; the case of tunisia] (No. 27537). Germany: University Library of Munich.
Brynjolfsson, E., Hitt, L. (1998), Beyond the productivity paradox. Communications of the ACM, 41(8), 49-55.
Caragliu, A., Del Bo, C., Nijkamp, P. (2011), Smart cities in Europe. Journal of Urban Technology, 18(2), 65-82.
Carayannis, E.G., Popescu, D., Sipp, C., Stewart, M. (2006), Technological learning for entrepreneurial development (TL4ED) in the knowledge economy (KE): Case studies and lessons learned. Technovation, 26(4), 419-443.
Cobb, C.W., Douglas, P.H. (1928), A theory of production. The American Economic Review, 18(1), 139-165.
Colecchia, A., Schreyer, P. (2002), ICT investment and economic growth in the 1990s: Is the United States a unique case? A comparative study of nine OECD countries. Review of Economic Dynamics, 5(2), 408-442.
Colombatto, E. (1990), An analysis of exports and growth in LDCs. Kyklos, 43(4), 579-597.
Conole, G., Dyke, M. (2004), What are the affordances of information and communication technologies? Association for Learning Technology Journal, 12(2), 113-124.
Core ICT. (2010), Indicators 2010. Partnership on Measuring ICT for Development. Available from: http://www.itu.int/pub/D-IND-ICT_CORE-2010/en.
Gómez-Barroso, J.L., Pérez-Martínez, J. (2005), Public intervention in access to advanced telecommunication services: Assessing its theoretical economic basis. Government Information Quarterly, 22(3), 489-504.
Dedrick, J., Gurbaxani, V., Kraemer, K.L. (2003), Information technology and economic performance: A critical review of the empirical evidence. ACM Computing Surveys (CSUR), 35(1), 1-28.
Dollar, D. (1992), Outward-oriented developing economies really do grow more rapidly: Evidence from 95 LDCs, 1976-1985. Economic Development and Cultural Change, 40(3), 523-544.
Fischer, S. (1993), The role of macroeconomic factors in growth. Journal of Monetary Economics, 32(3), 485-512.
Ghosh, A., Phillips, S. (1998), Warning: Inflation may be harmful to your growth. IMF Staff Papers, 45(4), 672-710.
Guerrero, F. (2006), Does inflation cause poor long-term growth performance? Japan and the World Economy, 18(1), 72-89. Harberger, A.C. (1998), A vision of the growth process. The American
Economic Review, 88(1), 1-32.
Harrison, A. (1996), Openness and growth: A time-series, cross-country analysis for developing countries. Journal of Development Economics, 48(2), 419-447.
Hausman, J.A. (1978), Specification tests in econometrics. Econometrica, 6(46), 1251-1271.
Howitt, P. (1999), Steady endogenous growth with population and R&D inputs growing. Journal of Political Economy, 107(4), 715-730. ITU. (2014), Measuring the Information Society 2014. Available from:
http://www.itu.int/en/ITU-D/Statistics/Documents/publications/ mis2014/MIS2014_without_Annex_4.pdf.
ITU. (2015), Measuring the Information Society, 2015. Available from: http://www.itu.int/en/ITU-D/Statistics/Documents/publications/ misr2015/MISR2015-w5.pdf.
mis2014/MIS2014_without_Annex_4.pdf.
Jorgenson, D.W. (2001), Information technology and the US economy. The American Economic Review, 91(1), 1-32.
Khelifi, O. (2010), Fracture numérique et niveau de développement économique. VIème colloque international, Prospective strategies et développement durable, 21-23 juin, Hammamet (Tunisie); 2010. Available from: http://www.nzaher710.free.fr/informatique.pdf. Kim, S. (2013), E-policy and e-government: Theories and Strategies.
Seoul: Bumnoonsa.
Krueger, A.O. (1988), Development with Trade: Liberization Attempts and Consequences. Cambridge, Mass: Ballinger.
Koutroumpis, P. (2009), The economic impact of broadband on growth: A simultaneous approach. Telecommunications Policy, 33(9), 471-485.
Kraemer, K.L., Dedrick, J. (2001), Information technology and productivity: Results and policy implications of cross-country studies. In: Pohjola, M., editor. Information Technology, Productivity and Economic Growth: Implications for Economic Development. Oxford: Oxford University Press.
Lyon, D. (2013), The Information Society: Issues and Illusions. New York: John Wiley & Sons.
Mansell, R., Wehn, U. (1998), Knowledge Societies: Information Technology for Sustainable Development. Oxford: United Nations Publications.
Nafziger, E.W. (1984), The Economics of Developing Countries. Belmont, California: Wadsworth Publishing Co.
Nour, S.S.O. (2002), The Impact of ICT on Economic Development in the Arab World: A Comparative Study of Egypt and the Gulf Countries. In: Economic Research Forum Working Papers, (No. 0237). Qiang, C.Z.W., Rossotto, C.M., Kimura, K. (2009), Economic impacts
of broadband. Information and Communications for Development 2009: Extending Reach and Increasing Impact. Vol. 3. Washington, DC: World Bank. p35-50.
Roberts, J. (2000), From know-how to show-how? Questioning the role of information and communication technologies in knowledge transfer. Technology Analysis & Strategic Management, 12(4), 429-443. Romer, P.M. (1998), Two strategies for economic development: Using
ideas and producing ideas. The World Bank Economic Review, 6(1), 63-91.
Salahuddin, M., Gow, J., Ozturk, I.(2015), Is the long-run relationship between economic growth, electricity consumption, carbon dioxide emissions and financial development in gulf cooperation council countries robust? Renewable and Sustainable Energy Review, 51, 317-326.
Sarel, M. (1996), Nonlinear effects of inflation on economic growth. IMF Staff Papers, 43, 199-215.
Sciadas, G., editor. (2003), Monitoring the Digital Divide and Beyond. Montreal: Orbicom. Available from: www. [Last accessed on 2015 Jan 04].
Sciadas, G. (2005), From the digital divide to digital opportunities. Available from: http://www.itu.int/ITU-D/ict/publications/material/ index_ict_opp.pdf.
Sharpe, A., Arsenault, J.F. (2008), ICT Investment and Productivity: A Provincial Perspective (No. 2008-06). Centre for the Study of Living Standards.
Schreyer, P., Bignon, P.E., DuPont, J. (2003), OECD Capital Services Estimates: Methodology and a First Set of Results, OECD Statistics Working Papers, 2003/6. Paris: OECD.
Solow, R. (1956), A contribution to the theory of economic growth. Quarterly Journal of Economics, 70(2), 65-94.
Solow, R.M. (1962), Technical progress, capital formation, and economic growth. The American Economic Review, 52(2), 76-86.
UNESCO Institute for Statistics. (2015), UNESCO Institute for Statistics Database 2015. Available from: http://www.data.uis.unesco.org/Index. aspx?DataSetCode=EDULIT_DS&popupcustomise=true&lang=en. Wilson, E.J. (2004), He Information Revolution and Developing
Countries. Cambridge, MA: MIT Press.
World Bank Information, Communication Technologies and Info Dev (Program). (2012), Information and Communications for Development 2012: Maximizing Mobile. Washington, DC: World Bank Publications.
World Bank. (2014), World Development Indicators 2014. World Bank Publications. Available from: http://www.data.worldbank.org/sites/ default/files/wdi-2014-book.pdf.
World Summit on Information Society, (WSIS). (2003), Plan of action. Document WSIS-03/GENEVA/DOC/5-E. Geneva: International Telecommunications Union (ITU) Secretariat.
Yamamichi, M. (2011), The role of mobile-enabled social media in social development. World Bank Publications. Available from: http://www. wds.worldbank.org/external/default/WDSContentServer/WDSP/IB/ 2011/08/03/000386194_20110803024157/Rendered/PDF/635690W P0Mobil00Box0361520B0PUBLIC0.pdf.
Zwass, V. (1996), Structure and impacts of e-commerce. International Journal of Electronic Commerce, 1(1), 3-23.