DOI: 10.22075/JRCE.2018.13732.1250
journal homepage: http://civiljournal.semnan.ac.ir/
A Method for Predicting Pile Capacity Using Cone
Penetration Test Data
P. Heidari1 and M. Ghazavi2*
1. Graduate M.Sc., Faculty of Civil Engineering, K N Toosi University of Technology, Tehran, Iran 2. Professor, Faculty of Civil Engineering, K N Toosi University of Technology,Tehran, Iran
Corresponding author:[email protected]
ARTICLE INFO ABSTRACT
Article history:
Received: 19 January 2018 Accepted: 16 April 2018
The massive construction in poor lands has encouraged engineers to use deep foundations in order to transfer superstructure loads to the subsoil. Since soil excavation, sampling, and laboratory testing as a part of site investigation are relatively difficult, in-situ tests such as cone penetration test (CPT) as a very informative test may be recommended. The CPT has been widely used in engineering as a part of site investigation, and its data has been used to determine the axial capacity of piles. In this paper, the prediction capability of three empirical widely famous old methods used to predict the axial pile capacity based on CPT data is evaluated by using field data obtained from direct field pile loading tests. In this evaluation, the direct pile load test results are used as measured data. Three popular famous statistical evaluation methods namely the best-fitted line, geometric mean, and geometric standard deviation have been used. The evaluation results indicate that generally although predicting methods based on CPT data have been widely used to determine the axial bearing capacity of piles, they need to be upgraded for the economic and relatively accurate design of piles. According to the statistical studies carried out in the current research, among three old empirical methods, although the Nottingham and Schmertmann Method (1975, 1978) (NSM) [7, 8] has the best agreement with test results, it is felt that the method needs to be upgraded. The modification of NSM has been done in the current paper using a comprehensive database.
Keywords:
Statistical Methods,
Cone Penetration Test (CPT), Static Pile Load Test, Axial Pile Capacity, Statistical Methods.
1. Introduction
Determining pile bearing capacity always has been a challenge task for geotechnical
Pile foundations are designed according to site investigation data. The investigation based on soil sampling and laboratory testing is quite difficult, and in-situ tests may be preferable and recommended. Among these tests, CPT is relatively widespread in investigating the subsoil. From this test, cone tip resistance and skin friction are measurable, as well as by integration of piezoelectric elements with an electrical penetrometer. The pore water pressure can also be determined. The CPT is simple, fast and, economical, and generates continuous information along the depth [3] and can be a model of pile [1]. Indirect and direct CPT-based methods are two main approaches which can be used to accomplish true resistances of pile shaft and toe [1].
The CPT and CPTU have three main applications in the site investigation to determine sub-surface stratigraphy and identify soil type, estimate geotechnical parameters to provide results for direct geotechnical design [2]. Contrary to analyses of piles based on theoretical models which need laboratory testing data, the CPT data may be preferable since the CPT has similarity with piles. In fact, determining the bearing capacity of a pile from the CPT information is one of its first applications [4].
To determine the axial pile capacity, the CPT is performed, and results are presented graphically along the depth. These results can be used directly and indirectly to determine the bearing capacity of piles. The direct use involves the establishment of relationships between the cone tip resistance and the unit toe resistance of piles, as well as relationships between the skin friction obtained from CPT and the skin friction of piles, which are more common among engineers [5]. Usually, direct methods that
use CPT data for a pile design have a fairly good fit with the practical results for the capacity of different piles compared with indirect methods.
The purpose of this paper is first to evaluate the capability of three old methods widely used in practice to predict the axial pile capacity based on CPT data and second quantify the best method among three. It is noted that more efficient and accurate methods have been developed in recent years, for example, a method developed by Eslami and Fellenius (1997). However, the current research does not intend to evaluate all CPT-based empirical methods, although this is of interest for further research. As mentioned before, the main aim of this research is to evaluate three old widely used methods and quantify the best one. This is because these three methods developed initially by famous people are still in use by practicing engineers and they still appear in the literature, despite they have low accuracy, as will be shown subsequently. To this aim, thirty-one case histories have been collected from full-scale field tests as measured data. Then three popular direct methods predicting pile capacity from CPT data are used.
In the current research, the best method is introduced based on the statistical evaluation. Finally, some corrections are made to enhance it for more accurate prediction of axial pile capacity based on CPT data.
2.
Cone
Penetration
Testing
Methods for Determination of Pile
Bearing Capacity
2.1. Aoki & Velloso Method (1975) [6]
tests. The design equation for estimating the bearing capacity of piles were proposed, according to some of the experimental factors obtained for different types of pile and soil from the loading test results, which is applicable to all types of piles and all types of soil. The unit skin friction of the piles is obtained from Eq. (1) [6]:
fb =
qca(side).αs
Fs ≤ 120kPa
(1)
Where αsis in percent and depends on the soil type, given in Table 1 and qca(side) is the mean of cone side resistance at the length of pile in kPa, and Fs is the dimensionless coefficient, which depends on pile type and is shown in Table 2.
Table 1. Values of αs based on the soil types [6]. Soil Type
αs(%)
Sand 1.4
Silty Sand 2
SandySilt 2.2
Sand with Clay or Sandy Clay 2.4
Clay-Sand-Silt mix 2.8 - 3
Clayey Silt 3.4
Silty Clay 4
Clay 6
Table 2. Values of Fs based on the pile types [6]. pile type
Fs
Drilled shafts 7
Driven cast-in-situ 5
Steel and PCC 3.5
The value of the unit toe resistance of pile is obtained by using Eq. (2) [6]:
qb =qca(tip)
Fb ≤ 15MPa (2)
In which the empirical factor of Fb depends on the pile type and given in Table 3, and
qca(tip) is the mean of the cone tip resistance in the specific range of the pile length in kPa.
Table 3. Values of Fb based on the pile types [6]. pile type
Fb
Drilled shafts 3.5
Driven cast-in-situ 2.5
Steel and PCC 1.75
2.2. Nottingham and Schmertmann Method (1975, 1978) (NSM) [7, 8]
This method was introduced by Nottingham (1975) [7] based on a summary of the model of piles and real piles and then presented as instruction in 1978 by Schmertmann [8]. The unit tip resistance of pile in sand and clay is considered to be equal to the mean of cone resistance. The actual value depends on the distribution of the 𝑞𝑐 values to the depth. The averaging range of this region is assumed to be due to the failure of a spiral logarithmic sample at the pile tip, similar to the Begemann Method (1961). The upper limit of 12 MPa applies to the pile tip resistance. The unit side resistance of the pile is determined from the cone side (qs) as Eqs. (3a) and (3b) [7, 8], respectively:
fb = αs. qs ≤ 120 kPa (3-a)
fb= αc. qs (3-b)
Fig. 1. Design curves for fs of pile in sand [7, 8].
Fig. 2. Design curves for fs of pilein clay [7, 8]. In sand, it is also possible to determine the unit side resistance of pile from the cone tip resistance by using Eq. (4) [7, 8]:
fb = C. qc ≤ 120 kPa (4) Where C is a non-dimensional coefficient which is the function of pile type and varies from 0.8 to 1.8%, and 𝑞𝑐 is the cone tip resistance in kPa.
The amount of the unit side resistance of the casting piles is reduced by 25% of the calculated unit side resistance of the driven piles. The unit toe resistance of pile in the sand is also calculated from Eq. (5) [7, 8]:
qb = qc1+ qc2
2 ≤ 15 MPa
(5)
In silty sand, Eq. (6) is used [7, 8]:
qb = qc1+ qc2
2 ≤ 10 MPa
(6)
The minimum values of qc1are the average of qc in the range of 0.7d to 3.75d below the pile tip and the minimum values of qc2are the average of qc in the range of 8d above the pile tip, where d is the pile diameter [7, 8].
2.3. Philipponant Method (1980) [9]
Philipponant tried to design a simple method based on the direct use of CPT results to design piles in a wide range of different types of pile and soil. He calibrated his method by using 44 data including various types of instrumentation piles and loading tests performed on different soil. The proper coefficients for design equations for estimating the unit side resistance of piles in different types of soil and pile were introduced. Also, the values of the unit side resistance of pile were limited by the pile type. The unit toe resistance of pile is averaged in the range of 3d below and above the pile tip according to Eq. (7) [9]:
fb= qca(side). αs
Fs ≤ fs(max)
(7)
Where αs is a dimensionless coefficient depending on the pile type and implementation and the αs value is given in Table 4. Fs, which depends on the soil type, is given in Table 5 and fs(max) is also dependent on the pile type and is presented in Table 6.
Table 4. Values of αs based on Pile types and implementations [9].
Pile type and implementation
αs
Driven PCC piles and drilled shaft with casing 1.25
Drilled shaft (d< 1.5 m) 0.85
Drilled shaft (d> 1.5 m) 0.75
H-piles (circumscribed perimeter) 1.1
Driven/jacked steel pipe piles 0.6
Table 5. Values of Fs based on soil types [9]. Soil Type
Fs
Clay and Calcareous Clay 50
Silt, Sandy Clay, and Clayey Sand 60
Loose Sand 100
Medium Dense Sand 150
Dense Sand and Gravel 200
Table 6. Maximum allowable values of unit side
resistance of pile [9].
pile type and implementation
fs(max)
Driven PCC piles, H-piles (circumscribed perimeter) and drilled shaft with casing 120
Drilled shaft (d< 1.5 m) 100
Drilled shaft (d> 1.5 m) 80
Driven/jacked steel pipe piles 50
OE steel pipe pile 25
The value of the unit toe resistance of a single pile can also be calculated by using Eqs. (8) and (9) [9]:
qb= Kb. qca(tip) (8)
Where, Kb is a dimensionless coefficient depending on the soil type and given in Table 7.
Table 7. Values of Kb based on soil types [9]. Soil Type
Kb
Gravel 0.35
Sand 0.4
Silt 0.45
Clay 0.5
qca(tip) = qc1+ qc2 2
(9)
In Eq. (9), the values of qc1 and qc2 are equal to the average of cone tip resistance in the range of 3d below and above of pile tip [9]. Parameter d is the pile diameter.
3. Review of Direct Methods Based
on CPT Data for Determination of
Axial Pile Capacity
Gianeselli and Bustamante (1982), Robertson (1988), and Eslami and Fellenius (1997) studied a large number of piles and had shown that conventional direct methods based on CPT had a relatively more precise ability to predict the axial capacity of piles compared with other pile test methods. In methods that arithmetic mean was used for determination of the axial capacity of piles, filtering the initial data of CPT had been used which result in the elimination of the maximum and minimum values that change the data [4]. Also, in methods where pore pressure was not involved, the cone tip resistance for the pore pressure in the pentameter was not corrected. Thus, the information used was coincident with the error, which was small for sand and could be large for clay and silt [4].
4. Information about the Piles and
the Profiles of the Soil From the
CPT
Table 8. Details of piles and soil profiles.
(a) Databases used for the initial assessment
No. Case Reference locationSite
Pile shape and
material
Pile diameter, d
(mm)
Embedment
length, L (m)
Total capacity,
Rult (kN)
Soil profile
1 L & D 34 Briaud et al. (1989)[14] Ill.,U.S.A. Pipe, Steel 360 14.4 1300 Sand
2 L & D 37 Briaud et al.
(1989)[14] Ill.,U.S.A. Pipe, Steel 400 14.6 1800 Sand
3 A & N 1 Haustorfer and
Plesiotis (1988)[12] Australia
Square,
Concrete 450 14 3850
Dense Sand, Lime Stone
4 MP1 Weber, 1987[15] France H pile, Steel 400 14 2125 Soft Clay, Stiff Clay
5 UBC 3 Campanella et al. (1989)[17] Canada B.C., Pipe, Steel 324 16.8 630 Soft Clay, Sand
6 UBC 5 Campanella et al. (1989)[17]
B.C.,
Canada Pipe, Steel 324 31.1 1100
Soft Clay, Sand, Silt
7 NWUP Finno, 1989[18] Ill.,U.S.A. Pipe, Steel 450 15.2 1020 Sand, Clay
8 UBCA Campanella et al. (1989)[17] Canada B.C., Pipe, Steel 915 67 7500 Soft Clay, Sand, Silt
9 A & M 69 Briaud et al. (1989)[14]
Mass., U.S.A.
Square,
Concrete 400 19.2 1780 Clay
10 LAHW 1-T4 Rauser (2008)[19] U.S.A. La., Concrete Round, 610 49 3834 Clay
11 KLO 14B Van Impe et al. (1988)[20] Belgium Concrete Round, 600 12 6100 Sand
12 OKLACO Neveles and Donald (1994)[21] U.S.A. Okla., Concrete Round, 610 18.2 3600 Sand
13 AZADEGAN TP22
Attar and Fakharian
(2013)[22] Iran
Square,
Concrete 400 12.7 1050 Silty Clay
14 AZADEGAN TP24 Attar and Fakharian (2013)[22] Iran Concrete Square, 400 15.9 1850 Silty Clay
(b)Databases used for modification of NSM
No. Case Reference locationSite
Pile shape and material
Pile diameter,
d (mm)
Embedment length, L (m)
Total capaciy,
Rult (kN)
Soil profile
1 BGHD 1
Altaee et al. (1992a, 1992b)[10,11]
Iraq Concrete Square, 285 11 1000 Sand
2 BGHD2
Altaee et al. (1992a, 1992b)[10,11]
Iraq Square,
Concrete 285 15 1600 Uniform Sand
3 A & N1
Haustorfer and Plesiotis (1988)[12]
Australia Concrete Square, 450 14 3850 Sand
4 A & N2
Haustorfer and Plesiotis (1988)[12]
Australia Square,
Concrete 450 13.7 4250 Sand
5 UFL 22 Avasarala et al. (1994)[13] Fla.,U.S.A. Concrete Square, 350 16 1350 Sand
6 UFL 52 Avasarala et al. (1994)[13] Fla.,U.S.A. Concrete Square, 500 11 2070 Sand
7 LSUR 30
Tumay and Fakhroo (1981)[16]
Calif., U.S.A.
Square,
Concrete 750 19.8 2610 Fill, Sandy Clay
8 UFL 53 Avasarala et al.
(1994)[13] Fla.,U.S.A.
Square,
Concrete 350 20.4 1260 Sand, Silt 9 A & M 24 Briaud et al.
(1989)[14]
Mass., U.S.A.
Square,
Concrete 400 13.4 1170 Silty Sand 10 A & M 40 Briaud et al.
(1989)[14]
Mass., U.S.A.
Square,
Concrete 350 16 1070 Sand
11 A & M 49 Briaud et al. (1989)[14]
Mass., U.S.A.
Square,
Concrete 400 12.5 1170 Sand 12 A & M 66 Briaud et al.
(1989)[14]
Mass., U.S.A.
Square,
Concrete 350 25 1560 Sand
(c) Databases used for validation of modified NSM.
No. Case Reference locationSite
Pile shape and material
Pile diameter,
d (mm)
Embedment length, L (m)
Total capacity,
Rult (kN)
Soil profile
1 A & N3
Haustorfer and Plesiotis (1988)[12]
Australia Concrete Square, 355 10.2 1300 Sand
2 FITTJAA Axelsson
(1998)[23] Sweden
Square,
Concrete 235 19 560 Sand
3 A & M 30 Briaud et al. (1988)[14]
Mass., U.S.A.
Square,
Concrete 450 15 1420 Sand
4 A & M 48 Briaud et al. (1989)[14]
Mass., U.S.A.
Square,
5.
Evaluation
of
CPT-Based
Methods Predicting Axial Pile
Capacity
5.1. The Equation of the Best-Fitted Line
In this section, 15 databases from Table 8-a have been selected, and the values of ultimate capacity of piles estimated (QE) from some CPT based methods are compared with those measured (Qm) by static loading
tests for different types of soil. Then, the best-fitted line, perfect-fitted line and the regression coefficient for 𝑄𝐸 versus 𝑄𝑚 have been illustrated (Figs. 3-5). This equation does not necessarily cross all data and in fact, is the best close to all data. According to this statistical method, the three methods of Aoki and Velloso (1975), NSM (1975, 1978) and Philipponant (1980) are evaluated in Figs. 3-5, respectively. The final results have been illustrated in Table 9.
Based on this statistical evaluation, the results show that the NSM is the best method among other two methods with R² = 0.9786 and 𝑄𝐸⁄𝑄𝑀 = 1.0055.
Fig. 3. Estimated (𝑄𝐸) ultimate pile capacity based on Aoki and Velloso method (1975) [6]
versus measured (𝑄𝑚) value.
Fig. 4. Estimated (𝑄𝐸) ultimate pile capacity based on the NSM (1975, 1978) [7, 8] versus
measured (𝑄𝑚) value.
Fig. 5. Estimated (𝑄𝐸) ultimate pile capacity based on Philipponant method (1980) [9] versus
measured (𝑄𝑚) value.
6. Geometric Mean and Geometric
Standard Deviation for
𝑸
𝑬⁄
𝑸
𝒎In this method, the geometric mean and the standard deviation of QE/Qm are determined.
The geometric mean in mathematics is equal to the nth root of the product of n variables and in statistical knowledge, the arithmetic mean is the average of the values in a set of data. In this paper, for evaluating the accuracy of the predicting CPT based methods, both arithmetic and geometric means were used. It was noted that the geometric mean was more precise than the
QE = 1.1192Qm R² = 0.836
0 1500 3000 4500 6000 7500 9000
0 1500 3000 4500 6000 7500 9000
Estim
ated
Pile
Cap
acity
KN
Measured Pile Capacity KN
QE = 1.0055Qm R² = 0.9786
0 1500 3000 4500 6000 7500 9000
0 1500 3000 4500 6000 7500 9000
Estim
ated
Pile
Cap
acity
KN
Measured Pile Capacity KN
QE = 1.0977Qm R² = 0.8159
0 1500 3000 4500 6000 7500 9000
0 1500 3000 4500 6000 7500 9000
Estim
ated
Pile
Cap
acity
KN
arithmetic mean. Therefore, the geometric mean was taken as the basis. The evaluation of the precision of the CPT-based methods, according to these statistical methods, is that if the geometric mean of QE/Qm is closer to
the unity, it means that the calculated ratio will be more accurate.
In statistics, the geometric standard deviation is one of the indicators of dispersion. If the standard deviation of the set of data is close
to zero, it indicates that the data are closer to the geometric mean and have little dispersion, while the large standard deviation represents the significant dispersion of the data [24].
The results presented in Table 9 show that in different types of soil, the NSM (1975, 1978) has the least error and the highest matching and is in the priority and has been indicated with green color in this table.
Table 9. Final results of statistical evaluation of CPT-based methods.
All soils The best-fitted line for 𝑄𝐸 versus
𝑄𝑚
Geometric mean and standard deviation for 𝑄𝐸⁄𝑄𝑚
Final Priority
The CPT-based
Methods 𝑅2 𝑄𝐸⁄𝑄𝑚 𝑅1* Geometric mean deviation standard 𝑅2** RI*** Rank Final Aoki & Velloso
(1975) [6] 0.8360 1.1192 2 0.9385 0.3191 2 4 2 NSM (1975,
1978) 0.9786 1.0055 1 0.9658 0.1815 1 2 1
Philipponant
(1980) 0.8159 1.0977 3 0.8976 0.3686 3 6 3
* Ranking based on the best-fitted line
** Ranking based on the geometric mean and standard deviation *** Rank index
7. Modification of Nottingham and
Schmertmann (1975 and 1978)
Method (NSM)
According to three statistical methods used to evaluate the accuracy of three direct methods based on 15 CPT data from Table 8-a for determination of the capacity of piles, it was shown that the NSM has higher accuracy and less error than other methods in different types of soil and pile. Thus, it is fruitful to enhance the NSM. Due to the existence of more databases in sandy soil and square concrete piles, this method is here modified for square concrete piles installed in sandy soil.
To enhance the NSM, a more refined coefficient is defined to determine the unit
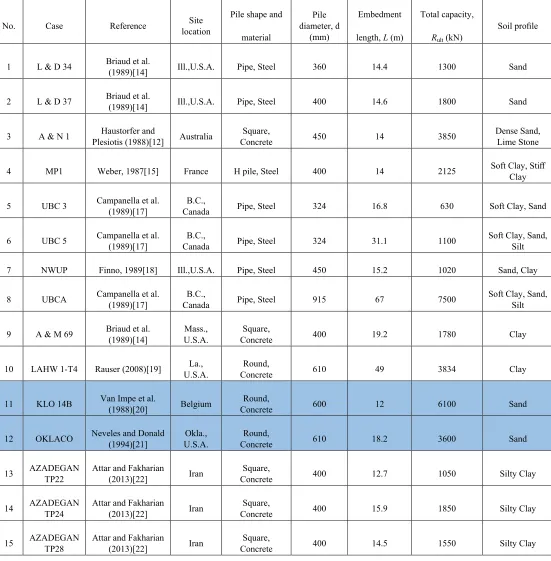
resistance of pile, which is a function of the ratio of the depth to the diameter of pile. To this aim, the authors used available data in Table 8-b and had found that this coefficient can be modified in sandy soil. Therefore, Fig.1 is corrected and modified to Fig.6.
Fig. 6. Modified coefficient 𝑓𝑠 for design of square concrete piles installed in sand.
0 0.1 0.2 0.3 0.4 0.5 0.6 0.7 0.8 0.9
0 2 0 4 0 6 0 8 0
PENE
TROME
TE
R
PIL
E
-FRICTION
RATIO
Z/D Corrected
In Fig. 6 the NSM graph is not the same as the original one in Fig. 1 because of the lack of database but this graph is overlapping with the original graph.
8. Comparison of NSM (1975, 1978)
with the Present Modified Method
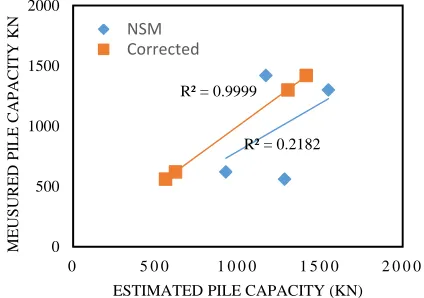
Regarding the correction of the coefficient for determination of pile unit resistance, it is possible to evaluate this modified method and calculate the percentage increase in its accuracy as compared to the initial NSM by the database in Table 8-c. The accuracy of the modified method with the initial NSM is compared in Fig. 6 by plotting the best-fitted line. According to the regression coefficient of 0.9999 and 0.2182 for the present modified method and the initial NSM, respectively, Fig. 7 shows that the modified NSM results in a remarkable improvement. The percentage of improvement is about78%. This means that the modified method is able to decrease the percentage difference between the estimated and measured capacity of square concrete piles driven in sand. The reason for the value of 0.2182 for R2 in NSM is actually the lack of database for square
concrete piles in sandy soil for evaluation and this is a problem experienced by the authors.
Fig. 7. Comparison of measured and estimated
pile bearing capacity obtained from initial NSM (1975, 1978) and the present modified method
for square concrete piles installed in sand. As a sensible example to clarify to what extent the present modified method is able to predict the axial pile capacity more accurately than the initial NSM, a driven square concrete pile with a width of 285 mm and a length of 15 m installed in a sandy soil profile is considered. Fig. 8 shows the CPT profile data and Fig. 9 illustrates the load-settlement response of the pile obtained from performing field static load test, as reported by Altaee et al. (1992a, 1992b) [10, 11].
R² = 0.2182 R² = 0.9999
0 500 1000 1500 2000
0 5 0 0 1 0 0 0 1 5 0 0 2 0 0 0
ME
USURED
PIL
E
CAPAC
IT
Y
KN
ESTIMATED PILE CAPACITY (KN)
Fig. 8. CPT profile in sandy soil [10, 11].
Fig. 9. Load-displacement diagram of Square
Concrete pile in sandy soil [10, 11]. The axial capacity of this pile is 1600 kN from field data interpretation provided in Fig. 9 [10, 11]. According to the initial NSM, the predicted axial pile capacity is 1717.4 kN from CPT data. The present modified approach gives 1590 kN for the axial pile capacity which is very close to the field actual data. This means that the initial NSM overestimates the pile capacity up to about 117.4 kN whereas the present modified approach only predicts about 10 kN less than the measured axial pile capacity. Therefore, the present approach predicts the pile
capacity more precisely than the initial NSM, leading to more economical design.
9. Summary and Conclusions
In geotechnical engineering, due to difficulties, uncertainties, and disturbance of soil in site investigation, the CPT is preferable than conventional sampling and laboratory testing. Since the CPT is similar to piles, its results can be confidently applied to piles. The CPT results can be directly and indirectly used in geotechnical engineering. Direct use of this method is preferable because of the lack of need for laboratory tests, and determination of geotechnical parameters and data are closer to reality. Therefore, a series of direct methods based on the CPT have been presented to estimate the pile bearing capacity in different soil, each of which has some strengths and weaknesses.
In this paper, to evaluate and examine the methods, a series of analyses were conducted
0
5
10
15
20
25
0 20 40
Z (m
)
qc (MPa)
0
5
10
15
20
25
0.0 0.5 1.0
fs (MPa)
0
5
10
15
20
25
-0.10 0.00 0.10 0.20 u (MPa)
0 200 400 600 800 1000 1200 1400 1600 1800
0 10 20 30 40
L
o
ad
(k
N
)
to determine the method with greater accuracy. The three statistical analyses used to evaluate the performance of the CPT-based methods are the best-fitted line, geometric mean and standard deviation. The evaluation of three CPT-based methods has been done by comparing the estimated ultimate pile bearing capacity from CPT-based methods and the ultimate pile bearing capacity measured by static loading test with three statistical analyses. Finally, according to the ranking index, each was ranked separately according to their precision. The NSM with rank one for piles in different types of soil had the best rank. This method also has some weaknesses and strengths that cause errors in pile capacity estimation. This method has been upgraded with regard to the database for square concrete piles embedded in sandy soil. This study showed that by using the CPT data, the bearing capacity of piles could be estimated with sufficient accuracy. The purpose of this paper is to modify and improve the conditions within the range of static load transfer analysis based on local experiments using the CPT data. As a result of a series of analyses, a method with higher accuracy and less error is presented.
To determine optimum axial pile capacity, it may be necessary to perform CPT and CPTu as a complementary test. Various methods have been developed to determine the axial pile capacity from CPT and CPTu data. According to statistical methods, although these methods can predict pile capacity with sufficient accuracy from CPT data, it is still necessary to increase their accuracy. The present statistical evaluation has shown that to predict the axial capacity of piles installed in the mixture of soil, the NSM (Nottingham and Schmertmann, 1975 and1978) with QE
/QM= 1.0055 ratio, a regression of 0.9786,
the standard deviation of 0.1815, and the geometric mean of 0.9658 is more accurate than other methods. Despite this, the NSM has been upgraded in the present research to predict axial pile capacity with 78% more accurate and precision than the initial NSM, leading to a remarkable cost saving in pile foundation design. Number 78% is a large difference, and it is because of lack of databases for square concrete piles in sandy soil for comparing the modified approach to the old NSM. But it can be inferred from this number more agreement of modified approach than old one with the real condition.
REFERENCES
[1] Eslami, A., Valikhah, F., Veiskarami, M., and Salehi, M. (2017). “CPT-based investigation for pile toe and shaft resistances distribution.” Geotechnical and Geological Engineering Journal, Vol. 35, pp. 2891-2905.
[2] Cai, G., Liu, S., and Puppala, A.J. (2015). “Comparative performance of the international piezocone and China CPT in Jiangsu Quaternary clays of China.” Transportation Geotechnics Journal, Vol. 3, pp.1-14.
[3] Powell, J., Lunne, T. and Frank, R. (2011). “Semi-empirical design for axial pile capacity in clays.” In Proceedings of 15th International Conference on Soil Mechanics and Geotechnical Engineering, pp. 991-994, Istanbul, Balkema, Rotterdam, the Netherlands.
[6] Aoki, N. & Velloso, D. (1975). “An approximate method to estimate the bearing capacity of piles.” In Proceedings of 5th Pan-American Conference of Soil Mechanics and Foundation Engineering, pp. 367-376, Buenos Aires.
[7] Nottingham, L. (1975). “Use of quasi-static friction cone penetrometer data to predict load capacity of displacement piles.” Ph.D. Thesis, University of Florida.
[8] Schmertmann, J. (1978). “Guidelines for cone penetration test, performance and design.” U.S. Department of Transportation, Washington, D.C.
[9] Philipponnat, G. (1980). “Methode pratique de calcul d'un pieu isole a l'aide du penetrometre statique.” Vol. 10, pp.55-64, Revue Française.
[10] Altaee, A., Fellenius, B.H., and Evgin, E. (1992a). “Axial load transfer for piles in sand.” I. Tests on an instrumented precast pile, Canadian Geotechnical Journal, Vol. 29, pp.11–20.
[11] Altaee, A., Evgin, E., and Fellenius, B.H. (1992b). “Axial load transfer for piles in sand.” II. Numerical analysis, Canadian Geotechnical Journal, Vol. 29, pp. 21–30. [12] Haustorfer, I.J., and Plesiotis, S. (1988).
“Instrumented dynamic and static pile load testing at two bridges.” In Proceedings of the 5th Australia –New Zealand Conference on Geomechanics, Prediction versus Performance, pp. 514–420, Sydney, August 22–28.
[13] Avasarala, S.K.V., Davidson, J.L., and McVay, A.M. (1994). “An evaluation of predicted capacity of single piles from SPILE and UNIPILE programs.” In Proceedings of the FHWA International Conference on Design and Construction of Deep Foundations, Vol. 2, pp. 712–723, Orlando, Fla., December 7–9.
[14] Briaud, J.L., Moore, B.H., and Mitchell, G.B. (1989). “Analysis of pile loading tests at Lock and Dam 26.” In ASCE Proceedings of the Foundation Engineering Congress: Current Principles and Practices,
Evanston, Ill., Edited by F.H. Kulhawy, American Society of Civil Engineers, Geotechnical Special Publication 22, Vol. 2, pp. 925–942, June 25–29.
[15] Weber, L. (1987). “Efficiency improvement of steel H-bearing piles.” Arbed Research, Final Report 7210.SA/503.
[16] Tumay, M.T., and Fakhroo, M. (1981). “Pile capacity in soft clays using electric QCPT data.” In Proceedings of a Conference on Cone Penetration Testing and Experience, pp. 434–455, St. Louis, Mo., October 26– 30.
[17] Campanella, R.G., Robertson, P.K., Davies, M.P., and Sy, A. (1989). “Use of in-situ tests in pile design.” In Proceedings of 12th International Conference on Soil Mechanics and Foundation Engineering (ICSMFE), Vol. 1, pp. 199–203, Rio de Janeiro, August 13–18.
[18] Finno, R.J. (1989). “Subsurface conditions and pile installation data.” In Proceedings of a Symposium on Predicted and Observed Behavior of Piles, Evanston, Ill., American Society of Civil Engineers, Geotechnical Special Publication 23, pp. 1–74, June 30.
[19] Rauser, J. G. (2008). “In-situ and nondestructive test methods applied to the design and construction of pile foundation projects in coastal Louisiana.” LSU Master's Theses.
[20] Van Impe, P.O. (1999). “Consolidation of saturated, highly compressible porous media.” MSc Thesis, Faculty of Engineering, UGent, (in dutch).
[22] Attar, I. and Fakharian, K. (2013). “Influence of soil setup on shaft resistance variations of driven piles: Case study.” International Journal of Civil Engineering, Vol. 11, pp. 112-121.
[23] Axelsson, G. (1998). “Long-term increase in shaft capacity of driven piles in sand.” In Proceedings of Fourth International
Conference on Case Histories in Geotechnical Engineering, pp. 301-308, Missouri, March 9-12.
![Fig. 2. Design curves for fs of pile in clay [7, 8].](https://thumb-us.123doks.com/thumbv2/123dok_us/8957592.1866960/4.612.73.293.73.371/fig-design-curves-fs-pile-clay.webp)
![Table 5. Values of Fs based on soil types [9]. Soil Type](https://thumb-us.123doks.com/thumbv2/123dok_us/8957592.1866960/5.612.66.301.73.164/table-values-fs-based-soil-types-soil-type.webp)
![Fig. 4. Estimated (based on the NSM (1975, 1978) [7, 8] versus](https://thumb-us.123doks.com/thumbv2/123dok_us/8957592.1866960/8.612.75.287.483.634/estimated-based-versus-ultimate-capacity-measured.webp)
![Fig. 8. CPT profile in sandy soil [10, 11].](https://thumb-us.123doks.com/thumbv2/123dok_us/8957592.1866960/11.612.124.493.80.336/fig-cpt-profile-sandy-soil.webp)
