R E S E A R C H A R T I C L E
Open Access
Child assessments of vegetable preferences
and cooking self-efficacy show predictive
validity with targeted diet quality measures
Melissa Pflugh Prescott
1*, Barbara Lohse
2, Diane C. Mitchell
3and Leslie Cunningham-Sabo
4Abstract
Background:Cooking interventions have the potential to improve child diet quality because cooking involvement is associated with positive changes in dietary behavior. Valid and reliable instruments that are low-cost and convenient to administer are needed to feasibly assess the impact of cooking interventions on dietary behavior. The purpose of the current research is to examine the validity of fruit and vegetable preferences, cooking attitudes and self-efficacy assessments to predict targeted Healthy Eating Index-2010 (HEI) scores among 4th-grade youth. Methods:Child fruit and vegetable preferences, cooking attitudes, self-efficacy, age, sex and race/ethnicity were collected with theFuel for Funsurvey in classroom settings using a standardized administration protocol. Child dietary assessment data consisted of three 24-h dietary recalls collected by telephone over a 2–4 week period by trained interviewers using a standard protocol. Bootstrapped linear regressions examined the predictive validity of fruit and vegetable preference, cooking attitudes and cooking self-efficacy for the Total and 4 targeted HEI components: whole fruit, total vegetables, green vegetables and beans, and empty calories. Logistic regressions
were used to confirm the relationships betweenFuel for Funsurvey items and HEI components. Sex and a
categorical variable for race/ethnicity were included as a priori controls in each regression model.
Results:Vegetable preference predicted positive associations with HEI Total Score, Total Vegetables, and Green Vegetables and Beans (p< 0.05) Each additional 2 point increase in cooking self-efficacy was associated with a 1.33 point HEI Score increase, even after including BMI z-score as a control (b = 0.667,p= 0.003). Fruit preference and cooking attitudes did not significantly predict HEI total or component scores.
Conclusions:This study provides evidence that low-cost, validated measures of vegetable preferences and cooking self-efficacy predict diet quality in 4th grade children. These results also reinforce the relationship between cooking and healthful dietary behavior.
Keywords:Cooking, Youth, Diet assessment, Vegetable preference, Diet quality
Background
The diet quality of U.S. children remains an important public health concern. Even though solid fat and added sugar intakes have significantly decreased from 2003 to 2014 among 6–11 year olds [1], the vast majority of American children exceed the recommended intake for empty calories and fail to meet the recommendations for total vegetables, total fruit and dark green vegetables [2].
The 2015 Dietary Guidelines for Americans encourages increasing vegetable and fruit intake and reducing the consumption of solid fats and added sugars. Further-more, higher intakes of vegetables and fruit were the only diet characteristics that were consistently identified in the Advisory Committee’s investigation of the associa-tions between dietary patterns and key beneficial health outcomes in the 2015 Dietary Guidelines for Americans Advisory Report [3].
Cooking interventions have the potential to improve child diet quality because cooking involvement is associ-ated with positive changes in dietary behavior [4–8]. * Correspondence:[email protected]
1Department of Food Science and Human Nutrition, University of Illinois at
Urbana-Champaign, 905 S. Goodwin Ave, MC-182, Urbana, IL 61801-3896, USA
Full list of author information is available at the end of the article
Canadian children who cook at home consume more fruits and vegetables, on average, compared to children who are not involved with cooking at home [5]. Children who participated in the LA Sprouts cooking and garden-ing intervention increased their fiber intake by 22%, compared to a 12% reduction among controls (p= 0.04) [9]. In the UK, 9 to 11 year old children had increased vegetable consumption and cooking confidence after participating in a culinary education intervention [4].
Valid and reliable instruments are required to accurately assess the impact of cooking interventions on dietary behav-ior and diet quality. A variety of dietary assessment tools can be used to comprehensively and quantitatively evaluate food and beverage intake but many of these measures are resource intensive [10] and often too expensive especially for larger samples [11]. The 24-h recall is considered the least biased of the self-reported methods [12] and is generally considered the best method for assessing children’s diets. Regardless of the method, the challenges and cost associated with detailed quantitative measures of child diet to assess diet quality sug-gest a need for more feasible proxy measures that could be administered in studies with large samples. Any proxy meas-ure of child diet quality would need to validated relative to gold-standard reference methods such as multiple pass 24-h recalls [4]. Criterion-related validity assesses how closely scores from a new measure relate to the scores from the ref-erence measure. Predictive validity, one form of criterion val-idity, is used when scores from the new measure are used to predict the scores on a criterion measure that is administered at a later point in time, rather than concurrently [13].
Fruit and vegetable preference [6,8,14,15], cooking at-titudes [14,15], and cooking self-efficacy [4,6,14,15] are common outcome measures for child cooking interven-tions that can be feasibly collected using validated and re-liable tools and would be appropriate to test as potential proxies for diet quality. According to research completed in 1996 by Domel et al and 1997 by Resnicow et al, fruit and vegetable preferences significantly predict fruit and vegetable consumption, [16, 17]. No studies have exam-ined the predictive validity of fruit and vegetable prefer-ence for diet quality relative to 24 h dietary recalls, and the relationships between cooking attitudes and cooking self-efficacies and diet quality are not well understood.
The purpose of this cross-sectional study was to exam-ine the validity of fruit and vegetable preferences (FP, VP, FVP), cooking attitudes (AT) and self-efficacy (SE) as-sessments to predict diet quality among Colorado 4th-graders participating in Fuel for Fun: Cooking with Kids Plus Parents and Play(FFF).
Methods
Setting and participants
FFF is a cooking-focused, classroom-based intervention to improve 4th-grade student’s dietary attitudes and
behaviors by increasing their interest and skills in prepar-ing and tastprepar-ing a wide variety of fruit and vegetable-rich dishes [18]. A total of 1409 students across 8 public elem-entary schools from 2 school districts in the same North-ern Colorado county participated in FFF, and 996 of these students were offered the opportunity to participate in dietary assessment.
Data collection and measures
All data were collected at study baseline when the child was in 4th grade. Child FVP, FP, VP, AT, SE, age, sex and race/ethnicity were collected with the Fuel for Fun sur-vey in classroom settings using a standardized adminis-tration protocol [18]. FP and VP were assessed using 7 fruit and 11 vegetable preference questions, respectively. Each item had 5 response options, scored from 1 to 5. Scores of 7–35 were possible for FP and 11–55 for VP. FVP preference scores, determined by the sum of the fruit and vegetable preference scores, could range from 18 to 90. A 3 point increase in FVP is clinically signifi-cant [18]. Six items each with 5 response options, assessed cooking attitudes; possible scores ranged from 6 to 30. Eight items with 5 response options estimated cooking self-efficacy, with possible scores ranging from 8 to 40. A two point change in cooking attitudes or self-efficacy is considered clinically significant [18]. All items were previously confirmed for face and content validity and test-retest reliability [19].
After survey completion, Fuel for Fun survey partici-pants were recruited to participate in dietary assessment. Child dietary assessment data consisted of three 24-h dietary recalls collected by telephone over a 2–4 week period by trained interviewers using a standard protocol [18]. Data were collected using Nutrition Data System for Research (NDSR) software version 2013 and 2014 (Nutrition Coordinating Center, University of Minne-sota). Unannounced telephone interviews (approximately 20 min in duration) were conducted with both child and parent present on randomly selected days, with the goal of obtaining 2 weekdays and 1 weekend recalls. Only students with > 2 dietary recalls were included in this study to reduce random error associated with day-to-day dietary intake variability.
HEI scores signal a diet that aligns better with dietary recommendations [20].
Height and weight were measured by trained personnel using a standard protocol on the same day as survey admin-istration. Height was measured to the nearest tenth of a centimeter using a portable stadiometer (SECA, Model 213) and weight measured to the nearest tenth of a kilogram using a standard scale (Health o meter, Model 394KLX). As part of the protocol youth were instructed to remove their shoes and heavy clothing prior to measurement.
Data analysis
Health Eating Index 2010 scores were calculated from Nutrition Data Systems for Research generated output files for nutrients and food groups. Food group data from output files were converted from servings to ounce and cup equivalents and then expressed on per 1000 kcal basis. Criteria for minimum and maximum scores were used to create formulas to calculate 12 individual com-ponents scores and summed to calculate total HEI scores [21].
Predictive validity of FV preference, FP, VP, cooking AT and cooking SE for the Total and these 4 targeted HEI components were examined using linear regression analyses. The large number of HEI component scores at the upper and/or lower bounds required bootstrapping of linear regressions and logistic regressions. Logistic re-gressions were used to confirm the relationships be-tween FFF survey items and meeting the maximum score for HEI components. Sex and a categorical variable for race/ethnicity were included as a priori controls in each regression model. Each model was run a second time (Model 2) with the inclusion of BMI z-score as a covariate because it was a confounder. A p-value of less than 0.05 was considered statistically significant for linear regressions, and odds ratio (OR) 95% confidence intervals that did not cross 1.0 were considered statistically signifi-cant for logistic regressions.
Results
A total of 108 students completed at least one dietary recall, and 101 completed at least 2 dietary recalls. Of the 101 children who completed > 2 dietary recalls, 73% had one weekend day included in their dietary assess-ment. Differences in race/ethnicity, sex, or age between participants who completed only 1 dietary recall (n= 7) and those who completed 2 or more recalls (n= 101) were not significant, but participants completing only 1 recall had significantly higher SE (p= 0.050), AT (p= 0.026) and FP scores (p= 0.052). Children who had recall heterogen-eity in day type (i.e. included both weekend and weekdays) did not differ significantly in any of the targeted HEI out-comes nor the FFF survey measure predictor variables from those children with only weekday or weekend day
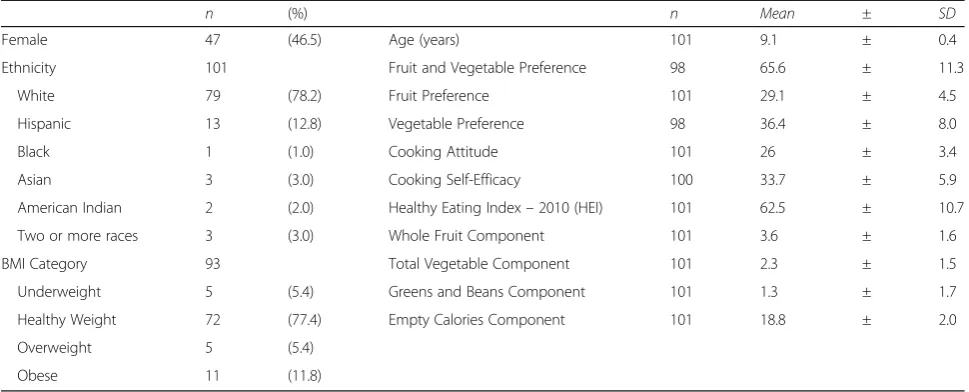
recalls. Participants (n = 101) were predominately white, non-Hispanic and at a healthy weight (mean BMI percent-ile 49.4 + 30.84, range 1.0 to 99.0). Demographic results, as well as student VP, FP, cooking AT and cooking SE are similar to youth in previous samples [15, 22]. Total HEI scores (possible range 0–100) ranged from 33.8–91.1 (Table1). HEI or survey scores did not differ by sex, with the exception of whole fruit score, which was greater in boys (p= 0.04) (Table1).
VP positively predicted HEI total, total vegetables, and greens and beans scores (p< 0.05). The relationship be-tween VP and total vegetable score tended toward sig-nificance once BMI z-score was added to the model (p = .09; Table 2). Each additional 2 point increase in cooking SE was associated with a 1.33 point HEI Score increase, even after including BMI z-score as a control (b = 0.667, p = 0.003). Cooking SE also positively pre-dicted total vegetable score (p= 0.008) and Whole Fruit (p = 0.031). The positive associations between cooking SE and whole fruit score persisted when BMI z-score was controlled. Cooking SE also predicted total vege-table score (p = 0.008) and tended toward significance in Model 2 (p= 0.059). FP and AT did not significantly pre-dict HEI total or component scores.
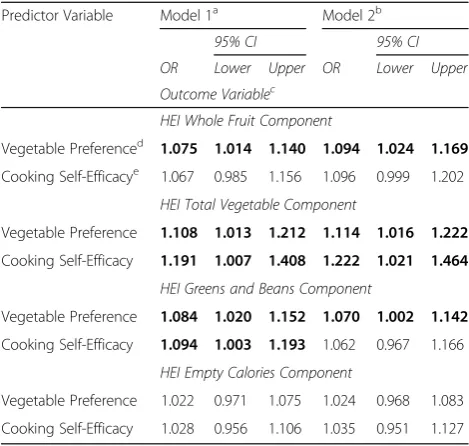
The relationships between Fuel for Fun survey items and targeted HEI components derived from linear re-gressions were largely consistent with the results from the logistic regression analysis (Table3). VP and cooking SE positively predicted total vegetable score. VP also positively predicted greens and beans score. The rela-tionship between cooking SE and Green Vegetables and Beans was also positive, but not significant once BMI z-score was added to the model. In addition to linear re-gression results confirmation, the relationship between VP and whole fruit score was also significant, which can be extrapolated to a 3 point increase in VP. A 3 point in-crease in VP inin-creased the odds of meeting whole fruit recommendations (i.e. consuming > 0.8 cup equivalents of whole fruit per 1000 kcal) by 30.9% (OR = 1.094, 95% CI: 1.024, 1.169).
Discussion
both fruit and vegetable preferences and consumption be-haviors [16,17,23]. Yet, the current study found a signifi-cant relationship between vegetable preference and overall HEI score, but fruit preference did not significantly predict any of the targeted HEI outcomes. This may be because of children’s inherent tendency for high fruit preferences, [24–26] which may limit the ability of fruit preference to be a proxy for overall diet quality.
Our findings that cooking SE predicts Total HEI, Total Vegetable and Whole Fruit scores extends the authors’ conclusions from a previous study, that reported prior cooking involvement predicts changes in fruit and vege-table preferences after a cooking intervention [15]. Add-itionally, the relationship between cooking SE and diet quality is consistent with the results of Caraher and col-leagues and Jarpe-Ratner and colcol-leagues. Both studies concluded that cooking SE and vegetable consumption significantly increased after school-based cooking inter-ventions, but both of these studies used a screener rather than dietary recalls to measure vegetable intake [4,6]. In the current study, we estimate that for every 3 point crease in cooking self-efficacy we expect a 82.5% in-crease in total vegetable score (OR = 1.222, 95% CI: 1.021–1.464), suggesting a positive relationship between child cooking self-efficacy and meeting the dietary guidelines for total vegetable consumption. However, the study design does not establish the temporality of this relationship.
Additional limitations include a relatively small sample size and challenges with dietary assessments. Domel et al’s 1996 assessment and Resnicow et al’s 1997 assess-ment of the relationship between FVP and fruit and
vegetable consumption featured 392 and 1398 partici-pants, respectively. However, the dietary intake of the 108 students included in our study was similar to na-tional averages [21], suggesting generalizability of our re-sults. The challenges of child dietary assessment have been previously discussed [10, 27, 28]. In addition, child diet assessment methods, including 24-h recalls, have been infrequently validated [27]. Having a parent present during the 24-h recall telephone interviews may have imparted some social desirability bias, but parent influ-ence was helpful in reminding their children of forgotten foods and portion sizes. The 24-h, multiple pass recall method is the best diet assessment available, but the method has inherent limitations, such as systematic and random error [12]. However, all students in the sample had two or more dietary recalls, reducing the influence of the random error associated with day-to-day variation in dietary intake [12]. Dietary recall invitations were planned so that diet assessments included weekday as well as weekend day intake. Both weekday and weekend day recalls occurred for 73% of participants. However, for any of the targeted HEI outcomes or FFF survey measure predictor variables the differences were not sig-nificant between children who had heterogeneity in day type (i.e. recalls included both weekend and weekdays) vs. those with only weekday or weekend day recalls. Lastly, the study sample had limited racial or ethnic di-versity. Future studies are needed to assess the predictive validity of these measures in more diverse populations.
This study has several strengths. The majority of re-sults were robust across two different analyses methods. Our sample had a slightly higher mean HEI (62.5 + 10.7) Table 1Characteristics of Fourth-Grade Students (n= 101)
n (%) n Mean ± SD
Female 47 (46.5) Age (years) 101 9.1 ± 0.4
Ethnicity 101 Fruit and Vegetable Preference 98 65.6 ± 11.3
White 79 (78.2) Fruit Preference 101 29.1 ± 4.5
Hispanic 13 (12.8) Vegetable Preference 98 36.4 ± 8.0
Black 1 (1.0) Cooking Attitude 101 26 ± 3.4
Asian 3 (3.0) Cooking Self-Efficacy 100 33.7 ± 5.9
American Indian 2 (2.0) Healthy Eating Index–2010 (HEI) 101 62.5 ± 10.7
Two or more races 3 (3.0) Whole Fruit Component 101 3.6 ± 1.6
BMI Category 93 Total Vegetable Component 101 2.3 ± 1.5
Underweight 5 (5.4) Greens and Beans Component 101 1.3 ± 1.7
Healthy Weight 72 (77.4) Empty Calories Component 101 18.8 ± 2.0
Overweight 5 (5.4)
Obese 11 (11.8)
SD = Standard Deviation, BMI = Body Mass Index
Possible ranges of survey items: fruit and vegetable preference (18–90), fruit preference (7–35), vegetable preference (11–55), cooking attitude (6 to 30), and cooking self-efficacy (8 to 40)
and Green Vegetables and Beans HEI component score (1.3 + 1.7) compared to the national average (55.1 + 0.72 and 07.0 + 0.09, respectively), but total vegetable and whole fruit scores were very similar to the national aver-age [21]. In addition, we used the multiple pass interviewer-administered 24-h dietary recall method conducted by a skilled dietary assessment center, and the parents were present for most of the dietary assess-ments. The FVP, AT, and SE assessment tools are reli-able and have been previously validated.
The study findings have important implications. The predictive validity of the FFF outcome measurements suggests that using these VP and SE assessments may be particularly useful to researchers and practitioners when indicators of diet quality are needed but constraints of time or cost abrogate the use of dietary assessment methods. The positive, predictive relationship between cooking self-efficacy and diet quality also supports the use of cooking interventions to improve overall diet quality, vegetable consumption, and whole fruit consumption. Table 2Predicted change in Healthy Eating Index Score and
Component Scores associated with changes in fruit and vegetable preference, cooking attitude, and cooking self-efficacy scores among 4th grade children
Predictor Variable Model 1a Model 2b
b SE(b) b SE(b)
Outcome Variablec
Healthy Eating Index–2010 (HEI)
Fruit and Vegetable Preferenced 0.172 0.092 0.178 0.109
Fruit Preferencee −0.107 0.232 −0.179 0.283
Vegetable Preferencef 0.361 0.129 0.392 0.153
Cooking Attitudeg 0.648 0.353 0.609 0.398
Cooking Self-Efficacyh 0.595 0.172 0.667 0.209
HEI Whole Fruit Component
Fruit and Vegetable Preference 0.023 0.014 0.021 0.016
Fruit Preference 0.036 0.036 0.019 0.039
Vegetable Preference 0.033 0.02 0.034 0.022
Cooking Attitude 0.099 0.052 0.091 0.057
Cooking Self-Efficacy 0.061 0.029 0.07 0.035
HEI Total Vegetable Component
Fruit and Vegetable Preference 0.032 0.012 0.024 0.014
Fruit Preference 0.055 0.029 0.039 0.034
Vegetable Preference 0.044 0.017 0.034 0.020
Cooking Attitude 0.034 0.045 0.015 0.046
Cooking Self-Efficacy 0.059 0.022 0.052 0.027
HEI Greens and Beans Component
Fruit and Vegetable Preference 0.032 0.014 0.03 0.017
Fruit Preference 0.008 0.037 0.009 0.042
Vegetable Preference 0.060 0.019 0.054 0.023
Cooking Attitude −0.014 0.056 −0.022 0.062
Cooking Self-Efficacy 0.028 0.025 0.014 0.032
HEI Empty Calories Component
Fruit and Vegetable Preference 0.028 0.024 0.018 0.026
Fruit Preference 0.019 0.05 −0.028 0.047
Vegetable Preference 0.049 0.036 0.043 0.041
Cooking Attitude 0.034 0.068 0.024 0.066
Cooking Self-Efficacy 0.133 0.058 0.120 0.070
aLinear regression adjusted for race/ethnicity and gender b
Linear regression adjusted for race/ethnicity, gender, and BMI z-score cTotal HEI score ranges from 0 to 100 points. HEI Whole Fruit, Total
Vegetable, and Greens and Beans ranges from 0 to 5 points. HEI Empty Calories ranges from 0 to 20 points
d
For all outcomes: Model 1 n = 98, Model 2 n = 90; possible scores ranged from 18 to 90. Higher scores indicated greater preference eFor all outcomes: Model 1 n = 101, Model 2 n = 93; possible scores
ranged from 7 to 35. Higher scores indicated greater preference f
For all outcomes: Model 1n= 98, Model 2n= 90; possible scores ranged from 11 to 55. Higher scores indicated greater preference gFor all outcomes: Model 1
n= 101, Model 2n= 93; possible scores ranged from 6 to 30. Higher scores indicated more positive cooking attitudes
hFor all outcomes: Model 1 n = 100, Model 2 n = 92; possible scores
ranged from 8 to 40. Higher scores indicated greater cooking self-efficacy Boldindicates statistical significance with p < 0.05
b= Regression Coefficient, SE = Standard Error, BMI = Body Mass Index
Table 3Adjusted logistic regression results for prediction of adherence to dietary guidelines recommendations by vegetable preference and cooking self-efficacy scores among 4th grade children
Predictor Variable Model 1a Model 2b
95% CI 95% CI
OR Lower Upper OR Lower Upper
Outcome Variablec
HEI Whole Fruit Component
Vegetable Preferenced 1.075 1.014 1.140 1.094 1.024 1.169
Cooking Self-Efficacye 1.067 0.985 1.156 1.096 0.999 1.202
HEI Total Vegetable Component
Vegetable Preference 1.108 1.013 1.212 1.114 1.016 1.222
Cooking Self-Efficacy 1.191 1.007 1.408 1.222 1.021 1.464
HEI Greens and Beans Component
Vegetable Preference 1.084 1.020 1.152 1.070 1.002 1.142
Cooking Self-Efficacy 1.094 1.003 1.193 1.062 0.967 1.166
HEI Empty Calories Component
Vegetable Preference 1.022 0.971 1.075 1.024 0.968 1.083
Cooking Self-Efficacy 1.028 0.956 1.106 1.035 0.951 1.127
a
Logistic regression adjusted for race/ethnicity and gender
b
Logistic regression adjusted for race/ethnicity, gender, and Body Mass Index z-score
c
Binary variable (yes/no) indicating status of scoring the maximum score for each HEI component: HEI Whole Fruit (5 point max), Total Vegetable (5 point max), Greens and Beans (5 points), and Empty Calories (20 points). Scoring the maximum score indicates conformance to the Dietary Guidelines
for Americans
d
For all outcomes: Model 1n= 98, Model 2n= 90; possible scores ranged from 11 to 55. Higher scores indicated a greater cooking self-efficacy
e
For all outcomes: Model 1n= 100, Model 2n= 92; possible scores ranged from 8 to 40. Higher scores indicated a greater vegetable preference
Boldindicates statistical significance (i.e. 95% confidence intervals that do not cross 1.00)
Similarly, the significant relationship between vegetable preference and overall diet quality suggests that interven-tions to improve child vegetable preferences are warranted.
Conclusion
This study provides evidence that low-cost measures of vegetable preferences and cooking self-efficacy predict diet quality in 4th grade children. These easy to administer, valid and reliable instruments encompass constructs com-mon to many cooking interventions, increasing their value as evaluation tools. These results also reinforce the relation-ship between cooking and healthful dietary behavior.
Abbreviations
AT:cooking attitude; BMI: Body Mass Index; FFF:Fuel for Fun; FP: fruit preference; FVP: fruit and vegetable preference; HEI: Healthy Eating Index-2010; SE: cooking self-efficacy; VP: vegetable preference
Acknowledgements
The authors would like to thank Xanna Burg, Megan Cooney, Andrew Stratford, and Kathryn Faulring for their assistance with data management and manuscript formatting.
Funding
This work was supported by the National Institute of Food and Agriculture, U.S. Department of Agriculture, under award number 2012–68001-19603. Any opinions, findings, or recommendations in this publication are those of the authors and do not necessarily reflect the view of the U.S. Department of Agriculture. The funding body did not play any role in the design of the study; the collection, analysis, and interpretation of data; and the writing of the manuscript.
Availability of data and materials
Researchers interested in the data from this study may contact principal investigator Leslie Cunningham-Sabo,
Authors’contributions
MPP, BL and LCS conceived the study and designed the analytical strategy. MPP and DM conducted the data analysis, and MPP drafted the manuscript. LCS is principal investigator of the study. All authors contributed to interpretation of the data, critically revised the manuscript and have read and approved the manuscript.
Ethics approval and consent to participate
This study was approved by the Colorado State University Institutional Review Board (12-3278H). Written consent was provided for participating parents, as well as written parental consent for their child’s participation. Child assent was also obtained.
Consent for publication Not applicable.
Competing interests
The authors declare that they have no competing interests.
Publisher’s Note
Springer Nature remains neutral with regard to jurisdictional claims in published maps and institutional affiliations.
Author details
1Department of Food Science and Human Nutrition, University of Illinois at
Urbana-Champaign, 905 S. Goodwin Ave, MC-182, Urbana, IL 61801-3896, USA.2Wegmans School of Health and Nutrition, Rochester Institute of Technology, Rochester, USA.3Department of Nutritional Sciences, Pennsylvania State University, Pennsylvania, USA.4Department of Food Science and Human Nutrition, Colorado State University, Colorado, USA.
Received: 22 March 2018 Accepted: 25 February 2019
References
1. Bowman SA, Clemens JC, Friday JE, Lynch KL, LaComb RP, Moshfegh AJ. Food patterns equivalents intakes by Americans: what we eat in America, NHANES 2003-2004 and 2013-2014. Food surveys research group. Dietary Data Brief No. 2017:17.
2. Banfield EC, Liu Y, Davis JS, Chang S, Frazier-Wood AC. Poor adherence to US dietary guidelines for children and adolescents in the National Health and nutrition examination survey population. J Acad Nutr Diet. 2016;116:21–7.
3. 2015 Dietary Guidelines Advisory Committee. Part D. Chapter 2: dietary patterns, foods and nutrients, and health outcomes. In: Scientific report of the 2015 dietary guidelines advisory committee.https://health.gov/ dietaryguidelines/2015-scientific-report/pdfs/scientific-report-of-the-2015-dietary-guidelines-advisory-committee.pdf. Accessed 11 Dec 2017. 4. Caraher M, Seeley A, Wu M, Lloyd S. When chefs adopt a school? An
evaluation of a cooking intervention in English primary schools. Appetite. 2013;62:50–9.
5. Chu YL, Storey KE, Veugelers PJ. Involvement in meal preparation at home is associated with better diet quality among Canadian children. J Nutr Educ Behav. 2014;46:304–8.
6. Jarpe-Ratner E, Folkens S, Sharma S, Daro D, Edens NK. An experiential cooking and nutrition education program increases cooking self-efficacy and vegetable consumption in children in grades 3-8. J Nutr Educ Behav. 2016;48:697–705.
7. Larson NI, Story M, Eisenberg ME, Neumark-Sztainer D. Food preparation and purchasing roles among adolescents: associations with
sociodemographic characteristics and diet quality. J Am Diet Assoc. 2006; 106:211–8.
8. van der Horst K, Ferrage A, Rytz A. Involving children in meal preparation. Effects on food intake. Appetite. 2014;79:18–24.
9. Davis JN, Ventura EE, Cook LT, Gyllenhammer LE, Gatto NM. LA sprouts: a gardening, nutrition, and cooking intervention for Latino youth improves diet and reduces obesity. J Am Diet Assoc. 2011;111:1224–30.
10. McPherson RS, Hoelscher DM, Alexander M, Scanlon KS, Serdula MK. Dietary assessment methods among school-aged children: validity and reliability. Prev Med. 2000;31:S11–33.
11. Shim J-S, Oh K, Kim HC. Dietary assessment methods in epidemiologic studies. Epidemiol and Health. 2014;36.
12. Thompson FE, Kirkpatrick SI, Subar AF, Reedy J, Schap TE, Wilson MM, Krebs-Smith SM. The National Cancer Institute's dietary assessment primer: a resource for diet research. J Acad Nutr Diet. 2015;115:1986–95.
13. Mislevy JL, Rupp AA. Predictive validity. In: Salkind NJ, editor. Encyclopedia of research design. Thousand Oaks: SAGE Publications, Inc.; 2010. p. 1077–8. 14. Liquori T, Koch PD, Contento IR, Castle J. The cookshop program:
outcome evaluation of a nutrition education program linking lunchroom food experiences with classroom cooking experiences. J Nutr Educ. 1998;30:302–13.
15. Cunningham-Sabo L, Lohse B. Impact of a school-based cooking curriculum for fourth-grade students on attitudes and behaviors is influenced by gender and prior cooking experience. J Nutr Educ Behav. 2014;46:110–20. 16. Domel SB, Thompson WO, Davis HC, Baranowski T, Leonard SB, Baranowski
J. Pychosocial predictors of fruit and vegetable consumption among elementary school children. Health Educ Res. 1996;11:299–308. 17. Resnicow K, Davis-Hearn M, Smith M, Baranowski T, Lin LS, Baranowski J,
Doyle C, Terry Wang D. Social-cognitive predictors of fruit and vegetable intake in children. Health Psychol. 1997;16:272–6.
18. Cunningham-Sabo L, Lohse B, Smith S, Browning R, Strutz E, Nigg C, Balgopal M, Kelly K, Ruder E. Fuel for fun: a cluster-randomized controlled study of cooking skills, eating behaviors, and physical activity of 4th graders and their families. BMC Public Health. 2016;16:444–58.
19. Lohse B, Cunningham-Sabo L, Walters LM, Stacey JE. Valid and reliable measures of cognitive behaviors toward fruits and vegetables for children aged 9 to 11 years. J Nutr Educ Behav. 2011;43:42–9.
21. USDA Center for Nutrition Policy and Promotion.Healthy eating index (HEI)
https://www.cnpp.usda.gov/healthyeatingindex. Accessed 01 Dec 2017. 22. Cunningham-Sabo L, Lohse B. Cooking with kids positively affects fourth
graders' vegetable preferences and attitudes and self-efficacy for food and cooking. Child Obes. 2013;9:549–56.
23. De Bourdeaudhuij S, Velde J, Brug P, et al. Personal, social and
environmental predictors of daily fruit and vegetable intake in 11-year-old children in nine European countries. Eur J Clin Nutr. 2007;62:834–41. 24. Cullen KW, Bartholomew LK, Parcel GS, Koehly L. Measuring stage of change
for fruit and vegetable consumption in 9- to 12-years-old girls. J Behav Med. 1998;21:241–53.
25. Domel SB, Thompson WO. Fourth-grade children's consumption of fruit and vegetable items available as part of school lunches is closely related to preferences. J Nutr Educ Behav. 2002;34:166–71.
26. Edwards JS, Hartwell HH. Fruit and vegetables-attitudes and knowledge of primary school children. J Hum Nutr Diet. 2002;15:365–74.
27. Livingstone MBE, Robson PJ, Wallace JMW. Issues in dietary intake assessment of children and adolescents. Br J Nutr. 2004;92:S213–S22. 28. Field AE, Peterson KE, Gortmaker SL, Cheung L, Rockett H, Fox MK, Colditz