Alagar Raja. M, Nalanda College of Pharmacy Cherlapally, Nalgonda, Andhra Pradesh, India
E-mail: [email protected] Address for correspondence
Access this article online www.japer.in
Analytical method development & validation of Eperisone
Hydrochloride and Diclofenac Sodium in Rapisone D SR Capsules
by RP-HPLC
INTRODUCTION
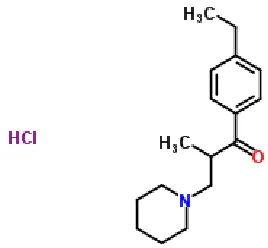
Eperisone (EPE) is chemically 4-ethyl-2-methyle-3-piperidinopropiopenone (Figure 1 [2] ) is a well known antispasmodic drug& is official in Japanese Pharmacopoeia (JP). JP [1] describes potentiometric method for its estimation. Literature survey reveals use of HPLC/MS, GC/MS, NMR, UV and IR to Identify Degredation product of eperisone hydrochloride in the tablets[11]. Literature survey also reveals UV spectrophotometry [12] and HPLC [13] method for the determination of EPE with other drugs in combination. Diclofenac sodium (DIC) is chemically 2-[2,6dichlorophenylamino] benzene acetic acid sodium salt(Figure 2 [3]). Diclofenac sodium (DIC) is official in IP and BP. IP [3] and BP [4] describes liquid chromatography method for its estimation. Literature survey reveals UV spectrophotometric[14], HPLC [15]
& HPTLC[16] method for the determination of DIC with other drugs in combination. The combination of these two drugs is not official in any pharmacopoeia; hence no official method is available for the simultaneous estimation of EPE and DIC in their combined dosage forms. Literature survey reveal spectrophotometric method for simultaneous estimation of EPE and DIC in synthetic mixture[17] but no RP-HPLC method for dosage form. The present communication describes simple, sensitive, rapid, accurate & precise RP-HPLC[5-8] method for simultaneous estimation of both drugs in their combined dosage form.
Figure 1: Structure of Eperisone Hydrochloride
Research Research Research
Research ArticleArticleArticleArticle
A simple, sensitive, rapid, accurate, precise and reproducible Reverse Phase High Performance Liquid Chromatographic (RP-HPLC) method was developed for the simultaneous quantitative determination of Diclofenac Sodium(DIC) & Eperisone Hydrochloride (EPE) in capsule dosage form and statistically validated as per ICH guidelines. The Chromatographic separation was carried out on a Thermo Hypersil C-8 column (250×4.6mm, 5µm) by gradient elution mode. The mobile phase consists of Methanol, Phosphate Buffer(0.1M, pH 6) and Acetonitrile in the ratio of 30:40:30 (v/v/v) pumped at a flow-rate of 1.0 mL/min. The PDA detector was employed at a wavelength of 261nm. The retention times of Diclofenac Sodium & Eperisone Hydrochloride were found to be 2.21 min and 3.6 min respectively. The calibration curves were linear in the range of 20-80µg/mL & 30-120 µg/mL for DIC & EPE. The method is accurate with %w/w recoveries of 99.03% & 100.9 % for Diclofenac Sodium and Eperisone Hydrochloride respectively & the method is precise with % RSD < 2.The proposed method is rapid, simple and does not require any separation process and it has been successfully applied to the assay of pharmaceutical dosage form(RAPISONE D SR capsules).
Keywords:Diclofenac Sodium, Eperisone Hydrochloride, RP-HPLC, Phosphate
buffer, RAPISONE D SR capsules, Validation, ICH. ABSTRACT
ABSTRACT ABSTRACT ABSTRACT Alagar Raja. M *1,Godavari
Swetha1, David Banji1, Selva Kumar.D2, Vanitha .C 1
Figure 2: Structure of Diclofenac sodium
MATERIAL AND METHODS
2.1. Apparatus
A WATERS 2690 HPLC with empower software & waters 996 PDA detector,a SYSTRONICS 119 Spectrophotometer double beam UV-Visible spectrophotometer,digital pH meter DPH 500(Global),Vaccum filtration Unit EPCOS,a Wensar PGB 100 analytical balance & an ultrasonic bath (Frontline FS 4) was used in the study.
2.2. Reagents and Materials
DIC bulk powder was kindly gifted by Dr.Reddys laboratories, Hyderabad, Andhra Pradesh, India. EPE
bulk powder was kindly gifted by Sun Pharmaceuticals Ltd., Mumbai.HPLC grade solvents Methanol & Water obtained from Mercks & Acetonitrile obtained from Molychem, Disodium hydrogen phosphate obtained from Finer chemicals Ltd., Orthophosphoric acid obtained from Mercks and Whatman filter paper no. 45 (Millipore, USA) were used in the study. RAPISONE D SR capsules containing DIC (100mg) & EPE (150mg) were purchased from local pharmacy.
2.3. Chromatographic conditions
Chromatographic separation was performed with gradient elution.Intially mobile phase was tried with Methanol: Water, Acetonitrile: Water, Acetonitrile: Water: Methanol & then finally with Phosphate Buffer: Acetonitrile: Methanol at various pH conditions. The following optimised parameters were used as a final method for the simultaneous estimation of Diclofenac Sodium and Eperisone Hydrochloride.
Table 1: Optimized Chromatographic Conditions
Column Hypersil C8 (4.6 x 250mm, 5µm, waters)
Buffer 7.5 grams of Disodium Hydrogen Phosphate in 1000 mL water; pH 6 was adjusted with Orthophosphoric acid.
Mobile phase 40% Buffer, 30% Methanol, 30% Acetonitrile.
Flow rate 1 mL/ min
Wavelength 261 nm
Injection volume 10 µL
Run time 7 min
2.4. Preparation of standard stock solutions
Accurately weighed amount of 100mg of Diclofenac Sodium & 150 mg of Eperisone Hydrochloride were taken to a 100 mL cleaned and dried volumetric flask. This was then diluted with 70mL of diluent and was sonicated. The volume was made to100 mL with the same solvent. This was marked and labeled as Stock solution.
2.5. Preparation of sample solution(dosage form):
Take 20 RAPISONE D SR capsules & weigh them(w1).Now remove the shells of capsules & weigh empty shells(w2).Calculate the weight of the capsule contens by subtracting the empty shells weight from
capsules weight w3=(w1-w2).Crush the contents into powder form.Calculate a weight equivalent to 100mg of Diclofenac Sodium & 150 mg of Eperisone Hydrochloride & take into a 100mL volumetric flask.Add 50mL of Mobile Phase & sonicate for 10min.Filter under vaccum filtration unit & makeup the volume.From this 0.4mL was pippetted into a 10 mL volumetric flask & make up with mobile phase such that the final concentrations are 40µg/mL of Diclofenac Sodium & 60 µg/mL of Eperisone Hydrochloride.
The proposed method was validated according to the
International Conference on Harmonization (ICH)
guidelines[5-10].
2.6.1. Linearity & range:
The calibration curves were plotted over a concentration range of 20-80 µg/mL for DIC and 30-120 µg/mL for EPE. Accurately measured stock solution of 0.2,0.3,0.4,0.5,0.6,0.7 & 0.8mL were transferred to a series of 10 mL of volumetric flasks and diluted to the mark with mobile phase such that the final concentrations are 20, 30, 40, 50, 60, 70 & 80
µg/mL for DIC & 30, 45, 60, 75, 80, 105 & 120 µg/mL for EPE. Inject each into the chromatographic system and measure the peak area. Plot a calibration graph of peak area versus concentration (on X-axis concentration and on Y-axis Peak area) and calculate the correlation coefficient.
2.6.2. Intra & Inter-Day Precision:
From the stock solution a concentration of 40 µg/mL of DIC & 60 µg/mL of EPE prepared by dissolving 0.4mL in 10mL mobile phase in a 10mL volumetric flask. Both intra-day & inter-day precision was performed by injecting five injections at regular intervals on same day & on five alternate days over a period of 10 days. The results are reported in the form of %RSD.
2.6.3. Accuracy
The accuracy of the method was determined by calculating % recovery of EPE and DIC by analyzing 50, 100 and 150 % level sample solutions of EPE and DIC. Three injections were done for each sample & results are obtained in % mean recovery.
2.6.4. Robustness:
From stock solution 0.4 mL was diluted to 10mL with the mobile phase to get 40 µg/mL of DIC & 60 µg/mL of EPE . Robustness performed by both flow rate variation (0.8, 1 & 1.2mL/min) & temperature variation (200, 250 & 30 0C).Two injections for each parameter variation were done & the acceptance criteria for tailing factor & USP plate count were determined.
2.6.5. Ruggedness:
Ruggedness performed by analyst variation. A concentration of 40 µg/mL of DIC & 60 µg/mL of EPE was prepared from stock solution & analysed by using two different analyst. Five injections were done by each analyst & the results are reported in the form of % recovery.
2.6.6. Limit of detection and Limit of quantification
LOD and LOQ values decide about the sensitivity of the method. LOD is the lowest detectable concentration of the analyte, while LOQ is the lowest quantifiable concentration.The LOD & LOQ are calculated from the calibration curve by using the formulas(Eq..1 & Eq..2) LOD = 3.3 × σ/S………Eq..1
LOQ = 10 × σ/S………. Eq..2
Where, σ = the standard deviation and S = slope of the calibration curve
RESULTS AND DISCUSSION
The standard solutions of EPE and DIC were scanned separately in the UV range and the maximum separation of both drugs was obtained at 261 nm with good resolution. The optimized chromatogram was shown in figure 3 & system suitability parameters are given in table 2.Linear correlation was obtained between peak areas and concentrations of EPE and DIC in the concentration ranges of 30-120 µg/mL & 20-80 µg/mL, respectively. The % RSD values of EPE & DIC was found to be 0.92 & 0.45% for inter day precision and 0.26 & 0.38 % for intra-day precision respectively. Relative standard deviation was less than 2 %, which indicates that proposed method is precise. The mean % recoveries were 99.03 and 100.9% for DIC and EPE, respectively, which indicates that the proposed method is highly accurate. The LOD & LOQ results indicate that the method is sensitive.
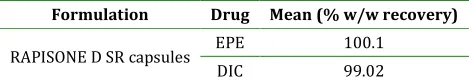
validated method was successfully applied to determine EPE and DIC in their capsule dosage form. The results obtained for EPE and DIC were comparable with the corresponding labeled amounts
(Table 5). No interference of the excipients with the peaks of interest appeared; hence the proposed method is applicable for the routine analysis of EPE and DIC in pharmaceutical dosage forms.
A
U
0.00 0.02 0.04 0.06 0.08 0.10 0.12
Minutes
1.00 2.00 3.00 4.00 5.00 6.00 7.00 8.00 9.00 10.00
3. Chromatogram of Diclofenac Sodium & Eperisone Hydrochloride
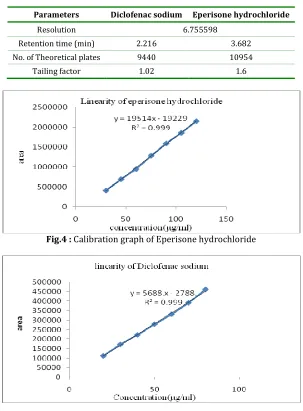
Table 2: System suitability parameters
Parameters Diclofenac sodium Eperisone hydrochloride
Resolution 6.755598
Retention time (min) 2.216 3.682
No. of Theoretical plates 9440 10954
Tailing factor 1.02 1.6
Fig.4 : Calibration graph of Eperisone hydrochloride
Table 3: Representation of Results of Various Parameters of EPE & DIC
Parameter Eperisone Hydrochloride Diclofenac Sodium
Linearity & Range 30-120ppm 20-80ppm
Regression equation y = 19514x - 19229 y = 5688.x - 2788.
Correlation coeffiient 0.999 0.999
Precision (%RSD)
Interday 0.92 0.45
Intraday 0.26 0.38
Accuracy(%Recovery) 100.9% 99.03%
Ruggedness (%Recovery) Analyst 1 0.57 0.77
Analyst 2 0.36 0.77
LOD 0.0006 0.0012
LOQ 0.0018 0.0038
Table 4: Results of Robustness for Diclofenac Sodium & Eperisone Hydrochloride
Robustness Parameters
Diclofenac sodium Eperisone hydrochloride
USP plate count USP tailing USP plate count USP tailing
Temperature (0C)
20 9504.88 1.057 10962.19 1.535
25 9831.36 1.171 10974.48 1.578
30 9786.33 1.155 10942.93 1.552
Flow Rate (ml/min)
0.8 9504.88 1.057 10962.19 1.535
1.0 9831.36 1.171 10974.48 1.578
1.2 9786.33 1.155 10942.93 1.552
Table 5: Application of method for the analysis of commercial formulations
Formulation Drug Mean (% w/w recovery)
RAPISONE D SR capsules EPE 100.1
DIC 99.02
CONCLUSION
A RP-HPLC method was developed for the simultaneous estimation of Diclofenac Sodium & Eperisone Hydrochloride in RAPISONE D SR capsules & validated as per ICH guidelines. The developed method utilized a set of conditions which are not reported previously including a high pH mobile phase with gradient elution & does not required any special separation techniques. The method exhibited good selectivity & sensitivity. The developed method is successfully applied to the analysis of dosage form.
ACKNOWLEDGEMENT
The authors are thankful to Sun Pharmaceutical Ltd, Mumbai, India and Dr.Reddys laboratories Hyderabad, India for providing gift sample of EPE and DIC,
respectively for carry out the research work. The authors are highly thankful to Nalanda College of Pharmacy, Cherlapally, Nalgonda, Andhra Pradesh, India- 508001 for providing all the facilities to carry out the research work.
REFERENCES
1. Japanese Pharmacopoeia, 15th edition, Society of
Japanese Pharmacopeia ,2006,pp.618
2. http://www.chemspider.com/eperisone.drugprofile
3. Indian Pharmacopoeia, Vol. II, The Controller
Publication, Govt. of India, New Delhi 2010,pp.1199.
4. British Pharmacopoeia, Vol. I, The British
Pharmacopoeia Commission, London 2010, p.672.
5. P. D. Sethi High-Performance Liquid Chromatography,
6. L R Synder, J J Kirkland, J L Glajesh . Practical HPLC
Method Development, second ed,John Wiley &
sons,Inc.,NewYork,1997, pp.1-14
7. Vogels, The Text Book Of Quantitative Chemical
Analysis(6th Ed), published by Pearson Education,
pp.1145-1152
8. A. H. Beckett & J.B. Stenlake , Practical Pharmaceutical
Chemistry, 4(2), CBS Publishers and distributors,
1997, pp.157-170
9. Michael E, Schartz IS, Krull, Analytical method
development and Validation. 2004, pp.25-46.
10.The International Conference on Harmonization, Q2
(R1), Validation of Analytical Procedure, Text and
Methodology, 2005.
11.Ding L, Wang X, Yang Z, and Chen Y The use of
HPLC/MS, GC/MS, NMR, UV and IR to Identify
Degredation product of eperisone hydrochloride in
the the tablets, J of pharm and Bio Anal, 46 (2008)
282-287.
12.Nirav Uchadadiya, Falgun Mehta, Pinak Sanchaniya,
“Development and validation of derivative
spectrophotometric method for simultaneous
estimation of Eperisone hydrochloride and
Paracetamol in combined tablet dosage form”,Novus
Int J of Chem, 1(2012) 33-40
13.Priyanka Patel, Dhara Patel, Hardik Modi, Falguni
Patel, Hardiksinh Baria, Sanjay Patel“development and
validation of RP-HPLC methods for simultaneous
estimation of eperisone hydrochloride and lornoxicam
in bulk and their synthetic mixture” Inventi Rapid:
Pharm Analysis & Quality Assurance , (2013) 724
14.Mr Sengar, Sv Gandhi , Up Patil, Vs Rajmane
“Simultaneous Determination Of Diclofenac Sodium
and Thiocolchicoside in Fixed Dose Combination by
Spectrophotometry” Asian J of Pharm and Cli Res ,
Vol.3( 2) (2010)86-9
15.Chakraborty Mithun , Ray Chaudhury Dipanjan, Basu
Arindam, Das Debabrata & Chakraborty Susanto,
“Simultaneous Determination of Paracetamol,
Chlorzoxazone and Diclofenac Sodium in Tablet
Dosage form by HPLC”, Int J Of Pharm Innovations,
Volume 2(2)(), 34-40
16.D. S. Patel, A. D. Captain, P. P. Prajapati, H. G. Shah,
“Development and Validation of HPTLC Method for
Simultaneous Determination of Tolperisone
Hydrochloride and Diclofenac Sodium in Combined
Dosage Form” Int J of Pharm Tech & Res,5()147-154
17.J. Umang Patel,Patel Paresh.U,Patelo Sejal K
“Spectrophotometric method for simultaneous
estimation of Eperisone Hydrochloride & Diclofenac
Sodium in synthetic mixture”, Int Res J of Pharmacy,
vol.3(9) (2012) 203-206
How to cite this article: Alagar Raja. M*, Godavari Swetha, David Banji, Selva Kumar. D, Vanitha. C; Anlytical method development & validation of Eperisone Hydrochloride and Diclofenac Sodium in Rapisone D SR Capsules by RP-HPLC; J. Adv. Pharm. Edu. & Res. 2013: 3(2): 61-66.
Source of Support: Nil, Conflict of Interest: Nil