Dr. D. Visaga Perumal
Department of Pharmaceutical Chemistry, T. John College of Pharmacy, Karnataka, India Email: [email protected]
Address for correspondence
Access this article online www.japer.in
Quantization of Metaxalone in Human Plasma using High -
Performance Liquid Chromatography- Tandem Mass Spectroscopy
INTRODUCTION
Metaxalone, 5-(3, 5-dimethylphenoxymethyl)-1,
3-oxazolidin-2-one is a muscle relaxant used to relax
muscles and relieve pain caused by strains, sprains,
and other musculoskeletal conditions with relatively
low side effects. The mechanism of action of
metaxalone in humans has not been established, but
may be due to general central nervous system
depression. Metaxalone has no direct action on
contractile mechanism of striated muscle, the motor
end plate, or the nerve fibre.
Various analytical methods, such as
spectrophotometry[1-3], HPLC with Diode array
detection[4], HPLC with UV detection[5], RP-UPLC[6].
LC-MS/MS methods have been previously reported for
the estimation of Metaxalone. A method for the
quantification of Metaxalone in rat plasma using
Phenytoin as an internal standard[7]. The retention
time of Metaxalone and Phenytoin were found to be
1.60 and 1.83 min respectively. The calibration curve
was linear (r2 > or = 0.99) ranging from 0.98 to 998
ng/ml. Another LC-MS/MS method in which
Metaxalone-d3 was used as internal standard and
drug was extracted from the plasma by using solid
phase extraction [SPE] technique[8]. Another method
where Galantamine was used as internal standard and
the drug was extracted by using liquid-liquid
extraction[9]. The present study describes
development and validation of a simple, specific, rapid
and sensitive liquid chromatography – tandem mass
spectrometry [LC-MS/MS] method for the
determination of Metaxalone in human plasma with a
limit of quantification [LOQ] of 25.006 ng/ml during a
3 min run time using Metaxalone-d6 as internal
standard. The structures of Metaxalone and
Metaxalone-d6 were displayed in Figure 1.
Metaxalone Metaxalone-d6
Fig.1: Structures of Metaxalone and Metaxalone-d6 Research
ResearchResearch
Research ArticleArticleArticleArticle
Present study reports the development and validation of Metaxalone in human plasma by LC-MS/MS using electron spray ionization technique. Metaxalone-d6 was used as internal standard. The chromatographic separation of analyte and internal standard was achieved by using ACE 5μ C18, 100 X 4.6 mm column as stationary phase and 10 mM Ammonium Acetate: Methanol with Acetonitrile (60:40) as mobile phase at a flow-rate of 1 ml/min. MS detection was performed at transitions of m/z 222.100/161.200 and 228.200/167.200 in multiple reaction monitoring for Metaxalone and Metaxalone-d6 at positive mode. Metaxalone was extracted from the plasma by liquid-liquid extraction using 0.2M NaOH as treatment buffer and Ethyl acetate as extraction solvent. The present method was found to be linear over the concentration range of 25.006 - 12059.526 ng/ml (r2-0.9983). The limit of quantification of
Metaxalone in plasma was found to be 25.006ng/ml. The retention times of Metaxalone and Metaxalone-d6 were found to be 2.01 min and 1.98 min, respectively. The analyte was found to be stable under various stability tests such as freeze-thaw, bench top, wet extract, dry extract, auto sampler and interim studies. This simple, rapid and specific validated method was successfully applied for the faster analysis of Metaxalone in human plasma in bioavailability and bioequivalence studies.
Keywords: LC-MS/MS, human plasma, Metaxalone, Metaxalone-d6, liquid-liquid extraction, validation. ABSTRACT ABSTRACT ABSTRACT ABSTRACT Chaitanya Sucharitha
Kolakaluri1*,
Anusha Goli1,
G. Saravanan2,
D. Visaga Perumal3
1. Department of Pharmaceutical Analysis and Quality Assurance, Bapatla College of Pharmacy, Bapatla, Andhra Pradesh, India. 2. Department of Pharmaceutical Chemistry, Bapatla College of Pharmacy, Bapatla, Andhra Pradesh, India. 3. Department of Pharmaceutical Chemistry, T.John College of Pharmacy, Karnataka, India.
Instrumentation:
API 3200 triple quadrupole instrument [Applied
Biosystem SCIEX, Toronto, Canada] was used for mass
spectroscopy. Shimadzu HPLC system [Shimadzu SIL
HTC, USA] was used for chromatographic separation.
Electron-spray ionization technique was used. Data
was collected and processed using Analyst Software
version 1.5.1 [Applied Biosystems MDS SCIEX,
Toronto, Canada]. Ultra microbalance SE2 and Semi
Microbalance CPA225D of Sartorius was used for
weighing. A high speed desk centrifuge Sorvall
Legend XTR of Thermo Scientific was used for
centrifugation.
The tuned conditions of Declustering Potential [DP]
were 39V,40V; Collision energy [CE] were 16V,15V;
Collision Cell Entrance Potential [CEP] were 19V,20V;
Collision Exit Potential [CXP] 6V for analyte and
internal standard respectively. Entrance Potential [EP]
10V, Heater temperature 500oC, Curtain gas 30 psi,
Collision associated dissociation [CAD] 6 psi,
Nebulizer gas [GS1] 40 psi, Heater gas [GS2] 45 psi
and ion spray voltage [ISV]-5500V were optimized for
both analyte and internal standard. Mass spectrums of
parent and product ions of analyte and internal
standard were represented in Figure 2 [A,B] and
Figure 3 [A,B].
Fig. 2A: Parent ion scan of Metaxalone
Fig. 3B: Product ion scan of Metaxalone-d6
Chromatographic conditions:
The liquid chromatographic separation was carried
out using ACE 5μ C18, 100 X 4.6 mm analytical column
and auto-injecton volume of 20 μl. Mobile phase was
composed of 10mM Ammonium Acetate : Methanol
with Acetonitrile ( 60:40) and was delivered at a flow
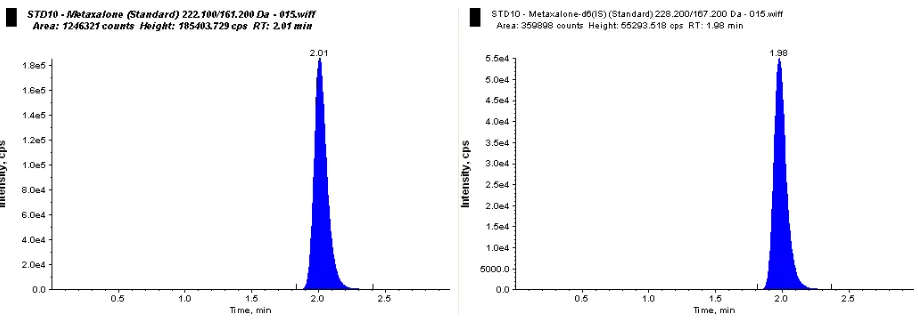
rate of 1ml/min with run time of 3 min. Retention
time of Metaxalone and Metaxalone-d6 were found to
be 2.01 min and 1.98 min respectively [Figure 4].
Fig.4: Retention time of Metaxalone and IS
Preparation of standards and quality control
samples:
Standard stock solutions of Metaxalone and
Metaxalone-d6 of concentration 2mg/ml, 0.2mg/ml
were prepared in methanol. The internal standard
solution was diluted to a concentration of 5μg/ml by
using diluent 50% methanol. Calibration curve
standard solutions were prepared by spiking stock
solution into drug free human plasma to obtain 10
concentrations of 25.006, 50.012, 150.367, 601.469,
1202.938, 2405.875, 4811.751, 7235.716, 9647.621,
and 12059.526 ng/ml by using diluent 50% Methanol.
Three quality control [QC] samples, lower quality
control [LQC] of 65.682 ng/ml, medium quality
control [HQC] of 6012.040 ng/ml and higher quality
control [HQC] of 9027.087 ng/ml were prepared in an
analogous manner to the calibration standards. Matrix
based samples were stored at -70±150C and stock
solutions were stored at 2-80 C.
Sample preparation:
50 μl of internal standard solution [5 μg/ml] was
added into labeled ria vial tubes and spiked with 100
μl of plasma sample [respective concentration] into
each tube and vortexed for 5s. 100 μl of 0.2M NaOH
was added to the above ria vial tubes and vortexed for
30s. Then 1.3ml of Ethyl acetate was added and
The study samples, QC samples and calibration
standards were processed in accordance with the
validated analytical method to ensure the
acceptability of the analytical run. The analytical
method was validated according to the guidance of US
Department of Health and Human services Food and
comparing the blank samples and a zero blank
samples with that of plasma samples spiked with
analyte to find out the interferences caused by
endogenous substances. This method was found to be
specific. Chromatograms of blank and zero blank were
represented in Figure 5 and 6.
Fig.5: Blank of Analyte and IS
Fig.6: Zero blank of Analyte and IS Linearity:
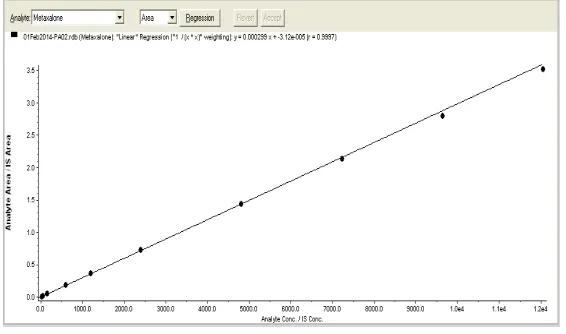
Calibration curve was linear over the concentration
range of 25.006 - 12059.526 ng/ml for Metaxalone
with correlation coefficient [r] 0.9997 [Figure 7]. The
best linear fit and least square residuals for the
calibration curve were achieved with a 1/x2 weighing
factor, giving a mean linear equation for the
calibration curve in the form of y = mx + c, Where y
was the peak area ratio of Metaxalone to
Metaxalone-d6 and x was the concentration of Metaxalone. The
lower limit of quantification was found to be 25.006
Fig.7 Calibration curve of Metaxalone
Precision and Accuracy:
The method precision and accuracy of Metaxalone in
human plasma was evaluated by using three sets of
QCs at three concentrations of HQC, MQC and LQC
[Figure 8A, B, C]. Intra-day precision was done on set
1 and set 2, whereas inter-day precision was done on
set 2 and set 3.The overall precision of the method
expressed as relative standard deviation and accuracy
of the method. Inter day batch accuracy ranged from
93.9% to 105.3%. Inter day precision ranged from
0.7% to 8.7%. Intraday batch accuracy ranged from
93.9% to 105.3%. Intraday batch precision ranged
from 0.7% to 8.7%.The mean concentrations,
standard deviation [SD], coefficient of variation [%
CV] were evaluated and their results were tabulated in
table 1. T-test was performed for interday and
intraday precision concentrations and they were
found to be statistically non-significant. Therefore, the
method was found to be precise.
Table 1: Precision and Accuracy studies of Metaxalone samples [ng/ml]
Conc [ng/ml] LQC [65.682] MQC [6012.050] HQC [9027.087]
Set 1 Set 2 Set 3 Set 1 Set 2 Set 3 Set 1 Set 2 Set 3
Mean 61.93 64.57 63.64 5644.96 5967.27 5904.96 9214.19 9482.06 9503.83
SD [±] 1.007 1.187 1.925 493.23 67.71 38.39 226.06 119.05 96.72
CV [%] 1.6 1.8 3.0 8.7 1.1 0.7 2.5 1.3 1.0
Accuracy[%] 94.3 98.3 96.9 93.9 99.3 98.2 102.1 105.0 105.3
Extraction recovery:
Recovery of Metaxalone was evaluated by comparing
the mean peak areas of six extracted low, medium and
high quality control samples [LQC, MQC and HQC] to
mean peak areas of six unprocessed reference
solutions. Recovery of internal standard
Metaxalone-d6 was evaluated by comparing the mean peak areas
of low, medium and high quality control samples to
mean peak areas of unprocessed reference solutions
of the same concentration. The results were
represented in table 2.
Table 2: Extraction recovery data of analyte and internal standard
Metaxalone Metaxalone-d6
HQC MQC LQC HQC MQC LQC
% Recovery 82.6 96.8 85.8 77.2 78.8 79.0
Overall standard deviation 7.40 1.00
Overall %CV 8.4 1.3
Re-injection Reproducibility:
The re-injection reproducibility was done by comparing the results of re-injection set of samples with that of the
bench top stability, auto-sampler stability, freeze thaw
stability, dry extract stability, wet extract stability [in
refrigerator and on bench top] were validated. Six
replicates were analyzed for each of low quality
control [LQC] and high quality control [HQC] samples
at each storage condition. The concentration of
samples that were freshly prepared and processed
immediately. The precision and accuracy for the
stability samples must be within ≤15 and ±15%,
respectively, of their nominal concentrations. The
results were represented in table 4.
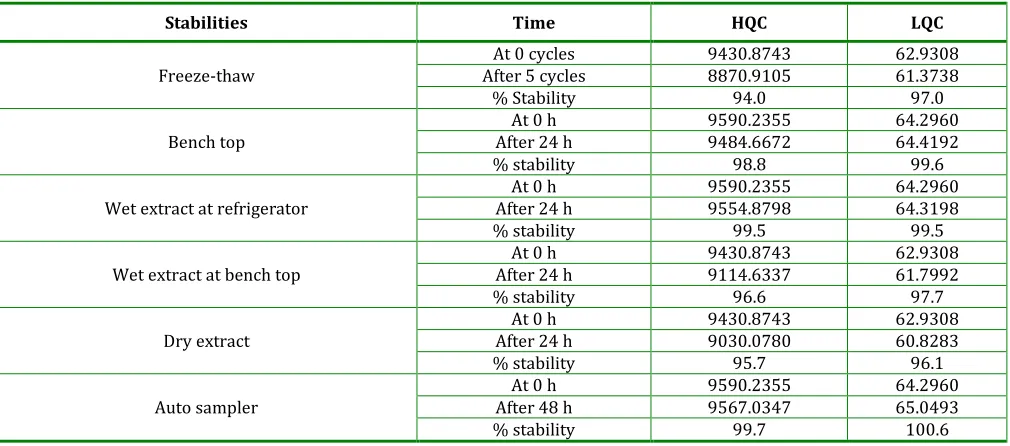
Table 4: Results for Stability studies
Stabilities Time HQC LQC
Freeze-thaw
At 0 cycles 9430.8743 62.9308
After 5 cycles 8870.9105 61.3738
% Stability 94.0 97.0
Bench top
At 0 h 9590.2355 64.2960
After 24 h 9484.6672 64.4192
% stability 98.8 99.6
Wet extract at refrigerator
At 0 h 9590.2355 64.2960
After 24 h 9554.8798 64.3198
% stability 99.5 99.5
Wet extract at bench top
At 0 h 9430.8743 62.9308
After 24 h 9114.6337 61.7992
% stability 96.6 97.7
Dry extract
At 0 h 9430.8743 62.9308
After 24 h 9030.0780 60.8283
% stability 95.7 96.1
Auto sampler
At 0 h 9590.2355 64.2960
After 48 h 9567.0347 65.0493
% stability 99.7 100.6
Bench Top Stability [BTS]:
The stability of anlalyte in human plasma stored at
room temperature [bench-top] was determined by
processing bench top stability quality control samples
after keeping them at room temperature
approximately for 24h and quantifying them against
the freshly spiked set of quality control samples.
Freeze-thaw Stability [FTS]:
The freeze-thaw stability was conducted by
comparing the stability samples that had been frozen
and thawed five times against freshly spiked quality
control samples.
Wet Extract Stability:
Wet extract bench top and wet extract refrigerator
stability of Metaxalone was determined by processing
and reconstituting quality control samples, keeping
them at room temperature and refrigerator [2-8oC]
approximately for 24h and quantifying them against
freshly spiked set of quality control samples.
Dry Extract Stability:
The dry extract stability of Metaxalone was
determined by processing quality control samples,
keeping them in refrigerator for 24h and quantifying
Auto injector Stability:
To assess the auto- injector stability of Metaxalone,
quality control samples were stored into the auto-
sampler for the stability period of 48h. These samples
were then quantified against freshly spiked quality
control samples.
CONCLUSION
A highly selective and rapid LC-MS/MS method
employing liquid-liquid extraction for the
determination of Metaxalone in human plasma has
been developed and validated with a lower limit of
quantification of 25.006 ng/ml. The validation data
also demonstrates good precision, accuracy and high
extraction efficiency. The validation data also
demonstrates good precision, accuracy and high
extraction efficiency. The validated method allows
quantification of Metaxalone in the linear range of
25.006 - 12059.526 ng/ml. In conclusion, this paper
describes a very simple and sensitive LC-MS/MS
method for the quantization of Metaxalone suitable to
monitor plasma concentrations during clinical
pharmacokinetic and bioequivalence studies in
humans.
ACKNOWLEDGEMENT
The author would like to thank Actimus Biosciences
Pvt. Ltd., India for the technical support. The author
gratefully acknowledges the competent technical
assistance of A.V. Raghu Ram and S. Vijay Bhaskar
Reddy.
REFERENCES
1. Chintan R Patell, Ritu V Kimbahune, Prachi V Kabral,
Harish A.R, Nargund L.V.G. Spectrophotometric
Estimation of Metaxalone and Diclofenac Potassium by
Multicomponent Analytical Method from tablet dosage
form. J Anal Bioanaly Tech. 2012; 3 [3]: 1-3.
2. Prachi Kabra, Chintan Patel, Ritu Kimbahune, Neha Raj,
Nargund LVG. Simultaneous spectrophotometric
estimation of Metaxalone and Diclofenac Potassium
tablet dosage form. Int J Pharm Sci Rev Res. 2012; 15 [1]:
36-40.
3. Gabhane K.B, Kasture A.V, Shrikhande V.N, Brade L.N,
Wankhande V.P. Simultaneous Spectrophotometric
determination of Metaxalone and Diclofenac Potassium
in combined tablet dosage form. Int J Chem Sci. 2009; 7
[1]: 539-545.
4. Iffath Rizwana, Vanitha Prakash K, Krishna Mohan G.
Simple and sensitive RP-HPLC method for the
determination of Metaxalone in bulk and its
Pharmaceutical formulations. W J Pharm Pharma Sci.
2014; 3 [3]: 1131-1137.
5. Sagar Suman Panda, Debasis Patanaik, Bera V.V. Ravi
Kumar. New Stability indicating RP-HPLC method for the
determination of Diclofenac Potassium and Metaxalone
from their combined dosage form. J Sci Pharm. 2012; 80:
127-137.
6. Rakshit Kanubhai Trivedi, Mukesh C. Patel. Development
of a Stability indicating RP-UPLC method for rapid
determination of Metaxalone and its degradation
products in solid oral dosage form. J Sci Pharma. 2012;
80: 353-366.
7. Karthikeyan K, Vasantharaju S.G, Hariprabhu N, Arul
Kumaran K, Govindarajan S. Bioanalytical method
development, Validation and Quantification of
Metaxalone in rat plasma by Liquid chromatography
Tandem Mass Spectroscopy. J Bioanal Biomed. 2012; S6
[006]: 1-7.
8. Gosami D, Saha A, Gurule S, Khuroo A, Monif T, Vats P.
Metaxalone estimation in biological matrix using high-
throughput LC-MS/MS bioanalytical method. Journal of
Chromatograph B, Analytical technologies in the
Biomedical and life sciences. 2012; 902: 132-136.
9. Rama Krishna V.S. Nigori, Vishwottam N. Kandikere,
Manoj S, Koteshwara M, Shrivastava W, Praveen V. Datla.
Quantification of Metaxalone in human plasma by Liquid
Chromatography Coupled to Tandem Mass Spectroscopy.
Journal of Analytical Toxicology. 2005; 30 [4]: 245-251.
10. US Department of Health and Human Services, Food and
Drug Administration, Guidance for Industry Bioanalytical
Method Validation. 2001; Available from:
http://www.fda.gov/downloads.Drugs/Guidancecompli
anceregulatoryInformation/Guidances/UCM070107.pdf
[Last acessed on 2014 Aug 4].
How to cite this article: Chaitanya Sucharitha Kolakaluri*,
Anusha Goli,G. Saravanan,D. Visaga Perumal; Quantization
of Metaxalone in Human Plasma using High - Performance Liquid Chromatography- Tandem Mass Spectroscopy; J. Adv. Pharm. Edu. & Res. 2015: 5(2): 70-76.
![Figure 3 [A,B].](https://thumb-us.123doks.com/thumbv2/123dok_us/8764331.1753635/2.595.126.471.426.766/figure-a-b.webp)