*Corresponding author: Nikita N. Golunov, email: [email protected] http://doi.org/10.28999/2514-541X-2019-3-1-46-51
© 2019 Pipeline Science and Technology. Published by Pipeline Transport Institute in association with Great Southern Press Pty Ltd. All rights reserved.
Petroleum products interface volume
reduction in back-to-back batching
by Nikita N. Golunov*
11 Gubkin Russian State University of Oil and Gas (National Research University), Moscow, Russian Federation
ARTICLE INFO
Received: 11 April 2019 Accepted: 31 May 2019
RESEARCH PAPER
ABSTRACT
T
he paper deals with interface mixing in back-to-back batching light petroleum products along the same pipeline. It is known that when one petroleum product is pumped back-to-back in the line without any separating device, a mixture is formed in the interface area of consistently moving batches, which is generally a substandard product. Therefore, the issue of reducing the substandard product volume is an important task that attracts an attention of scientists for many years. Since it is known that the volume of the resulting mixture depends on the intensity of convection and turbulent diffusion processes in the fluid flow in the line, the hydraulic drag reduction, at least in the contact area of petroleum products, can reduce the interface volume. It is shown that drag-reducing agents, usually injected into the flow of the transported liquid, can also be successfully used to reduce the volume of the substandard mixture. Formulas are given for calculating the hydraulic drag coefficient of a liquid with a drag-reducing agent depending on the concentration of this additive, the Reynolds number and the relative equivalent roughness of the inner pipe wall. The main aspects of the drag-reducing agent injection to reduce the petroleum products interface mixing in back-to-back batching are presented.Key words: pipeline, petroleum products, back-to-back batching, petroleum products mixture, axial mixing coefficient, interface volume, hydraulic drag coefficient, drag-reducing agent, reduction of the interface volume.
INTRODUCTION
General
Back-to-back batching of petroleum products via pipeline is one of the ways of transport in Russia with more than 30 million tons of petroleum products transported annually. The process of back-to-back batching means that various petroleum products are pumped into the main pipeline at the head pump station in a predetermined sequence, and in the final point are received into separate tanks. This technology enables the full pipeline loading and significantly reduce the cost of transportation of petroleum products.
On the other hand, the batching technology has a significant disadvantage, namely the interfacing of transported petroleum products in the contact zone. The key reasons for interfacing are:
• non-uniform profile of the petroleum products flow velocities in the cross-section of the pipe (the velocity near the pipe wall is lower than in the base flow, center of the pipe, due to the hydraulic drag)
• random mixing of petroleum products particles in the turbulent batching conditions.
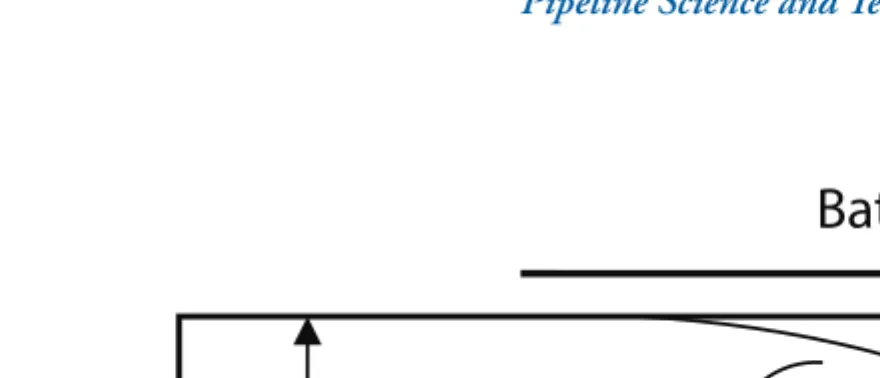
As a result, it turns out that the petroleum product moving behind drives a wedge into the fluid moving ahead due to the non-uniform velocity profile (convective diffusion), and the turbulent mixing forces contribute to the mass transfer of one product to another and vice versa (turbulent diffusion). These processes are inseparable from each other and act in the batching process, constantly leading to an increase in the volume of the resulting mixture. Fig. 1 shows the mechanism of forming an interface (mixing zone) of transported petroleum products.
For a significant time, various scientists were engaged in the studies of mixing processes in the sequential movement of liquids in the pipes, in our country – V. Maron, M. Lurie, M. Nechval, V. Novoselov, P. Tugunov, I. Khizgilov, V. Yufin, V. Yablonsky, and overseas – F. Sienitzer, G. Taylor and many others. For the first time, the theory of the mixing process during the liquid flow in the pipe was developed by G. Taylor [1, 2], who used a one-dimensional model and established the methodological base for all subsequent theoretical and experimental studies in this area. Taylor’s model serves as the basement to develop the
Figure 1. Mixing process in the interface of sequentially moving petroleum products.
transfer theory in the pipeline. Taylor derived a one-dimensional model for the transfer of a “passive” particle during laminar and turbulent flows in a pipe based on an approximate solution of the spatial transfer problem, which assumes that the presence of one liquid in another does not affect the transfer processes of the amount of substance and the momentum. Based on this assumption, the velocity profile in the interface is no different from the velocity profile in a uniform flow. Taylor assumed that each of the mixing liquids fills the entire area of the multiphase flow, i.e. has a density and an average flow velocity for each of the liquids.
As a result of the study, Taylor introduced the concept of the proportional factor K, usually called the effective axial dispersion coefficient or the effective diffusion coefficient. This coefficient is the main characteristic of the substance axial dispersion in the flow and integrally considers the local convection and diffusion transfer of particles of mixing liquids in the pipe.
Since K-coefficient of axial dispersion depends on the structure of the turbulent flow in the pipeline, and that, in turn, gradually changes in the interface due to changes in density and viscosity, K-coefficient can be represented by the distribution function c(x,t) of the cross-section average concentration of the displacing petroleum product in the mixture. To do this, the equation is used that can significantly simplify the mathematics of the study, since the methods of solving equations of this type are well-known:
(1)
Where average batching velocity, x – axial coordinate of the pipeline, t – time. One should note that if K-coefficient of the axial dispersion is considered to be constant, the equation
(1) reduces to the equation of the heat conductivity type (“the axial diffusion equation”):
(3)
Taylor’s works had a significant impact on all subsequent studies of the mixing process and formed the basis for research activities in this area. The main areas for the mixing process consideration are theoretical and experimental studies related to the distribution of the average concentration in the pipe cross-section, the effective diffusion coefficient, the size of the mixing volume, etc.
Currently, the basic formula to calculate volume of petroleum products mixture Vmix formed during back-to-back batching is the Sienitzer-Maron formula [3]:
(4)
where λ1, λ2 ‒ hydraulic drag coefficients for the 1st and the 2nd back-to-back petroleum products; d ‒ inner pipeline diameter, m; Vpl ‒ the pipeline inner cavity volume, m3; L ‒ pipeline length, m.
The interface volume in this formula depends on the value of hydraulic drag coefficient λ, more specifically to a rather high degree – 1,8. It follows that a decrease in the hydraulic drag coefficient λ1, λ2 in the interface zone of the batches will lead to a decrease in the volume of the resulting mixture of interfacing petroleum products
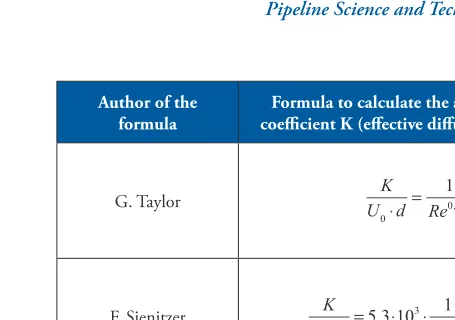
Table 1 shows some formulas to calculate the axial dispersion coefficient K (effective diffusion coefficient) and the hydraulic drag coefficient λ proposed by various authors.
Batching direction
petroleum product
petroleum product
R
*Corresponding author: Nikita N. Golunov, email: [email protected] http://doi.org/10.28999/2514-541X-2019-3-1-46-51
© 2019 Pipeline Science and Technology. Published by Pipeline Transport Institute in association with Great Southern Press Pty Ltd. All rights reserved.
Petroleum products interface volume
reduction in back-to-back batching
by Nikita N. Golunov*
11 Gubkin Russian State University of Oil and Gas (National Research University), Moscow, Russian Federation
ARTICLE INFO
Received: 11 April 2019 Accepted: 31 May 2019
ABSTRACT
T
he paper deals with interface mixing in back-to-back batching light petroleum products along the same pipeline. It is known that when one petroleum product is pumped back-to-back in the line without any separating device, a mixture is formed in the interface area of consistently moving batches, which is generally a substandard product. Therefore, the issue of reducing the substandard product volume is an important task that attracts an attention of scientists for many years. Since it is known that the volume of the resulting mixture depends on the intensity of convection and turbulent diffusion processes in the fluid flow in the line, the hydraulic drag reduction, at least in the contact area of petroleum products, can reduce the interface volume. It is shown that drag-reducing agents, usually injected into the flow of the transported liquid, can also be successfully used to reduce the volume of the substandard mixture. Formulas are given for calculating the hydraulic drag coefficient of a liquid with a drag-reducing agent depending on the concentration of this additive, the Reynolds number and the relative equivalent roughness of the inner pipe wall. The main aspects of the drag-reducing agent injection to reduce the petroleum products interface mixing in back-to-back batching are presented.Key words: pipeline, petroleum products, back-to-back batching, petroleum products mixture, axial mixing coefficient, interface volume, hydraulic drag coefficient, drag-reducing agent, reduction of the interface volume.
INTRODUCTION
General
Back-to-back batching of petroleum products via pipeline is one of the ways of transport in Russia with more than 30 million tons of petroleum products transported annually. The process of back-to-back batching means that various petroleum products are pumped into the main pipeline at the head pump station in a predetermined sequence, and in the final point are received into separate tanks. This technology enables the full pipeline loading and significantly reduce the cost of transportation of petroleum products.
On the other hand, the batching technology has a significant disadvantage, namely the interfacing of transported petroleum products in the contact zone. The key reasons for interfacing are:
• non-uniform profile of the petroleum products flow velocities in the cross-section of the pipe (the velocity near the pipe wall is lower than in the base flow, center of the pipe, due to the hydraulic drag)
• random mixing of petroleum products particles in the turbulent batching conditions.
As a result, it turns out that the petroleum product moving behind drives a wedge into the fluid moving ahead due to the non-uniform velocity profile (convective diffusion), and the turbulent mixing forces contribute to the mass transfer of one product to another and vice versa (turbulent diffusion). These processes are inseparable from each other and act in the batching process, constantly leading to an increase in the volume of the resulting mixture. Fig. 1 shows the mechanism of forming an interface (mixing zone) of transported petroleum products.
For a significant time, various scientists were engaged in the studies of mixing processes in the sequential movement of liquids in the pipes, in our country – V. Maron, M. Lurie, M. Nechval, V. Novoselov, P. Tugunov, I. Khizgilov, V. Yufin, V. Yablonsky, and overseas – F. Sienitzer, G. Taylor and many others. For the first time, the theory of the mixing process during the liquid flow in the pipe was developed by G. Taylor [1, 2], who used a one-dimensional model and established the methodological base for all subsequent theoretical and experimental studies in this area. Taylor’s model serves as the basement to develop the
Figure 1. Mixing process in the interface of sequentially moving petroleum products.
transfer theory in the pipeline. Taylor derived a one-dimensional model for the transfer of a “passive” particle during laminar and turbulent flows in a pipe based on an approximate solution of the spatial transfer problem, which assumes that the presence of one liquid in another does not affect the transfer processes of the amount of substance and the momentum. Based on this assumption, the velocity profile in the interface is no different from the velocity profile in a uniform flow. Taylor assumed that each of the mixing liquids fills the entire area of the multiphase flow, i.e. has a density and an average flow velocity for each of the liquids.
As a result of the study, Taylor introduced the concept of the proportional factor K, usually called the effective axial dispersion coefficient or the effective diffusion coefficient. This coefficient is the main characteristic of the substance axial dispersion in the flow and integrally considers the local convection and diffusion transfer of particles of mixing liquids in the pipe.
Since K-coefficient of axial dispersion depends on the structure of the turbulent flow in the pipeline, and that, in turn, gradually changes in the interface due to changes in density and viscosity, K-coefficient can be represented by the distribution function c(x,t) of the cross-section average concentration of the displacing petroleum product in the mixture. To do this, the equation is used that can significantly simplify the mathematics of the study, since the methods of solving equations of this type are well-known:
(1)
Where average batching velocity, x – axial coordinate of the pipeline, t – time. One should note that if K-coefficient of the axial dispersion is considered to be constant, the equation
(1) reduces to the equation of the heat conductivity type (“the axial diffusion equation”):
(3)
Taylor’s works had a significant impact on all subsequent studies of the mixing process and formed the basis for research activities in this area. The main areas for the mixing process consideration are theoretical and experimental studies related to the distribution of the average concentration in the pipe cross-section, the effective diffusion coefficient, the size of the mixing volume, etc.
Currently, the basic formula to calculate volume of petroleum products mixture Vmix formed during back-to-back batching is the Sienitzer-Maron formula [3]:
(4)
where λ1, λ2 ‒ hydraulic drag coefficients for the 1st and the 2nd back-to-back petroleum products; d ‒ inner pipeline diameter, m; Vpl ‒ the pipeline inner cavity volume, m3; L ‒ pipeline length, m.
The interface volume in this formula depends on the value of hydraulic drag coefficient λ, more specifically to a rather high degree – 1,8. It follows that a decrease in the hydraulic drag coefficient λ1, λ2 in the interface zone of the batches will lead to a decrease in the volume of the resulting mixture of interfacing petroleum products
Table 1 shows some formulas to calculate the axial dispersion coefficient K (effective diffusion coefficient) and the hydraulic drag coefficient λ proposed by various authors.
Batching direction
petroleum product
petroleum product
R
Effect of drag reducers
It is known that the hydraulic drag coefficient λ can be reduced by injecting small amounts of drag-reducing agents into the flow; their effect is based on dampening the turbulent pulsations of the pumped liquid near the inner wall of the pipeline due to the interaction of long molecules of the additive with turbulent vortices. The performance of drag-reducing agents is achieved at their low concentrations, measured in ppm of the volume of liquid, to which they are added. This phenomenon was called the Toms effect [4] in honor of the English scientist B. Toms, who presented the result of his study at the International Rheological Congress in the Netherlands in 1948.
The authors [5-7] have proposed the formulas to determine the hydraulic drag coefficient λ as follows:
(5)
(6)
where Re=vd/ν ‒ Reynolds number; v ‒ average flow velocity, m/s; ν ‒ kinematic viscosity coefficient, m2/s; æ – Karman constant (æ ≈ 0,4); a – phenomenological constant (a ≈ 0,31); k(θ) – function reflecting the interaction of the turbulent flow with the pipe walls, depending on the concentration θ of the drag-reducing agent, while k(0)=28; ε=∆/d – relative
Author of the
formula coefficient K (effective diffusion coefficient)Formula to calculate the axial dispersion Formula to calculate the hydraulic drag coefficient λ
G. Taylor
F. Sienitzer
V. Yablonsky, A. Asaturyan, I. Khizgilov
S. Goldenberg
M. Nechval, V. Yablonsky,
Table 1. Formulas to calculate the axial dispersion coefficient K and the hydraulic drag coefficient λ.
θ, ppm 0 40 60 100 180
k(θ) 28 50 75 150 340
Table 2. Dependence of k(θ) on the drag-reducing agent “Neccad-547” concentration θ.
roughness of the internal surface of the pipeline; ∆ ‒ absolute roughness, m; d ‒ inner diameter, m; θ ‒ concentration of the drag-reducing agent, ppm.
Let’s calculate the effect of the drag-reducing agent concentration θ on the hydraulic drag coefficient λ, using the drag-reducing agent “Neccad-547” as the example. Table 2 shows the dependence of k(θ) – function on the drag-reducing agent “Neccad-547” concentration θ.
Table 3 shows the results of hydraulic drag coefficient λ calculation, using the formula (5) for Reynolds numbers 30 000, 100 000 и 1 000 000 (the relevant k(θ) coefficient values are given in brackets, relative roughness ε = 0).
This table indicates that the coefficient λ for each fixed Reynolds number decreases as the drag-reducing agent concentration increases, therefore, according to the formula (4), the interface volume Vmix of petroleum products sequentially moving through the pipeline decreases too.
To build the average velocity profile and to perform the necessary calculations, the following formulas were used:
• Prof. M. Lurie’s formula [6]:
where (7)
• Prof. Bai-Shi-I’s formula [8]
(8) Re
θ, ppm (k) 30 000 100 000 1 000 000
0 (28) 0.0227 0.0174 0.0113
40 (50) 0.0199 0.0155 0.0102
60 (75) 0.0182 0.0143 0.0096
100 (150) 0.0158 0.0126 0.0086
180 (340) 0.0135 0.0109 0.0076
Table 3. Dependence of hydraulic drag coefficient λ on the Reynolds number and the agent “Neccad-547” concentration θ.
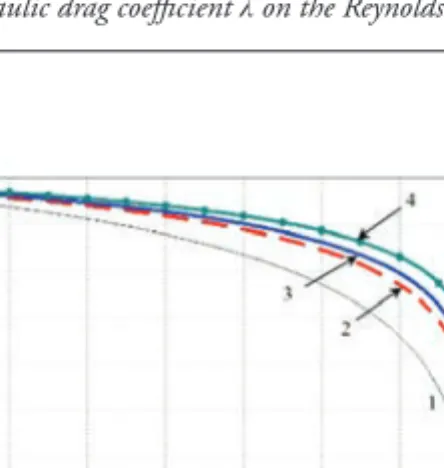
Figure 2. Dimensionless profiles of average velocities versus Reynolds number Re: a) Prof. M. Lurie’s formula (7); b) Prof. Bai-Shi-I’s formula (8). 1 – Re = 1 000, 2 – Re = 30 000, 3 – Re = 100 000, 4 – Re = 1 000 000.
Effect of drag reducers
It is known that the hydraulic drag coefficient λ can be reduced by injecting small amounts of drag-reducing agents into the flow; their effect is based on dampening the turbulent pulsations of the pumped liquid near the inner wall of the pipeline due to the interaction of long molecules of the additive with turbulent vortices. The performance of drag-reducing agents is achieved at their low concentrations, measured in ppm of the volume of liquid, to which they are added. This phenomenon was called the Toms effect [4] in honor of the English scientist B. Toms, who presented the result of his study at the International Rheological Congress in the Netherlands in 1948.
The authors [5-7] have proposed the formulas to determine the hydraulic drag coefficient λ as follows:
(5)
(6)
where Re=vd/ν ‒ Reynolds number; v ‒ average flow velocity, m/s; ν ‒ kinematic viscosity coefficient, m2/s; æ – Karman constant (æ ≈ 0,4); a – phenomenological constant (a ≈ 0,31); k(θ) – function reflecting the interaction of the turbulent flow with the pipe walls, depending on the concentration θ of the drag-reducing agent, while k(0)=28; ε=∆/d – relative
Author of the
formula coefficient K (effective diffusion coefficient)Formula to calculate the axial dispersion Formula to calculate the hydraulic drag coefficient λ
G. Taylor
F. Sienitzer
V. Yablonsky, A. Asaturyan, I. Khizgilov
S. Goldenberg
M. Nechval, V. Yablonsky,
Table 1. Formulas to calculate the axial dispersion coefficient K and the hydraulic drag coefficient λ.
θ, ppm 0 40 60 100 180
k(θ) 28 50 75 150 340
Table 2. Dependence of k(θ) on the drag-reducing agent “Neccad-547” concentration θ.
roughness of the internal surface of the pipeline; ∆ ‒ absolute roughness, m; d ‒ inner diameter, m; θ ‒ concentration of the drag-reducing agent, ppm.
Let’s calculate the effect of the drag-reducing agent concentration θ on the hydraulic drag coefficient λ, using the drag-reducing agent “Neccad-547” as the example. Table 2 shows the dependence of k(θ) – function on the drag-reducing agent “Neccad-547” concentration θ.
Table 3 shows the results of hydraulic drag coefficient λ calculation, using the formula (5) for Reynolds numbers 30 000, 100 000 и 1 000 000 (the relevant k(θ) coefficient values are given in brackets, relative roughness ε = 0).
This table indicates that the coefficient λ for each fixed Reynolds number decreases as the drag-reducing agent concentration increases, therefore, according to the formula (4), the interface volume Vmix of petroleum products sequentially moving through the pipeline decreases too.
To build the average velocity profile and to perform the necessary calculations, the following formulas were used:
• Prof. M. Lurie’s formula [6]:
where (7)
• Prof. Bai-Shi-I’s formula [8]
(8) Re
θ, ppm (k) 30 000 100 000 1 000 000
0 (28) 0.0227 0.0174 0.0113
40 (50) 0.0199 0.0155 0.0102
60 (75) 0.0182 0.0143 0.0096
100 (150) 0.0158 0.0126 0.0086
180 (340) 0.0135 0.0109 0.0076
Table 3. Dependence of hydraulic drag coefficient λ on the Reynolds number and the agent “Neccad-547” concentration θ.
Figure 2. Dimensionless profiles of average velocities versus Reynolds number Re: a) Prof. M. Lurie’s formula (7); b) Prof. Bai-Shi-I’s formula (8). 1 – Re = 1 000, 2 – Re = 30 000, 3 – Re = 100 000, 4 – Re = 1 000 000.
where
Fig. 2 (a, b) illustrates the dimensionless profiles of average velocities versus Reynolds numbers, calculated using Prof. M. Lurie’s formula (7) and Prof. Bai-Shi-I’s formula (8). The lower curve 1 characterizes the laminar flow, the upper curves 2-4 characterize the turbulent flow.
One can see from Fig. 2 that the increase in the Reynolds number leads to more filled velocity profiles, thus promoting a more complete displacement of one product by another. This fact is confirmed by the observation known in practice: the higher is the pumping velocity in the pipe, the smaller is the volume of the resulting mixture.
Fig. 3 (a, b) illustrates the dimensionless profiles of average
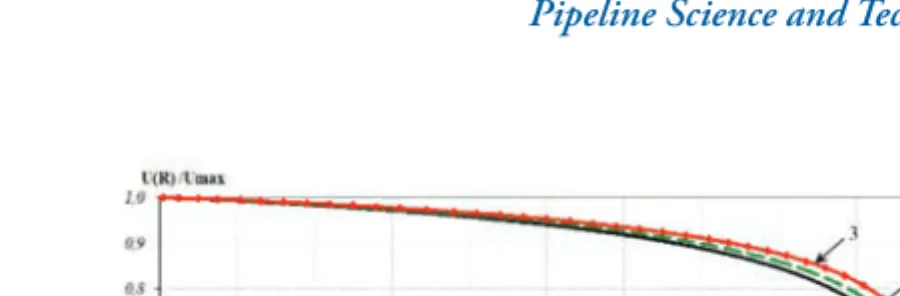
velocities versus drag-reducing agent concentration calculated using Prof. M. Lurie’s formula (7) and Prof. Bai-Shi-I’s formula (8) at Reynolds number Re = 30 000. The lower curve 1 characterizes batching without agent θ = 0 ppm, the upper curves 2 and 3 characterize batching with agent concentration θ = 60 ppm and θ = 180 ppm, accordingly.
One can conclude from Fig. 3 that the more is the concentration of the additive, the higher the dimensionless profile of averaged velocities is located (filled) at the same Reynolds number; the displacement efficiency of one liquid by another depends on the concentration of a drag-reducing agent: the more is its concentration, the higher is the efficiency of the front-end petroleum product displacement by the rear-end petroleum product. Thus, injecting a drag-reducing agent into the flow of sequentially pumped liquids leads to more efficient displacement of the front-end liquid by the rear-end liquid and, consequently, to a reduction in the interface volume.
Method to reduce the interface volume
To optimize the back-to-back sequential batching of petroleum products, a patented method is proposed [9]. The scheme of this method implementation is shown in Fig. 4. Figure 3. Dimensionless profiles of average velocities versus drag-reducing agent concentration at Reynolds number Re = 30 000: Prof. M. Lurie formula (7); b) Prof. Bai-Shi-I formula (8): 1 – θ = 0 ppm, 2 – θ = 60 ppm, 3 – θ = 180 ppm.
Figure 4. Implementation of the method to reduce the interface volume in sequential batching of petroleum products.
a b
Petroleum product No.2 with injected
small amount of drag-reducing agent Petroleum product No.1 with injected small amount of drag-reducing agent
The separating pill is formed in the interface zone of the displaced petroleum product No. 1 and the displacing petroleum product No. 2. To do that, the drag-reducing agent is injected in the “tail” of the displaced petroleum product batch and in the “head” of the displacing batch. Since the agent is in the petroleum products interface, the distribution of liquid velocities in the pipeline cross-section becomes more uniform, the hydraulic drag coefficient goes down, and the efficiency of displacing one petroleum product by another increases, therefore, the volume of the mixture decreases.
Conclusions
Based on the above, the following conclusions can be made: 1. The key objective of back-to-back sequential pumping
technology of the multi-grade petroleum products is to optimize the interface generation in transported petroleum products.
2. The estimation of the resulting interface volume is largely determined by the K-coefficient of axial dispersion (effective diffusion coefficient) and the hydraulic drag coefficient λ. These parameters depend on the concentration of the drag-reducing agent that changes the structure of the flow and, due to the “filling” of the averaged velocity profiles, leads to more efficient displacement of one product by another. 3. The procedure to calculate the axial dispersion
K-coefficient and the hydraulic drag coefficient λ when injecting the drag-reducing agent into the flow enables to justify and to simulate the mechanism for optimizing the back-to-back sequential pumping process of the multi-grade petroleum products, regarding the reduction in the resulting interface volume.
Competing interests
The authors declare that there is no competing interest regarding the publication of this paper.
References:
[1] Taylor G. Dispersion of soluble matter in solvent flowing slowly through a tube // Proceedings of the Royal Society A: Mathematical and Physical Sciences. 1953. Vol. 219. № 1137. P. 186–203.
[2] Taylor G. The dispersion of matter in turbulent flow through a pipe. // Proceedings of the Royal Society A: Mathematical and Physical Sciences. 1954. Vol. 223. № 1155. P. 447–468.
[3] Maron V.I. Nonstationary Substance Transfer in a Pipeline Fluid Flow [dissertation]. Moscow: Gubkin Moscow Institute of Petrochemical and Gas Industry named after Ivan Gubkin; 1974. 389 p. (In Russ.) [4] Toms B. Some observations on the flow of linear
polymer solutions through straight tubes at large Reynolds numbers. // Proceedings of the 1st International Congress on Rheology. Amsterdam: North Holland Publ.; 1948. Vol. 2. P .135–141. [5] Ishmukhametov I.T., Isaev S.L., Lurie M.V., Makarov
S.P. Petroleum products pipeline transport. Moscow: Oil and Gas Publ.; 1999. 300 p. (In Russ.)
[6] Lurie M.V. Mathematical modeling of processes in pipeline transport of oil, petroleum products and gas. Textbook. – M.: Federal state unitary enterprise Publishing house “Oil and gas” at Gubkin Russian state University of oil and gas, 2003, p. 103 (In Russ.) [7] Lurie M.V., Golunov N.N. Application of bench test
results of small drag-reducing additives for hydraulic design of industrial analysis // Science and technology of pipeline transportation of oil and petroleum products. 2016. #4 (24). p. 32–37. (In Russ.)
[8] Bai Shi-I. Turbulent Flow of Fluids and Gases. – Moscow: Foreign Literature Publishing House; 1962. 344 p. (In Russ.)
[9] Patent 2256119, Russian Federation, MPC7 F 17 D 1/14. Method of multi-grade petroleum products’ back-to-back batching. // Lurie M. V. Golunov, N. N. ; Applicant and patent holder – Gubkin Russian state University of oil and gas #2003135890/06; appl. 10.12.2003; publ. 10.07.2005, Bull. No. 19. – 5 p. (In Russ.)
where
Fig. 2 (a, b) illustrates the dimensionless profiles of average velocities versus Reynolds numbers, calculated using Prof. M. Lurie’s formula (7) and Prof. Bai-Shi-I’s formula (8). The lower curve 1 characterizes the laminar flow, the upper curves 2-4 characterize the turbulent flow.
One can see from Fig. 2 that the increase in the Reynolds number leads to more filled velocity profiles, thus promoting a more complete displacement of one product by another. This fact is confirmed by the observation known in practice: the higher is the pumping velocity in the pipe, the smaller is the volume of the resulting mixture.
Fig. 3 (a, b) illustrates the dimensionless profiles of average
velocities versus drag-reducing agent concentration calculated using Prof. M. Lurie’s formula (7) and Prof. Bai-Shi-I’s formula (8) at Reynolds number Re = 30 000. The lower curve 1 characterizes batching without agent θ = 0 ppm, the upper curves 2 and 3 characterize batching with agent concentration θ = 60 ppm and θ = 180 ppm, accordingly.
One can conclude from Fig. 3 that the more is the concentration of the additive, the higher the dimensionless profile of averaged velocities is located (filled) at the same Reynolds number; the displacement efficiency of one liquid by another depends on the concentration of a drag-reducing agent: the more is its concentration, the higher is the efficiency of the front-end petroleum product displacement by the rear-end petroleum product. Thus, injecting a drag-reducing agent into the flow of sequentially pumped liquids leads to more efficient displacement of the front-end liquid by the rear-end liquid and, consequently, to a reduction in the interface volume.
Method to reduce the interface volume
To optimize the back-to-back sequential batching of petroleum products, a patented method is proposed [9]. The scheme of this method implementation is shown in Fig. 4. Figure 3. Dimensionless profiles of average velocities versus drag-reducing agent concentration at Reynolds number Re = 30 000: Prof. M. Lurie formula (7); b) Prof. Bai-Shi-I formula (8): 1 – θ = 0 ppm, 2 – θ = 60 ppm, 3 – θ = 180 ppm.
Figure 4. Implementation of the method to reduce the interface volume in sequential batching of petroleum products.
a b
Petroleum product No.2 with injected
small amount of drag-reducing agent Petroleum product No.1 with injected small amount of drag-reducing agent
The separating pill is formed in the interface zone of the displaced petroleum product No. 1 and the displacing petroleum product No. 2. To do that, the drag-reducing agent is injected in the “tail” of the displaced petroleum product batch and in the “head” of the displacing batch. Since the agent is in the petroleum products interface, the distribution of liquid velocities in the pipeline cross-section becomes more uniform, the hydraulic drag coefficient goes down, and the efficiency of displacing one petroleum product by another increases, therefore, the volume of the mixture decreases.
Conclusions
Based on the above, the following conclusions can be made: 1. The key objective of back-to-back sequential pumping
technology of the multi-grade petroleum products is to optimize the interface generation in transported petroleum products.
2. The estimation of the resulting interface volume is largely determined by the K-coefficient of axial dispersion (effective diffusion coefficient) and the hydraulic drag coefficient λ. These parameters depend on the concentration of the drag-reducing agent that changes the structure of the flow and, due to the “filling” of the averaged velocity profiles, leads to more efficient displacement of one product by another. 3. The procedure to calculate the axial dispersion
K-coefficient and the hydraulic drag coefficient λ when injecting the drag-reducing agent into the flow enables to justify and to simulate the mechanism for optimizing the back-to-back sequential pumping process of the multi-grade petroleum products, regarding the reduction in the resulting interface volume.
Competing interests
The authors declare that there is no competing interest regarding the publication of this paper.
References:
[1] Taylor G. Dispersion of soluble matter in solvent flowing slowly through a tube // Proceedings of the Royal Society A: Mathematical and Physical Sciences. 1953. Vol. 219. № 1137. P. 186–203.
[2] Taylor G. The dispersion of matter in turbulent flow through a pipe. // Proceedings of the Royal Society A: Mathematical and Physical Sciences. 1954. Vol. 223. № 1155. P. 447–468.
[3] Maron V.I. Nonstationary Substance Transfer in a Pipeline Fluid Flow [dissertation]. Moscow: Gubkin Moscow Institute of Petrochemical and Gas Industry named after Ivan Gubkin; 1974. 389 p. (In Russ.) [4] Toms B. Some observations on the flow of linear
polymer solutions through straight tubes at large Reynolds numbers. // Proceedings of the 1st International Congress on Rheology. Amsterdam: North Holland Publ.; 1948. Vol. 2. P .135–141. [5] Ishmukhametov I.T., Isaev S.L., Lurie M.V., Makarov
S.P. Petroleum products pipeline transport. Moscow: Oil and Gas Publ.; 1999. 300 p. (In Russ.)
[6] Lurie M.V. Mathematical modeling of processes in pipeline transport of oil, petroleum products and gas. Textbook. – M.: Federal state unitary enterprise Publishing house “Oil and gas” at Gubkin Russian state University of oil and gas, 2003, p. 103 (In Russ.) [7] Lurie M.V., Golunov N.N. Application of bench test
results of small drag-reducing additives for hydraulic design of industrial analysis // Science and technology of pipeline transportation of oil and petroleum products. 2016. #4 (24). p. 32–37. (In Russ.)
[8] Bai Shi-I. Turbulent Flow of Fluids and Gases. – Moscow: Foreign Literature Publishing House; 1962. 344 p. (In Russ.)
[9] Patent 2256119, Russian Federation, MPC7 F 17 D 1/14. Method of multi-grade petroleum products’ back-to-back batching. // Lurie M. V. Golunov, N. N. ; Applicant and patent holder – Gubkin Russian state University of oil and gas #2003135890/06; appl. 10.12.2003; publ. 10.07.2005, Bull. No. 19. – 5 p. (In Russ.)