w w w . i a j p s . c o m
Page 2195CODEN [USA]: IAJPBB ISSN: 2349-7750
I
I
N
N
D
D
O
O
A
A
M
M
E
E
R
R
I
I
C
C
A
A
N
N
J
J
O
O
U
U
R
R
N
N
A
A
L
L
O
O
F
F
P
P
H
H
A
A
R
R
M
M
A
A
C
C
E
E
U
U
T
T
I
I
C
C
A
A
L
L
S
S
C
C
I
I
E
E
N
N
C
C
E
E
S
S
http://doi.org/10.5281/zenodo.838698
Available online at: http://www.iajps.com Research Article
STABILITY INDICATING METHOD DEVELOPMENT AND
VALIDATION FOR SIMULTANEOUS ESTIMATION OF
CEFOPERAZONE AND TAZOBACTAM BY USING
RP-HPLC
Sri Viswa Madhuri Vytla
1, S.V.U.M. Prasad
2, Mangamma Kuna
1 1School of Pharmaceutical Sciences and Technologies, JNTUK Kakinada
2
Department of Pharmaceutical Analysis & Quality Assurance, School of Pharmaceutical
Sciences and Technologies, JNTUK, Kakinada, Andhra Pradesh, India.
Abstract:A simple, Accurate, precise method was developed for the simultaneous estimation of the Cefoperazone and Tazobactam in Tablet dosage form. Chromatogram was run through Kromasil C18 250 x 4.6 mm, 5. Mobile phase containing Buffer Perchloric acid: Acetonitrile taken in the ratio 55:45 was pumped through column at a flow rate of 1 ml/min. Buffer used in this method was 0.1% Perchloric acid buffer. Temperature was maintained at 30°C. Optimized wavelength selected was 230 nm. Retention time of Cefoperazone and Tazobactam were found to be 3.751 min and 2.568min. %RSD of the Cefoperazone and Tazobactam were and found to be 0.4% and 0.5% respectively. %Recovery was obtained as98.77% and 98.58% for Cefoperazone and Tazobactam respectively. LOD, LOQ values obtained from regression equations of Cefoperazone and Tazobactam were 0.10, 0.31 and 0.02, 0.05 respectively. Regression equation of Cefoperazone is y = 7979.x + 15373, and y = 19820x + 5778 of Tazobactam. Retention times were decreased and run time was decreased, so the method developed was simple and economical that can be adopted in regular Quality control test in Industries.
Key Words: Cefoperazone, Tazobactam, RP-HPLC, Simultaneous estimation, Validation as per ICH guidelines, Stability studies.
Corresponding author:
Sri Viswa Madhuri Vytla,
M. Pharmacy,
School of Pharmaceutical Sciences and Technologies,
JNTUK, Kakinada – 533003,
Mobile: 7075045999
Email Id:
[email protected]
Please cite this article in press as Sri Viswa Madhuri V et al, Stability Indicating Method Development and
Validation for Simultaneous Estimation of Cefoperazone and Tazobactam by Using RP-HPLC, Indo Am.
J. P. Sci, 2017; 4(07).
w w w . i a j p s . c o m
Page 2196 INTRODUCTION:Cefoperazone is a third-generation cephalosporin antibiotic. Chemically, it is (6R,7R)-7-{2-[(4-ethyl-2,3-dioxopiperazine-1-carbonyl) amino]-2-(4-hydroxyphenyl) acetamido}-3-{[(1-methyl-1H-1,2,3,4-tetrazol-5-yl) sulfanyl] methyl}-8-oxo-5-thia-1-azabicyclo [4.2.0] oct-2-ene-2-carboxylic acid. Like all beta-lactam antibiotics, cefoperazone binds to specific penicillin-binding proteins (PBPs) located inside the bacterial cell wall, causing the inhibition of the third and last stage of bacterial cell wall synthesis. Cell lysis is then mediated by bacterial cell wall autolytic enzymes such as autolysins.
Tazobactam is a β-lactam antibiotic. Chemically, it is (2S,3S,5R)-3-methyl-4,4,7-trioxo-3-(1H-1,2,3-triazol-1-ylmethyl)-4λ⁶-thia-1-azabicyclo [3.2.0] heptane-2-carboxylic acid. It broadens the spectrum of piperacillin by making it effective against organisms that express beta-lactamase and would normally degrade piperacillin. It is used in combination with piperacillin to broaden the spectrum of piperacillin antibacterial action [1-4].
a)
b)
Fig 1: Structure of (a) Cefoperazone (b) Tazobactam[5]
Though several methods are reported in literature for the estimation of Cefoperazone and Tazobactam individually, there are only few HPLC methods reported for the simultaneous estimation of Cefoperazone and Tazobactam combination. The objective of the present study is to develop and validate a new RP-HPLC method for simultaneous estimation of Cefoperazone and Tazobactam and its comparison with the earlier reported methods.
EXPERIMENTAL: Materials and reagents
Acetonitrile (Rankem, avantor performance material India limited), HPLC water (Rankem, avantor performance material India limited), Methanol, Ortho phosphoric acid, Potassium dihydrogen ortho phosphate buffer are all from Rankem were used in the study. The working standards of Cefoperazone and Tazobactam were generous gift obtained from Natco Pharma., Hyderabad, India. Rampzone TZ tablet containing Cefoperazone 1000mg, Tazobactam 625mg was kindly supplied by Godrams lifeline.
Instrumentation
Chromatography was performed on a WATERS 2695 HPLC column (Alliance) with an auto sampler and equipped with a 2996 series of PDA detector with a spectral bandpass of 1.2nm. Components were detected using UV and that processing was achieved by Empower 2 software. A hot air oven was used for thermal degradation of the samples and a UV cross inker, with series of 23400 model UV chamber, equipped with a UV fluorescence lamp with the wavelength range between 200 & 300nm was selected for photolytic degradation. Electronic balance (Denver), Ultrasonic bath (BVK enterprises), digital Ph meter (BVK enterprises) were used in the study.
Chromatography conditions
The chromatographic condition was performed on Kromosil C18 column (250 X 4.6mm,5µm particle size) at an ambient column temperature. The samples were eluted using 0.1% OPA: Acetonitrile(55:45v/v) as the mobile phase at a flow rate of 1 ml/min the mobile phase and samples were degassed by ultra-sonication for 20 min and filtered through 0.45µm Nylon(N66)47mm membrane filter. The measurements were carried out with an injection volume of 10μL, flow rate was set to 1.0 mL/min, and UV detection was carried out at 230 nm. All determinations were done at ambient column temperature (30°C). The chromatograms of the prepared standard stock solutions of Cefoperazone and Tazobactam were recorded under optimized chromatographic conditions (Fig. 2).
Diluent
Water and Acetonitrile in 50:50 v/v ratio.
Preparation of Standard Solutions Stock solution of Cefoperazone
w w w . i a j p s . c o m
Page 2197 Stock solution of TazobactamStandard stock solution of Tazobactam was prepared by dissolving 6.25mg mg of Tazobactam in 3/4th of diluent (Water: Acetonitrile, 50:50v/v) in a 10ml clean dry volumetric flask and the solution was sonicated for 10 minutes and filter through 0.45μm nylon membrane filter and make up to the final volume with diluent to get the concentration of 625µg/ml of Tazobactam. The above standard stock solution was suitably diluted with diluent to obtain various concentrations of Tazobactam.
Working Standard Solution
Working standard solutions of Cefoperazone and Tazobactam was prepared by taking 1ml of stock solutions of Cefoperazone and Tazobactam in to clean dry 10ml volumetric flask and make up volume with diluent to get a concentration of 500µg/ml of Cefoperazone and 62.5µg/ml of Tazobactam.
Preparation of Sample Solutions of Cefoperazone, Tazobactam
Five tablets were accurately weighed and calculate the average weight of each tablet then the weight equivalent to one tablet was transferred into 200ml volumetric flask, 100ml of diluent was added and sonicated for 25 minutes, further the volume made up with diluent and filtered. From the filtered solution 1 ml was pipetted out into a 10ml volumetric flask and made up with diluent.
RESULTS AND DISCUSSION:
Optimization of chromatographic conditions Proper selection of the method depends upon the nature of the sample (ionic or ionizable or neutral molecule), its molecular weight and solubility. Cefoperazone and Tazobactam were dissolved in polar solvents, so the developed method of estimation was carried out on reverse phase high performance liquid chromatography. To develop a rugged and suitable HPLC method for the quantitative determination of Cefoperazone, Tazobactam, the analytical conditions were selected after the consideration of different parameters such as diluent, buffer, buffer concentration, organic solvent for mobile phase and mobile phase composition, and other chromatographic conditions. Preliminary trials were taken with different composition of buffer and organic phase of mobile phases with pH range of 2.5–5. The column selection has been done by backpressure, resolution, peak shape, theoretical plates and day-to-day reproducibility
of the retention time and resolution between Cefoperazone and Tazobactam peaks. After evaluating all these factors, a Kromasil C18 column was found to be giving satisfactory results. The selection of acetonitrile and buffer were based on chemical structure of both the drugs. The acidic pH range was found suitable for solubility, resolution, stability, theoretical plates, and peak shape of both components. Best results were obtained with 0.1% OPA pH adjusted to 2.0 that improved the peak shapes of Cefoperazone and Tazobactam. For the selection of organic constituent of mobile phase, acetonitrile was chosen to reduce the longer retention time and to attain good peak shape. Therefore, final mobile phase composition consisting of a mixture of buffer-pH 2.0 (0.1% OPA): Acetonitrile (55:45v/v). Flow rates between 0.5 to1.2ml/min were tried. Flow rate of 1ml/min was observed to be enough to get all the drugs eluted within less than 10min. The column temperature
was set at 30oC. Optimized method was providing good resolution and peak shape for Cefoperazone and Tazobactam. Under above described experimental conditions, all the peaks were well defined and free from tailing. The concern of small deliberate changes in the mobile phase composition, flow rates, and column temperature on results were evaluated as a part of testing for methods robustness.
Validation of Method Developed
The proposed method was validated according to the ICH guidelines for system suitability, specificity, recovery, precision, linearity, robustness, limit of detection (LOD) and limit of quantification (LOQ). Under the validation study, various parameters were studied.
System suitability
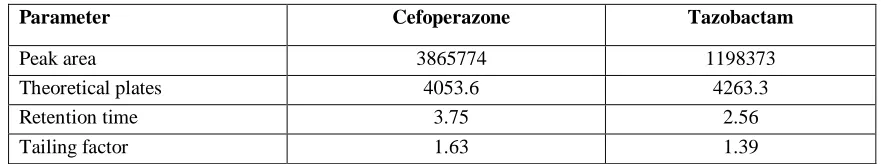
The Retention time of Cefoperazone and Tazobactam using optimum conditions was 3.75min and 2.56min respectively. For all of them, the peak symmetries were <1.5 and the theoretical plates numbers were >2000 and %RSD of areas of six standard injections of Cefoperazone and Tazobactam were less than 2. These values are within the acceptable range of United States pharmacopoeia definition and the c h r o m a t o g r a p h i c conditions. The results obtained are shown in Table 1.
Table 1: System suitability results of Cefoperazone and Tazobactam
Parameter Cefoperazone Tazobactam
Peak area 3865774 1198373
Theoretical plates 4053.6 4263.3
Retention time 3.75 2.56
Tailing factor 1.63 1.39
w w w . i a j p s . c o m
Page 2198 Fig 2: Optimized chromatogram of Cefoperazone and TazobactamSpecificity
The specificity of the method was evaluated by assessing interference from excipients in the pharmaceutical dosage form prepared as a placebo solution. Optimized Chromatogram of Cefoperazone and Tazobactam is shown in Fig. 2 clearly shows the ability of the method to assess the analyte in the presence of other excipients.
Linearity and Range
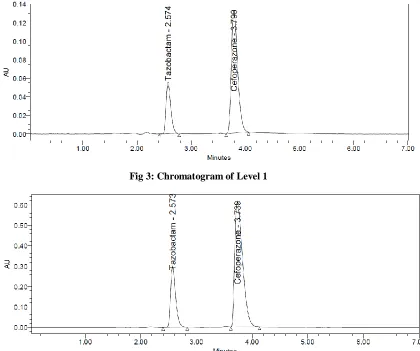
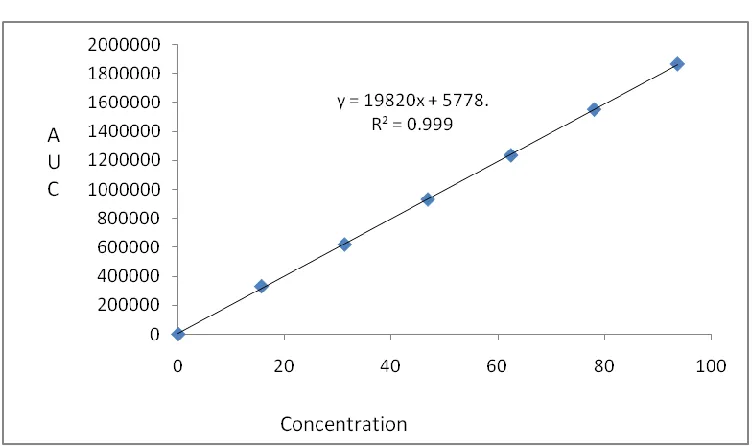
Linearity was assessed for all the four drugs at concentration ranges 125-750μg/ml for Cefoperazone, 16-94µg/ml for Tazobactam. The Chromatograms of level 1 and level 6 are shown in Fig.3 and Fig.4. A linear relationship was established at these ranges between Area under the peak (AUP) and concentration. Good linearity was proved by high values of coefficient of determinations (Fig.5 and Fig.6). The results were tabulated in Table 2.
Fig 3: Chromatogram of Level 1
w w w . i a j p s . c o m
Page 2199 Table 2: Linearity data of Cefoperazone and TazobactamLevel
Concentration of
Cefoperazone(µg/ml) Peak area Concentration of Tazobactam (µg/ml)
Peak area
1 125 1060186 16 331025
2 250 1987537 31 620140
3 375 2998962 47 931832
4 500 3985706 63 1237229
5 625 5013924 78 1554724
6 750 6007576 94 1868907
Fig 5: Calibration curve of Cefoperazone
w w w . i a j p s . c o m
Page 2200 Limit of Detection (LOD)/Limit of Quantitation(LOQ)
The LOD was determined on the basis of signal to noise ratios and was determined using analytical response of three times the background noise. LOQ was determined as the lowest amount of analyte that was reproducibly quantified above the baseline noise following triplicate injections. Both LOQ and LOD were calculated on the peak area using the following equations:
LOQ= 10 x N/ B LOD= 3 x N/ B
The limit of detection and limit of quantification were evaluated by serial dilutions of Mupirocin and Fluticasone stock solution in order to obtain signal to noise ratio of 3:1 for LOD and 10:1 for LOQ. The LOD value for Mupirocin and Fluticasone were found to be 0 . 3 8 µg / m l , 0 . 0 2 µg / m l respectively, and the LOQ values was found to be 1.16µg/ml, 0.05µg/ml respectively.
PRECISION System Precision
System Precision was carried to ensure analytical system is working properly. One dilution of all the drugs in six replicates was injected into HPLC system & was analyzed and the results were found within the acceptance limits (RSD<2) as shown in the Table 3 below.
Method Precision (Repeatability)
Precision is expressed as the closeness of agreement between a series of measurements obtaining from multiple sampling of the same homogeneous sample. Six replicate injections of a known concentration of sample preparation of Cefoperazone and Tazobactam have been analyzed by injecting them into a HPLC column on the same day and on consecutive days. From the results obtained, %RSD was calculated and was found to be within the limits (<2). The results of precision are given in Table 4.
Table 3: System Precision data for Cefoperazone and Tazobactam
Cefoperazone Tazobactam
S. No
Concentration (µg/ml)
Retention
time (min) Peak Area
Concentration (µg/ml)
Retention time (min)
Peak Area
1 500 3.748 3854599 62.5 2.568 1196328
2 500 3.751 3853396 62.5 2.570 1200116
3 500 3.753 3852694 62.5 2.570 1195306
4 500 3.754 3875937 62.5 2.570 1193960
5 500 3.767 3869519 62.5 2.572 1205261
6 500 3.768 3888501 62.5 2.575 1199266
Average 3865774 Average 1198373
SD 14717.4 SD 4107.2
%RSD 0.4 %RSD 0.3
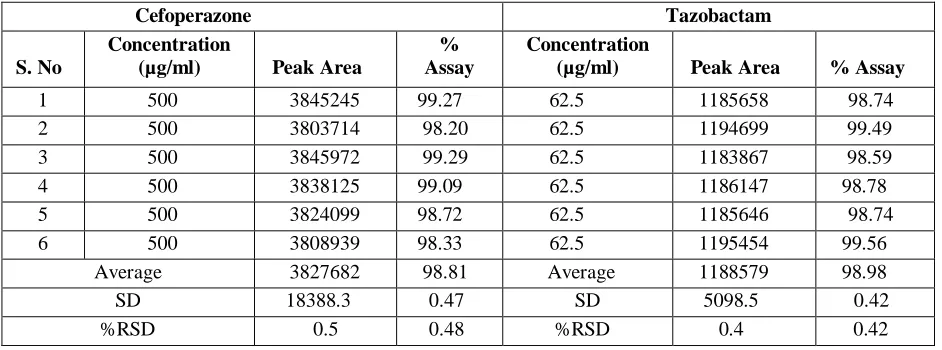
Table 4: Method Precision data for Cefoperazone and Tazobactam
Cefoperazone Tazobactam
S. No
Concentration
(µg/ml) Peak Area
% Assay
Concentration
(µg/ml) Peak Area % Assay
1 500 3845245 99.27 62.5 1185658 98.74
2 500 3803714 98.20 62.5 1194699 99.49
3 500 3845972 99.29 62.5 1183867 98.59
4 500 3838125 99.09 62.5 1186147 98.78
5 500 3824099 98.72 62.5 1185646 98.74
6 500 3808939 98.33 62.5 1195454 99.56
Average 3827682 98.81 Average 1188579 98.98
SD 18388.3 0.47 SD 5098.5 0.42
w w w . i a j p s . c o m
Page 2201 AccuracyThe percentage recovery was calculated by preparing standard drug concentrations of
Cefoperazone and Tazobactam with
concentration levels of 50%, 100% and 150%. A known amount of the standard drug was added to the blank sample at each level. Good recovery of the spiked drugs was obtained at each added concentration, and the
mean percentage recovery o f
C e f o p e r a z o n e a n d T a z o b a c t a m was 98.77% and 95.58%. The results are given in Tables 5 & 6 below.
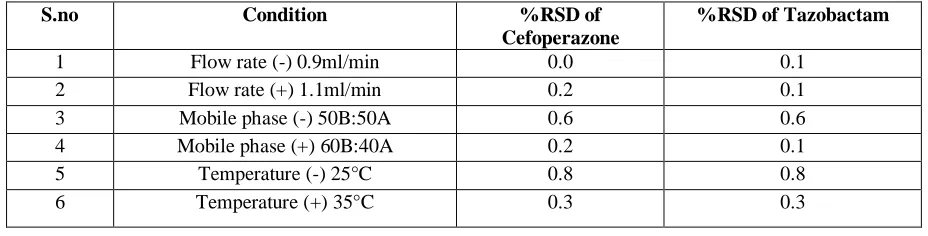
Robustness
Robustness of the proposed analytical method is a measure of its capacity to remain unaffected, and it reflects the reliability of the analysis with respect to deliberate changes in the parameters such as flow rate (1.0 ± 0.2 mL), column temperature (30 ± 5°C), and mobile phase ratio of the mobile phase. The result of robustness study of the developed assay method was established in Table 7. The result shown that during all variance conditions, assay value of the test preparation solution was not affected and it was in accordance with that of actual. System suitability parameters were also found satisfactory; hence the analytical method would be concluded as robust.
Table 5: Recovery data of Cefoperazone
Sample name
Amount added (µg/ml)
Amount found (µg/ml)
%
Recovery Statistical Analysis
S1:50%
250
246.111 98.44 Mean=98.55
S2:50% 250 245.745 98.30 S.D=0.33
S3:50% 250 247.327 98.93 %RSD=0.33
S4:100% 500 497.152 99.43 Mean=99.49
S5:100% 500 496.833 99.37 S. D=0.15
S6:100% 500 498.347 99.67 %RSD=0.15
S7:150% 750 737.312 98.31 Mean=98.27
S8:150% 750 737.999 98.40 S. D=0.14
S9 :150% 750 735.925 98.12 %RSD=0.14
Table 6: Recovery data of Tazobactam
Sample Name
Amount added (µg/ml)
Amount
found (µg/ml) %Recovery Statistical Analysis
S1:50% 31 30.407 98.09 Mean=98.75
S2:50% 31 30.680 98.97 S.D=0.58
S3:50% 31 30.749 99.19 %RSD=0.58
S4:100% 63 61.842 98.16 Mean=98.72
S5:100% 63 62.459 99.14 S.D=0.50
S6:100% 63 62.285 98.87 %RSD=0.51
S7:150% 94 92.271 98.16 Mean=98.26
S8:150% 94 92.522 98.43 S.D=0.14
S9 :150% 94 92.300 98.19 %RSD=0.15
Table 7: Robustness data for Cefoperazone and Tazobactam.
S.no Condition %RSD of
Cefoperazone
%RSD of Tazobactam
1 Flow rate (-) 0.9ml/min 0.0 0.1
2 Flow rate (+) 1.1ml/min 0.2 0.1
3 Mobile phase (-) 50B:50A 0.6 0.6
4 Mobile phase (+) 60B:40A 0.2 0.1
5 Temperature (-) 25°C 0.8 0.8
w w w . i a j p s . c o m
Page 2202 Forced degradation studiesThe assay method was used to test the drug stability by conducting forced degradation studies for the drug substances under various stress conditions. Stress degradation studies were carried out for acid hydrolysis (1M HCl heated for 30 min at 60°C), alkali hydrolysis (2 N NaOH heated for 30 min at 60°C),
oxidative degradation (20%H2O2 heated at 60°C for 30 min) and thermal degradation (samples placed in an oven at 105°C for 6 h). For photolytic stress studies, samples were exposed to UV light by keeping them in a UV chamber for 7 days. Results are shown in Tables 8 & 9.
Table 8: Degradation Data of Cefoperazone
S.NO Degradation Condition
% Drug Degraded Purity Angle Purity Threshold
1 Acid 4.55 0.086 0.282
2 Alkali 2.97 0.100 0.297
3 Oxidation 1.92 0.087 0.288
4 Thermal 0.74 0.084 0.292
5 UV 0.89 0.083 0.286
6 Water 0.71 0.089 0.287
Table 9: Degradation Data of Tazobactam
S.NO Degradation Condition
% Drug Degraded Purity Angle Purity Threshold
1 Acid 4.63 0.088 0.267
2 Alkali
2.50 0.127 0.290
3 Oxidation
1.95 0.093 0.274
4 Thermal
0.55 0.098 0.271
5 UV 0.82 0.112 0.272
Table 10: Comparison of developed method with earlier reported methods[6-8]
Validation Parameters
Method developed Reported Method 1 Reported Method 2 Reported Method 3
CEFO TAZO CEFO TAZO CEFO TAZO CEFO TAZO
Range 125-750 µg/ml
16-94 µg/ml
24-72 µg/ml
3-9 µg/ml
25-50 µg/ml
3.125-9.37 µg/ml
20-60 µg/ml
2.5-7.5 µg/ml Regression
Coefficient
0.999 0.999 0.999 0.999 0.998 0.999
Slope (m) 7979 19820 29.16 89.63 1574 1464
Intercept (c) 15373 5778 16.38 7.009 1449 1440 Regression
equation
Y=7979.x+ 15373
Y=19820.x+ 5778
Y=29.16.x- 16.38
Y=89.63.x- 7.009
Y=1574 .x+1449
y=1464 .x+1440 Assay 98.82% 98.98% 98.16% 98.04% 97.64% 97.13% Retention
time
3.75 2.56 3.3 5.1 3.24 4.83 3.86 7.57
System Precision (%RSD)
0.4 0.3 0.57 0.91 0.4 0.6
Method Precision (%RSD)
0.5 0.4 0.44 0.92 0.7 0.4
Accuracy 98.77% 95.58% 99.76% 99.64% 99.61% 99.01%
LOD 0.10 0.02 0.62 0.12 5.22 0.42
w w w . i a j p s . c o m
Page 2203 The retention time of Cefoperazone andTazobactam were found to be 3.75min and 2.56 min respectively. Linearity was established for C efop er az on e an d Taz oba ctam in the range of 125-750µg/ml for Cefoperazone, 16-94µg/ml for Tazobactam with correlation coefficients (r2=0.999) and the percentage recoveries were 9 8 . 7 7 % a n d 9 5 . 5 8 % for Cefoperazone and Tazobactam respectively, which indicate accuracy of the proposed method. The % RSD values of accuracy for D i p h e n h y d r a m i n e , P h e n y l e p h r i n e , P a r a c e t a m o l , a n d D i a z e p a m were found to be < 2%. The % RSD values of method precision are 0.97%, 0.49%, 0.64%, 0.60% for Diphenhydramine, Phenylephrine, Paracetamol, Diazepam respectively a n d % RSD values of system precision are 0.6% for Diphenhydramine, Paracetamol, Diazepam and 0.5% for
Phenylephrine. LOD values for
Diphenhydramine, Phenylephrine, Paracetamol and Diazepam were found to be 0 . 0 1 µg/ml, 0.12µg/ml, 0.22µg/ml and 0.01µg/ml respectively and LOQ values for Diphenhydramine, Phenylephrine, Paracetamol and Diazepam were found to be 0.04µg/ml, 0.37µg/ml, 0.66µg/ml and 0.03µg/ml respectively was shown. The % RSD values of robustness studies were found to be < 2% reveal that the method is robust enough was shown in (Table 7). These data show that the proposed method is specific and sensitive for the determination of Cefoperazone and Tazobactam.
Table no 10: Comparison of developed method with earlier reported methods [6-8].
CONCLUSIONS:
1.RP-HPLC method for the simultaneous e s t i m a t i on of Cefoperazone and Tazobactam in their combine dosage form was developed and validated as per the ICH guidelines.
2.Linearity was observed in the range of 125-750µg/ml for Cefoperazone,16-94µg/ml for Tazobactam with correlation coefficients (r2=0.999).
3.The percentage recoveries of Cefoperazone and
Tazobactam were 98.77% and 95.58% Which was within the acceptance criteria.
4.The percentage RSD was NMT 2% which proved the precision of the developed method.
5.The developed method is simple, sensitive, rapid, linear, precise, rugged, accurate, specific, and robust.
6.The developed method was found superior in certain respects such as RT, LOD and the method was more economical when compared to others. 7.Accuracy and precision, ruggedness and robustness were similar to earlier reported methods
ACKNOWLEDGEMENT
I express my sincere thanks to Dr. S.V.UM. Prasad, Programme Director for his support and encouragement throughout my project work. I am also thankful t o School of Pharmaceutical Sciences and Technologies f or providing t h e chemicals a n d instruments a n d Natco Pharma Pvt. Ltd., Hyderabad, India for providing the drug samples for Master Degree project.
REFERENCES:
1.www.wikipedia.com/cefoperazone/tazobactam 2.H.H. Willard, L.L. Merritt, J.A. Dean, F.A. Settle. Instrumental Methods of Analysis, 7th edition CBS publishers and Distributors, New Delhi. 1986, P.518-521, 580-610.
3.D.A. Skoog. J. Holler, T.A. Nieman. Principle of Instrumental Analysis, 5th edition, Saunders College Publishing, 1998; P.778-787.
4.Connors Ka. A Textbook of Pharmaceutical Analysis, Wiley intersciences Inc; Delhi, 3rdEd, Pg 373-421, (1994).
5.www.drugbank.com/cefoperazone/tazobactam 6.Jatin R Gohil, et al., RP-HPLC method development and validation for the simultaneous estimation of Cefoperazone Sodium and Tazobactam Sodium in parenteral preparation in inventi journals.
7.Narendra Kumar et al., RP-HPLC method development and validation for simultaneous estimation of Cefoperazone and Tazobactam in their combined dosage form in world journal of pharmacy and pharmaceutical sciences, 2014;3( 8): 1083-1093.
![Fig 1: Structure of (a) Cefoperazone (b) Tazobactam[5] Though several methods are reported in literature for](https://thumb-us.123doks.com/thumbv2/123dok_us/8791140.1766734/2.596.86.298.328.621/fig-structure-cefoperazone-b-tazobactam-methods-reported-literature.webp)
![Table 10: Comparison of developed method with earlier reported methods[6-8]](https://thumb-us.123doks.com/thumbv2/123dok_us/8791140.1766734/8.596.33.558.449.754/table-comparison-developed-method-earlier-reported-methods.webp)
