University of Belgrade, Faculty of Transport and Traffic Engineering, Serbia
Evaluation of Sustainable Mobility Measures
Using Fuzzy COPRAS Method
UDC:005.311.11 005.22
DOI:10.7595/management.fon.2016.0006
1. Introduction
Today, almost every city in the world is faced with growing transportation related problems. Therefore, the ongoing challenge is to find a way to improve urban mobility (the ability for movement of people and goods) and at the same time to reduce congestion and pollution. This brings the concept of sustainable urban mobility to the forefront. Sustainable mobility is defined as providing mobility, i.e., access to goods, services and locations with minimal negative effects (WBCSD, 2001).
Sustainable mobility is an important instrument of transport policy whose aim is to facilitate mobility and also to simultaneously reduce negative economic, environmental and social impacts of transport. A sustainable mobility concept includes a set of different strategies and measures which are reflecting on the usage of private cars, creating a favorable environment for public and non-motorized traffic in order to improve efficiency and sustainable development of transport systems.
A general classification of mobility management measures is based on the so-called “soft measures“ (e.g., campaigns) and “hard measures” - related to the physical improvements of infrastructure, but also increased costs of car use, for example congestion charging or control of road space (Gärling and Schuitema, 2007). Implementation of a single mobility management measure is unlikely to achieve sustainable mobility so a whole set of measures is needed (Basarić, 2015).
In order to promote and support sustainable mobility concept, the European Commission launched a number of initiatives with the aim to provide EU cities with specific sources of knowledge and experience (e.g. CIVITAS, EPOMM, KonSult, etc). The key topic in these initiatives/projects is the evaluation of sustainable mobility measures, i.e., quantification of their contribution to sustainability objectives. Particularly important
The process of decision making in a complex system such as transport is often conducted in the presence of
a large number of criteria that are often conflicting and whose values are expressed in different units. This
paper presents a multi-criteria decision making (MCDM) approach for evaluating sustainable mobility
meas-ures based on qualitative information. The usage of both types of criteria (or only qualitative) in the process
of evaluation of sustainable mobility measures is possible thanks to the fuzzy expansion of the multi-criteria
decision making methods. The proposed procedure for the evaluation of sustainable mobility measures
en-compasses selection of measures, criteria and ranking selected measures using the fuzzy COPRAS method.
The aim of the proposed method is ranking sustainable mobility measures on the basis of previous
experi-ences. The method enables cities that have not yet implemented these measures to gain an insight into what
to expect and establish priorities. The paper demonstrates the potentials and suitability of fuzzy COPRAS in
making decisions on mobility measures. Accordingly, twenty six measures are evaluated and the most
prom-ising ones have been obtained.
is the CIVITAS WIKI1- a framework for evaluating measures defined within the CIVITAS II initiative, as well as projects MAESTRO2 and CIVITAS MODERN3, which are focused on a detailed evaluation of already implemented measures in the so-called experimental cities. A comprehensive overview of measures and the quantification of their effects can be found in the JRC4study Quantifying the Effects of Sustainable Urban Mobility Plans5.
There is a number of studies dealing with the concept of sustainable urban mobility from different perspectives - devising conceptual frameworks (e.g., Marx et al., 2015; da Silva et al., 2008; Gakenheimer, 1999), determining sustainable mobility indicators and indexes (e.g., Shiau, 2012; Shiau et al., 2015; Awasthi and Chauhan, 2011), analyzing the influence of specific factors or policy instruments (e.g., Mrkajic and Anguelovski, 2016; Hysing, Frandberg and Vilhelmson, 2015; de Andrade et al, 2015) or conducting market segmentation survey (e.g., Hinkeldein et al., 2015).
There is a special line of research papers dealing with the evaluation of measures of sustainable urban mobility. Their principal aim is to depict measures with highest contribution in achieving sustainable urban mobility goals. One of the main challenges in these studies is to come up with appropriate analytical tool to deal with a variety of measures often in conflict by nature and expressed in accordance with both qualitative and quantitative criteria. One recent study was done by Curiel-Esparza et al. (2016) who integrated the Delphi technique with the Analytic Hierarchy Process (AHP) and the VIKOR method to select the optimal alternative in terms of sustainable mobility. They arrived with a conclusion that the best solution according to their hybrid model is the enhancement of the cycle network. Macário and Marques (2008) studied 200 urban mobility measures in 19 European cities and investigated the preconditions for transferability of these measures. Schmale, Schneidemesser and Dörrie (2015) relied on multi-criteria approach to evaluate the contribution of 75 measures clustered in six categories (public relations, motorized private transport, public transport, walking, biking, miscellaneous) and ended with establishing four groups of measures based on their priority.
However, the majority of these studies focus on quantitative reflection of urban mobility measures and thus neglect certain measures that must be evaluated qualitatively as public acceptance or decision maker preferences. Our study fills this gap by using fuzzy COPRAS (hereinafter: COPRAS-F) method which takes into account a great number of possible measures, involve multiple stakeholders, qualitatively data as well as a suitable weight of criteria depending on the strategy of the city.
The aim of the proposed method is ranking sustainable mobility measures through the evaluation of measures, good practices, results and methods included in the EU sustainable transport projects. There have been only a few attempts to apply COPRAS method in the field of transport (e.g., Zavadskas et al., 2007; Barysienë, 2012). A recent study by Barysienë (2012) uses the COPRAS-G method to evaluate technologies used in container terminals.
The paper is organized as follows. The following section is about COPRAS and COPRAS-F methods. Section tree contains the COPRAS-F based procedure for the evaluation of sustainable urban mobility measures. The proposed evaluation procedure is comprised of three basic steps: selection of measures; selection of evaluation criteria and ranking measures according to the COPRAS-F results. The empirical example is presented in Section 4. The paper ends with concluding remarks and future research directions.
2. Copras Method
Within the decision making theory there are numerous multi-criteria decision making methods that support solving various problems. Each MCDM method is characterised by specific mathematical tool, but basically the problem is formally presented by choosing one out of moptions alternatives, (Ai, i=1,2,...,m), which are estimated and mutually compared based on n criteria (Xj, j=1,2,…,n) whose values are known. The
1 http://www.civitas.eu/sites/default/files/civitas_wiki_d4_10_evaluation_framework.pdf 2 http://www.transport-research.info/web/projects
3 http://www.civitas.eu/sites/default/files/d12.3_-_modern_final_evaluation_report_revised.pdf 4 https://ec.europa.eu/jrc/
alternatives are presented by vectors xij, where xijis a value of ith alternative according to jthcriterion. Considering that the criteria influence alternatives’ final estimates to the different extent, a weighting coefficient wj, j=1,2,…, n(where∑nj=1wj = 1) is allocated to each criterion and reflects its relative importance in alternative evaluation.
One of the recent methods being increasingly used in the literature is the COPRAS (COmpressed PRoportional ASsessment) method developed in 1996 by Lithuanian authors (Zavadskas and Kaklauskas, 1996). The COPRAS method is to a certain extent characterised by a more complex procedure for criterion function value aggregation and a simplified procedure for data normalization (criterion character – min or max is not considered). This method is used by numerous authors (Kaklauskas, Zavadskas and Raslanas, 2005; Kaklauskas et al., 2006; Vilutiene and Zavadskas, 2002; Zavadskas, Kaklauskas and Kvederyte, 2001; Zavadskas, Kaklauskas, Banaitis and Kvederyte, 2004; Zavadskas, Kaklauskas, Turskis and Tamosaitiene, 2008) for solving various problems.
Unlike other multi-criteria decision making methods, this method is characterised by numerous advantages and Fouladgar et al. (2012) emphasize in their paper only those that are most important: (1) a possibility to rank numerous alternatives; (2) a shorter time for getting results (by software) than in AHP and ANP methods; (3) a simplified result presentation; (4) a possibility to interpret results graphically.
2.
1. Fuzzy COPRAS Method
Conventional multi-criteria decision making methods are applied when solving various problems in case where the data within them are known and numerically expressed (quantitative). The conventional COPRAS method is applied when specific data are available, while in case numerical data are not available, the fuzzy extensions of the COPRAS method are used (COPRAS-F). The COPRAS-F method can be applied when ranking of criteria and alternatives is being solved by linguistic expressions using fuzzy numbers (commonly triangular).
The steps in the COPRAS-F method application can vary depending on the way in which the weights are estimated, as well as on the defuzzification mode of fuzzy numbers, but basically the steps in this method application are the following (Fouladgar et al., 2012):
Step 1: The decision making process starts with step 1 which refers to the generation of feasible alternatives (m) and to the adoption of criteria for defined alternative (n) evaluation;
Step 2:The choice of linguistic estimates for evaluating criteria and alternatives – in case where criteria and alternative weights are considered to be linguistic variables. It is very common that the choice of linguistic estimates for criteria and alternatives is made by applying fuzzified Likert scale (Camparo, 2013) shown in Table 1:
Table 1:Linguistic terms for alternative evaluation
Step 3:Determining weight coefficient of the criteria (denoted bywj) by applying one of the multi-criteria decision making methods (most commonly by AHP, ANP, fuzzy AHP, fuzzy ANP method etc.).
Step 4:Computation of aggregated fuzzy decision making matrix based on initial decision making matrix (X). Aggregated values are shown in matrixD:
Linguistic value Fuzzy numbers
Very high (VH) (4.5,5,5)
High (H) (3.5,4,4.5)
Medium (M) (2.5,3,3.5)
Low (L) (1.5,2,2.5)
The elements of aggregated matrix ( ) are obtained using the equation (3):
where is a value/estimate of alternative Aiaccording to criterion Cj, given by kthexpert.
Step 4: Defuzzification of aggregated fuzzy decision making matrix, obtained in the previous step, and obtaining numerical values of the alternatives according to each criterion. Defuzzificated values are obtained using the equation (4):
Step 5:Obtaining normalized decision making matrix (denoted byfij). The aim of criteria value normalization is to transform different criterion values (benefitorcost) into the values allowing mutual comparison.
Step 6:Obtaining weighted normalized decision making matrix (denoted by ). The values of weighted decision making matrix are obtained by multiplying the elements of normalized decision making matrix by weighted coefficients (wj):
Step 7:Summing up the weighted valued of the matrix by columns. The values are summed up depending on the group to which the criteria belong (minormax). The values of maxcriteria (higher value of a criterion is preferred) are obtained by equation (6), while the values of mincriterion type (lower value of a criterion is preferred) are obtained by equation (7):
Step 8: Determining relative weights (importance) of each alternative. Using equation (8) the importance of each considered alternative from the set of the alternatives being compared is determined:
1 2
1 11 12 1
2 21 22 2
1 2
...
...
... ...
... ... ...
...
n n nm m m mn
C C
C
A x
x
x
A x
x
x
X
A x
x
x
ª
º
«
»
«
»
=
«
»
«
»
¬
¼
(1)
1 211 12 1 1
21 22 2 2 1 2
...
...
... ...
... ... ...
...
n n nm m m mn
C C
C
x
x
x
A
A x
x
x
D
A x
x
x
ª
º
«
»
«
»
=
«
»
«
»
«
»
¬
¼
(2)
)
,
,
(
~
3 21 ij ij
ij
ij
x
x
x
x
=
{ }
11
min
ijkij
x
x
=
,
¦
=
= K
k ijk
ij K x
x
1 2
2 1 xij3 =max
{ }
xijk3(3)
(
) (
)
[
]
ij ij ij ij ij ijLx
Lx
Mx
Lx
Ux
x
=
−
+
−
+
3
(4)
j ij ij
f
w
x
ˆ
=
*
(5)
¦
= = k j ij i x P 1 ˆ(6)
¦
+ = = m k j ij i x R 1ˆ
(7)
Step 9:Ranking of alternatives based on the value of a criterion function Niwhich is allocated to each of the considered alternatives. The higher the value of a criterion function is, the better the alternative is. Final values of criterion functions are obtained using the equation (9):
where Qmaxis the maximum relative importance value.
3. Evaluation Procedure
The evaluation procedure of sustainable mobility measures consists of the following phases: (1) Selection of measures to be evaluated; (2) Selection of evaluation criteria and; (3) Evaluation and ranking selected measures using the COPRAS-F method. These are further elaborated below.
3.1.
Selection of Measures
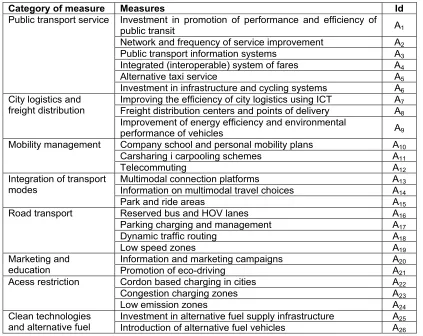
Based on extensive literature on the subject, 26 measures are chosen and classified into 8 categories (Table 2) (Lopez-Ruiz et al., 2013). The first category belongs to public transport services that are an important part of sustainable planning. The measures relate to the improvement of public transport supply mainly for public transit. Cycling and information system are also included. The second category consists of measures that improve city logistics and freight distribution which is one of the major problems accross large cities. A large number of activities within freight distribution leads to the issue of optimization of the associated activities. The major problems relate to low vehicle occupancy, empty rides, limited time delivery, as well as losses in time due to load manipulation operations.
Table 2: Sustainable mobility measures
%
100
*
max
Q
Q
N
ii
=
(9)
Category of measure Measures Id
Public transport service Investment in promotion of performance and efficiency of
public transit A1
Network and frequency of service improvement A2 Public transport information systems A3 Integrated (interoperable) system of fares A4
Alternative taxi service A5
Investment in infrastructure and cycling systems A6 City logistics and
freight distribution
Improving the efficiency of city logistics using ICT A7 Freight distribution centers and points of delivery A8 Improvement of energy efficiency and environmental
performance of vehicles A9
Mobility management Company school and personal mobility plans A10 Carsharing i carpooling schemes A11
Telecommuting A12
Integration of transport modes
Multimodal connection platforms A13 Information on multimodal travel choices A14
Park and ride areas A15
Road transport Reserved bus and HOV lanes A16 Parking charging and management A17
Dynamic traffic routing A18
Low speed zones A19
Marketing and education
Information and marketing campaigns A20
Promotion of eco-driving A21
Acess restriction Cordon based charging in cities A22
Congestion charging zones A23
Low emission zones A24
Clean technologies and alternative fuel
The third category of measures includes measures of mobility management, which are considered as a key element in the development of sustainable forms of transport in the implementation of transport activities. Mobility management measures focus on behaviour change of passengers in order to achieve sustainable practices in everyday transportation activities. Very often these measures are implemented in combination with other measures. The fourth category of measures relates to the integration of transport modes while the fifth category includes the promotion of road transport operations and regulations. The next group of measures includes measures targeted at behavioral change, followed by restriction measures and pricing mechanisms.
3.2.
Criteria Selection
The selection of relevant criteria has been performed on the basis of EU sustainable practices within sustainable transport projects as well as data existence (Lopez-Ruiz et al., 2013). The final five criteria are listed in Table 3. All criteria are aimed at maximizing value, which means the higher value of the criterion, the better sustainable mobility performance.
Table 3:Criteria for sustainable mobility measures evaluation
3.3.
The Evaluation and Ranking of Measures Based on COPRAS-F Method
As the values of selected measures against the following criteria may not be expressed quantitatively the phasy expansion of the chosen method is applied. Accordingly, the third step of the proposed approach involves the distribution of linguistic score for each of the measures/alternatives upon each criterion. For the evaluation of the measures, decision makers, i.e., experts use linguistic expressions that are translated into triangular fuzzy numbers. Thereafter the aggregation of scores for criteria and alternatives is performed.
4. Empirical Example
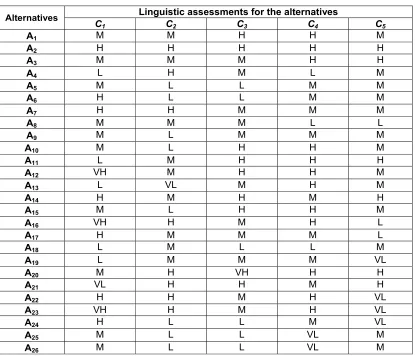
The selected alternatives (Table 2) and criteria (Table 3) are used as the procedure input. For simplicity reasons the criteria are equally weighted, while the evaluation of the measures has been carried out by a single expert. Table 4 presents the linguistic score for twenty-six measures (alternative) for sustainable mobility. The evaluation of alternatives according to the criteria was done on the basis of empirical knowledge of decision-makers, using a fuzzyficated Likert scale (Table 1).
After the formation of the initial decision making matrix (Table 4) the aggregation of its elements is carried out. The elements of the aggregate matrix (Equation 2) are obtained by applying the Equation (3). Subsequent defuzzification of the aggregated decision matrix has to be carried out (Equation 4), thereafter the normalization. By multiplying the elements of the normalized matrix with the criteria weights, the weighted normalized matrix is obtained (Equation 5). In the final step the aggregation of values is conducted for all alternatives (Equations 6-9) according to a set of criteria (minimum or maximum).
Criteria Id Target value
Potential reduce in CO2 (in kilotonnes) C1 max
Possibility/rationality of short term applications C2 max
Availability for users C3 max
Change in modal split-sustainable mobility C4 max
Table 4:Evaluation of sustainable mobility measures
Table 5 summarises the alternative values by criteria, the significance (impact) of each of the studied alternatives (Qi), the final criteria functions (Ni), and ranks of the alternatives. According to the final criteria functions alternative - measures for sustainable mobility are ranked.
Alternatives Linguistic assessmentsfor the alternatives
C1 C2 C3 C4 C5
A1 M M H H M
A2 H H H H H
A3 M M M H H
A4 L H M L M
A5 M L L M M
A6 H L L M M
A7 H H M M M
A8 M M M L L
A9 M L M M M
A10 M L H H M
A11 L M H H H
A12 VH M H H M
A13 L VL M H M
A14 H M H M H
A15 M L H H M
A16 VH H M H L
A17 H M M M L
A18 L M L L M
A19 L M M M VL
A20 M H VH H H
A21 VL H H M H
A22 H H M H VL
A23 VH H M H VL
A24 H L L M VL
A25 M L L VL M
Table 5:Results of COPRAS-F method
The first-ranked is an alternative which has a maximum value of criterion function, which in this case is the aternative A20: information and marketing campaigns. The second is the measure A16: reserved bus and HOV lanes, while the third is the measure A7: improving the efficiency of city logistics using information and communication technologies.
REFERENCES
[1] Awasthi, A., & Chauhan, S. S. (2011). Using AHP and Dempster–Shafer theory for evaluating sustainable transport solutions.Environmental Modelling & Software,26(6), 787-796, doi:10.1016/j.envsoft.2010.11.010 [2] Barysienë, J. (2012). A multi-criteria evaluation of container terminal technologies applying the COPRAS-G
method.Transport,27(4), 364-372, doi: 10.3846/16484142.2012.750624
Alternatives Pi Qi Ni Rank
A1 0,233 0,233264 85,68 6
A2 0,209 0,209088 76,80 10
A3 0,235 0,234943 86,30 5
A4 0,155 0,154981 56,93 21
A5 0,176 0,176493 64,83 16
A6 0,194 0,194235 71,35 12
A7 0,240 0,23979 88,08 3
A8 0,176 0,176284 64,75 17
A9 0,192 0,191661 70,40 13
A10 0,217 0,216658 79,58 8
A11 0,195 0,195307 71,74 11
A12 0,181 0,180985 66,48 15
A13 0,172 0,171845 63,12 18
A14 0,183 0,182952 67,20 14
A15 0,164 0,164379 60,38 19
A16 0,250 0,250166 91,89 2
A17 0,139 0,138793 50,98 25
A18 0,157 0,157097 57,70 20
A19 0,127 0,127345 46,78 26
A20 0,272 0,272246 100,00 1
A21 0,214 0,213528 78,43 9
A22 0,224 0,223501 82,10 7
A23 0,239 0,238718 87,68 4
A24 0,152 0,152172 55,75 22
A25 0,152 0,152172 55,75 23
A26 0,152 0,152172 55,75 23
In this paper we used the COPRAS-F method to evaluate and rank 26 sustainable mobility measures implemented in the EU countries/cities. Three measures were identified as the most beneficial – information and marketing campaigns; reserved bus and HOV lanes and improving the efficiency of city logistics with ICT solutions.
The advantage of the proposed approach lies in the ability to use descriptive – linguistic data to evaluate sustainable mobility measures which cannot be evaluated quantitatively. The proposed approach and obtained results can help decision makers to decide what sustainable mobility measures to implement, taking into account the nature and importance of defined criteria for evaluation.
Still, there are a number of different criteria that can be used in the evaluation process. One of the directions for future research can be the development of a proper model for selecting an adequate set of criteria.
[3] Basaric, V., Djoric, V., Jevdjenic, A., & Jovic, J. (2015). Efficient Methodology for Assessment of Targets and Policy Measures for Sustainable Mobility Systems.International Journal of Sustainable Transportation,9(3), 217-226, doi: 10.1080/15568318.2012.756088
[4] Camparo, J. (2013). A geometrical approach to the ordinal data of Likert scaling and attitude measurements: The density matrix in psychology. Journal of Mathematical Psychology, 57, 29–42,
[5] Curiel-Esparza, J., Mazario-Diez, J. L., Canto-Perello, J., & Martin-Utrillas, M. (2016). Prioritization by consensus of enhancements for sustainable mobility in urban areas.Environmental Science & Policy,55, 248-257, doi:10.1016/j.envsci.2015.10.015
[6] Da Silva, A. N. R., da Silva Costa, M., & Macedo, M. H. (2008). Multiple views of sustainable urban mobility: The case of Brazil.Transport Policy,15(6), 350-360,
[7] de Andrade, J. B. S. O., Ribeiro, J. M. P., Fernandez, F., Bailey, C., Barbosa, S. B., & da Silva Neiva, S. (2015). The adoption of strategies for sustainable cities: a comparative study between Newcastle and Florianópolis focused on urban mobility.Journal of Cleaner Production, doi:10.1016/j.jclepro.2015.07.135
[8] Fouladgar, M.M., Yazdani–Chamzini, A., Zavadskas, E.K., Haji Moini, H. (2012). A new hibrid model for evaluating the working strategies: case study of construction company. Tehnological and Economic Development of Economy, 18 (1), 164-188.
[9] Gakenheimer, R. (1999). Urban mobility in the developing world.Transportation Research Part A: Policy and Practice,33(7), 671-689,
[10] Gärling, T., & Schuitema, G. (2007). Travel demand management targeting reduced private car use: effectiveness, public acceptability and political feasibility.Journal of Social Issues,63(1), 139-153, doi: 10.1111/j.1540-4560.2007.00500.x
[11] Hinkeldein, D., Schoenduwe, R., Graff, A., & Hoffmann, C. (2015). Who Would Use Integrated Sustainable Mobility Services–And Why. Sustainable Urban Transport, 177-203, doi:10.1108/S2044-994120150000007019
[12] Hysing, E., Frändberg, L., & Vilhelmson, B. (2015). Compromising sustainable mobility? The case of the Gothenburg congestion tax.Journal of Environmental Planning and Management,58(6), 1058-1075, doi: 10.1080/09640568.2014.912615
[13] Kaklauskas, A., Zavadskas, E.K., Raslanas, S., Ginevicius, R., Komka, A., Malinauskas, P. (2006). Selection of low-e windows in retrofit of public buildings by applying multiple criteria method COPRAS: A Lithuanian case. Energy and Buildings, 38(5), 454–462,
[14] Kaklauskas, A., Zavadskas, E.K., Raslanas, S. (2005). Multivariant design and multiple criteria analysis of building refurbishments. Energy and Buildings, 37(4), 361–372,
[15] Lopez-Ruiz, H.G., Christidis, P., Demirel, H., Kompil, M. (2013). Quantifying the Effects of Sustainable Urban Mobility Plans, European Commission Joint Research Centre Institute for Prospective Technological Studies, Retrieved from:, doi:10.2791/21875
[16] Macário, R., & Marques, C. F. (2008). Transferability of sustainable urban mobility measures.Research in Transportation Economics,22(1), 146-156,
[17] Marx, R., de Mello, A. M., Zilbovicius, M., & de Lara, F. F. (2015). Spatial contexts and firm strategies: applying the multilevel perspective to sustainable urban mobility transitions in Brazil. Journal of Cleaner Production,108, 1092-1104, doi:10.1016/j.jclepro.2015.09.001
[18] Mrkajić, V., & Anguelovski, I. (2016). Planning for sustainable mobility in transition cities: Cycling losses and hopes of revival in Novi Sad, Serbia.Cities,52, 66-78, doi:10.1016/j.cities.2015.11.029
[19] Shiau, T. A. (2012). Evaluating sustainable transport strategies with incomplete information for Taipei City. Transportation research part D: transport and environment, 17(6), 427-432, doi: doi:10.1016/j.trd.2012.05.002
[20] Shiau, T. A., Huang, M. W., & Lin, W. Y. (2015). Developing an indicator system for measuring Taiwan’s transport sustainability. International Journal of Sustainable Transportation, 9(2), 81-92, doi: 10.1080/15568318.2012.738775
[21] Schmale, J., Von Schneidemesser, E., & Dörrie, A. (2015). An integrated assessment method for sustainable transport system planning in a middle sized German city. Sustainability, 7(2), 1329-1354, doi: 10.3390/su7021329
[22] Vilutiene, T., Zavadskas, E.K. (2003). The application of multi-criteria analysis to decision support for the facility management of a city’s residential district. Journal of Civil Engineering and Management, 10(4), 241–252. [23] WBCSD - World Business Council for Sustainable Development, 2001. Sustainable Mobility Project.
www.wbcsd.org
[25] Zavadskas, E.K., Kaklauskas, A., Kvederyte, N. (2001). Multivariant design and multiple criteria analysis of building life cycle. Informatica, 12(1), 169–188.
[26] Zavadskas, E.K, Kaklauskas, A., Banaitis, A, Kvederyte, N. (2004). Housing credit access model: the case for Lithuania. European Journal of Operational Research, 155(2), 335–352,
[27] Zavadskas, E. K., Kaklauskas, A., Peldschus, F., & Turskis, Z. (2007). Multi-attribute assessment of road design solutions by using the COPRAS method.Baltic Journal of Road and Bridge Engineering,2(4). [28] Zavadskas, E.K., Kaklauskas, A., Turskis, Z., Tamosaitiene, J. (2008). Selection of the effective dwelling house
walls applying attributes determined in intervals. Journal of Civil Engineering and Management, 14(2), 85–93.
ACKNOWLEDGEMENTS
This paper is part of the project “Critical infrastructure management for sustainable development in postal, communication and railway sector of the Republic of Serbia”, funded by the Ministry of Education and Science of the Republic of Serbia, Project number: TR36022.
Receieved: November 2015. Accepted: March 2016
Tanja Parezanović
University of Belgrade, Faculty of Transport and Traffic Engineering, Serbia
Tanja Parezanović is a research and teaching assistant and a PhD student at the Faculty of Transport and Traffic Engineering, the University of Belgrade, Serbia. She is the author or co-author of a number of scientific papers. Her research area is sustainable transportation systems and measures for achieving them.
Nataša Bojković
University of Belgrade, Faculty of Transport and Traffic Engineering, Serbia
Dr Nataša Bojković is an assistant professor at the Faculty of Transport and Traffic Engineering, the University of Belgrade, Serbia. She is the author or co-author of a number of papers in peer-reviewed international and national journals, including invited papers as well as conference proceedings. Her research area is decision making models in transport and communications, especially in the field of economics and policy.
Marijana Petrović
University of Belgrade, Faculty of Transport and Traffic Engineering, Serbia
Dr Marijana Petrović is an assistant professor at the Faculty of Transport and Traffic Engineering, the University of Belgrade, Serbia. She is the author or co-author of a number of scientific papers. Her research area is engineering management and policy in transport and communications, with special interest in policy modelling with the application of mathematical models and software solutions.
Snežana Pejčić Tarle
University of Belgrade, Faculty of Transport and Traffic Engineering, Serbia
Dr Snežana Pejčić Tarle is an associate professor at the Faculty of Transport and Traffic Engineering, the University of Belgrade, Serbia. She is the author or co-author of a number of scientific papers and books in the field of engineering management, policy analysis and sustainable development. She is especially interested in designing innovative tools and methods for policy monitoring and evaluation.