R E S E A R C H A R T I C L E
Open Access
Multidisciplinary insight into clonal
expansion of HTLV-1
–
infected cells in adult
T-cell leukemia via modeling by
deterministic finite automata coupled with
high-throughput sequencing
Amir Farmanbar
1,2†, Sanaz Firouzi
1*†, Sung-Joon Park
2, Kenta Nakai
1,2, Kaoru Uchimaru
1,3and Toshiki Watanabe
1,4*Abstract
Background:Clonal expansion of leukemic cells leads to onset of adult T-cell leukemia (ATL), an aggressive lymphoid malignancy with a very poor prognosis. Infection with human T-cell leukemia virus type-1 (HTLV-1) is the direct cause of ATL onset, and integration of HTLV-1 into the human genome is essential for clonal expansion of leukemic cells. Therefore, monitoring clonal expansion of HTLV-1–infected cells via isolation of integration sites assists in analyzing infected individuals from early infection to the final stage of ATL development. However, because of the complex nature of clonal expansion, the underlying mechanisms have yet to be clarified. Combining computational/mathematical modeling with experimental and clinical data of integration site–based clonality analysis derived from next generation sequencing technologies provides an appropriate strategy to achieve a better understanding of ATL development.
Methods:As a comprehensively interdisciplinary project, this study combined three main aspects: wet laboratory experiments, in silico analysis and empirical modeling.
Results:We analyzed clinical samples from HTLV-1–infected individuals with a broad range of proviral loads using a high-throughput methodology that enables isolation of HTLV-1 integration sites and accurate measurement of the size of infected clones. We categorized clones into four size groups,“very small”,“small”,“big”, and“very big”, based on the patterns of clonal growth and observed clone sizes. We propose an empirical formal model based on deterministic finite state automata (DFA) analysis of real clinical samples to illustrate patterns of clonal expansion. Conclusions:Through the developed model, we have translated biological data of clonal expansion into the formal language of mathematics and represented the observed clonality data with DFA. Our data suggest that combining experimental data (absolute size of clones) with DFA can describe the clonality status of patients. This kind of modeling provides a basic understanding as well as a unique perspective for clarifying the mechanisms of clonal expansion in ATL.
Keywords:Mathematical computational modeling, Deterministic finite state automata (DFA), State-transition diagram, Adult T-cell leukemia, Human T-cell leukemia virus ype-1, Integration site, Clonal expansion, Next-generation sequencing
* Correspondence:[email protected];[email protected]
†Equal contributors
1Department of Computational Biology and Medical Sciences, Graduate
School of Frontier Sciences, The University of Tokyo, Tokyo, Japan Full list of author information is available at the end of the article
Background
Cancer is a complex disease of the genome that behaves as a clonal evolutionary process in populations of cells [1–4]. Although cancer is a diverse and multifactorial disorder with differing origins and degrees of malignancy, clonal ex-pansion and the presence of Darwinian or natural selection are generally accepted as common features [4, 5]. Since No-well first proposed the clonal evolution theory of neoplasia in 1976 [1], a broad range of studies have provided support for this model. In recent years, the use of next-generation sequencing (NGS) technologies for the investigation of tumor genomes has generated increasing evidence that most neoplasms grow as a clonally expanded cell popula-tion [3, 6–8]. The vast amounts of invaluable data gener-ated by NGS have surpassed analysis and interpretation capacity. However, the intricate nature of clonal expansion and evolution in cancer makes it difficult to convert the ex-perimental and clinical data into medical practices [9, 10]. Experimental data alone are not generally sufficient enough to address the complex problem of cancer. Consequently, focus has shifted toward devising mathematical/computa-tional models for simplification and extraction of fundamental meaning from the complex biological processes of cancer.
Adult T-cell leukemia (ATL) is a life-threatening malig-nancy that manifests with very poor prognosis [11, 12]. ATL develops through a multistep leukemogenic process, the nature of which remains elusive [13]. Among the differ-ent types of cancer, ATL is a remarkably unique neoplasm in that it is directly caused by infection with human T-cell leukemia virus type-1 (HTLV-1), which is mainly transmit-ted via breastfeeding [14]. HTLV-1 infection and integra-tion of provirus into the host genome are intrinsic and inevitable early events for ATL development [15]. HTLV-1 mainly survivesin vivoby persistent clonal proliferation of infected cells [16]. Whereas the majority of HTLV-1– in-fected individuals remain asymptomatic carriers (ACs) throughout their lifetime, ~5% of them develop ATL after a long period of clinical latency [17]. Currently, there is no clear determinant to distinguish between individuals who will remain ACs and those who will develop ATL [18, 19]. Our Joint Study on Predisposing Factors of ATL Develop-ment (JSPFAD) group examined ATL risk factors and dem-onstrated that a proviral load (PVL; i.e., the percentage of infected peripheral blood mononuclear cells) of >4% is one of the risk factors for progression to ATL; however, PVL alone cannot predict development of the disease [19]. Simi-lar to other types of cancer, clonal expansion of abnormal cells is a hallmark of ATL [20, 21]. Considering that the incidence of large clones increases with disease progression from the healthy AC state to the malignant states of smol-dering (SM), chronic, or acute ATL [22–24], monitoring clonal expansion via an accurate method of detection is of great clinical importance [8, 23].
Generally, mutation patterns of cells can be used to define clones and monitor clonal expansion in different types of cancer [7]. ATL development has an advantage in that not only the mutation pattern but also the inte-gration site of the provirus can be used to define clones and monitor clonal expansion [8, 23]. Individual infected cells can be uniquely characterized based on their inte-gration site because, typically, a single inteinte-gration of HTLV-1 occurs per host cell [25]. Detecting the clonality dynamics, including clonal status and alterations, requires an appropriate method for defining two main characteristics of clones, HTLV-1 integration site and clone size.
Research in this area would be greatly benefitted by an easier to understanding representation and description of how cancer develops in terms of clonal expansion, which is expected to be provided by appropriate models. A realistic model would provide a better understanding of cancer and would provide a comprehensive perspec-tive on cancer processes by integrating clinical and bio-logical data within a mathematical and computer science framework. As with other malignancies, suitable models for ATL would help to simplify the dynamics of cooperative and complex behaviors in cancer develop-ment [26, 27]. Quantitative NGS data have the potential for creating robust and reliable mathematical modeling approaches [28]. Increasingly complex mathematical models of cancerous growth (particularly of solid tu-mors) that are based primarily on mutation patterns have been developed [29, 30]. The prominent role of mathematical modeling in the detailed quantitative de-scription of diseases, and the contribution of mathemat-ical modeling to solving biologmathemat-ical problems have been eloquently discussed by Tanaka and Ono [31]. Currently, there is a broad range of theoretical models available; however, empirical mathematical models are still limited [30].
Several mathematical modeling studies are available in the field of HTLV-1 research [32–38], although none of these studies have focused on modeling clonal expansion and its correlation with ATL development. The earliest mathematical model for HTLV-1 explored the correl-ation between the antiviral immune response, viral load and viral diversity [32]. Later Stilianakis et al. used a nonlinear differential equation and theoretical assump-tions to describe HTLV-1 infection of CD4+
confirmation bias [31]. Moreover, there is currently no computational model available for ATL development. A model that not only reflects details of biological phenomena like mathematical models but also allows abstract visualization of the observed information like computational models would be most informative to bi-ologists [39]. Establishing suitable expressive formalisms requires filling the gap between mathematics and com-puter science by using advantages of both approaches.
In this study, we used deterministic finite state autom-ata (DFA), which are a concept in automautom-ata theory [40]. Automata are the main mathematical objects in com-puter science that are capable of applying sequential algorithms, formalism, to system description and specifi-cation [41, 42]. DFA can abstractly display evolutionary processes and other phenomena with a sequential order of events [40, 43]. DFA represent a framework to de-scribe the behavior of clonal expansion as discrete-state systems. Our main goal was to illustrate clonality pat-terns and to design a conceptually clear framework based on real biological data on clonality obtained from individuals with different PVLs and progression states of ATL. We also categorized the observed clone sizes ac-curately based on our integration site–mediated clonality analysis approach. Moreover, we propose the first well-suited empirical model for intuitive description of clonal expansion in ATL.
Methods
Wet laboratory experiments
HTLV-1–infected individuals harbor complex popula-tions of infected clones and uninfected cells [8, 23]. HTLV-1 integration sites and the number of infected cells in each clone (i.e., clone size) are two main charac-teristics of infected clones that we monitored. Each HTLV-1–infected cell naturally harbors only a single in-tegration site [25]. Therefore, the number of detected unique integration sites reflects the number of infected clones. The most challenging aspect of our clonality ana-lysis was measuring the number of infected cells in each clone. We used a molecular tagging system for this pur-pose. Tags acts as molecular barcodes which give DNA fragment unique signatures before PCR [8]. Information on the frequency of observed tags from the NGS data was used to remove PCR duplicates and thereby esti-mate the original clonal abundance in the starting sam-ple. Because of the random design of tags, they could theoretically provide ~65,536 variations, and thus can uniquely mark a large number of cells in each clone. This method has been comprehensively validated using control samples with known clone sizes and clinical samples [8].
In total, eighteen clinical samples were obtained from the JSPFAD biomaterials bank of HTLV-1 carriers [44, 45].
Samples Information is provided in Table 1. The clinical samples were collected with written informed consent as a collaborative project of JSPFAD. The project was approved by research ethics committee of the University of Tokyo. Information about the disease status of samples was obtained from the JSPFAD database in which HTLV-1– in-fected individuals were diagnosed based on the Shimoyama criteria [46].
To prepare the samples for sequencing, 5μg genomic DNA from peripheral blood mononuclear cells was isolated using a QIAGEN DNA Blood kit. PVLs were measured by real-time PCR using the ABI PRISM 7000 Sequence Detection System as described [19].
We used a library preparation protocol specifically designed to isolate HTLV-1 integration sites. All infor-mation about the design and detailed protocols has been described [8]. In brief, the starting template DNA was fragmented by sonication. The resulting fragments rep-resented a size range of 300 to 700 bp as indicated by an Agilent 2100 Bioanalyzer and DNA 7500 kit. Fragmented DNA underwent the library construction steps of end repair, A-tailing, adaptor ligation, size selection and nested PCR. The generated products contained all the specific sequences necessary for the Illumina HiSeq 2000/2500 platform (Additional file 1: Figure S1).
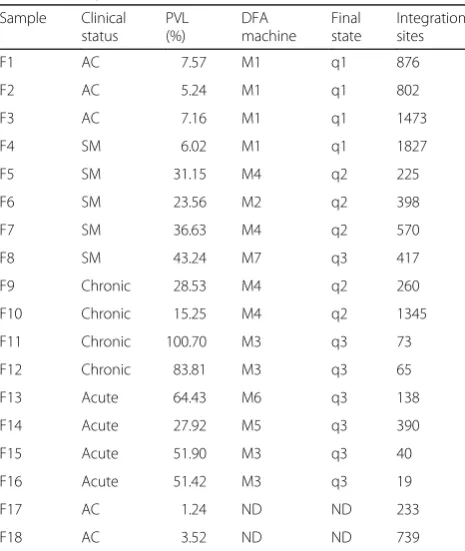
Table 1Sample characteristics
Sample Clinical status
PVL (%)
DFA machine
Final state
Integration sites
F1 AC 7.57 M1 q1 876
F2 AC 5.24 M1 q1 802
F3 AC 7.16 M1 q1 1473
F4 SM 6.02 M1 q1 1827
F5 SM 31.15 M4 q2 225
F6 SM 23.56 M2 q2 398
F7 SM 36.63 M4 q2 570
F8 SM 43.24 M7 q3 417
F9 Chronic 28.53 M4 q2 260
F10 Chronic 15.25 M4 q2 1345
F11 Chronic 100.70 M3 q3 73
F12 Chronic 83.81 M3 q3 65
F13 Acute 64.43 M6 q3 138
F14 Acute 27.92 M5 q3 390
F15 Acute 51.90 M3 q3 40
F16 Acute 51.42 M3 q3 19
F17 AC 1.24 ND ND 233
F18 AC 3.52 ND ND 739
In silicoanalysis
We analyzed the large amount of NGS data with a pipe-line specifically designed for HTLV-1 integration sites and clone size measurement. We processed raw sequen-cing data according to the workflow that we previously reported [8]. Briefly, raw data of Read-1 (100 bp for-ward), Read-3 (100 bp reverse), and Read-2 (8 bp index) were obtained from the Illumina HiSeq 2000/2500 plat-form. The quality of sequencing outputs was confirmed with the FastQC tool [47]. In the case of Read-1, the first 5 bp were trimmed, and the next 5 bp were used to de-multiplex indexed samples. The following 23 bp, which correspond to the long terminal repeat primer, were then removed. The next 27 bp were subjected to a BLAST search [48] against the long terminal repeat reference sequence. For the BLAST output reads, the remaining 40 bp were subjected to a BLAST search against an HTLV-1 reference sequence [49]. Reads con-firmed to be from HTLV-1 were removed, and the sequences and IDs for the remaining reads, which were considered to be human, were collected. Subsequently, reads from Read-3 with IDs corresponding to IDs from Read-1 were collected. The first 40 bp of Read-3 were trimmed to have the same length as Read-1 sequences. The paired sequences of Read-1 and Read-3 were mapped against the human genome (version 19) by Bowtie [50]. For each sample, two million mapped reads were used for subsequent analysis. The 5′-mapped posi-tions were considered to be integration sites. The output format of isolated integration sites is chromosome:posi-tion (strand) (e.g., chr7:9408533 (−)). Subsequently, Read-2 information, which contained 8-bp randomly de-signed barcodes, was used to retrieve the clone size
based on the tags. Finally, clone size was measured by computing the frequency of unique tags per each inte-gration site.
Expressing results via empirical modeling
Formal definition can precisely describe automata by alphabet and formation rules in mathematics. Parame-ters of DFA, such as the number of accept states and the number of transitions exiting from a state, can be clearly defined by the formal definition. In mathematical lan-guage, a DFA is a 5-tuple where the components are (Q, Σ,δ, q0, F).“Q”is a finite set of states.Σis a non-empty finite set of symbols (inputs). Transition rules are denoted by a function called the transition function, δ: States × Alphabet→States (δ: Q ×Σ→Q).“q0”is a start state, where q0 ∈Q. “F” indicates final states that are a subset of states Q [40, 42, 51].
Results
Analyzing clonality of clinical samples by high-throughput sequencing
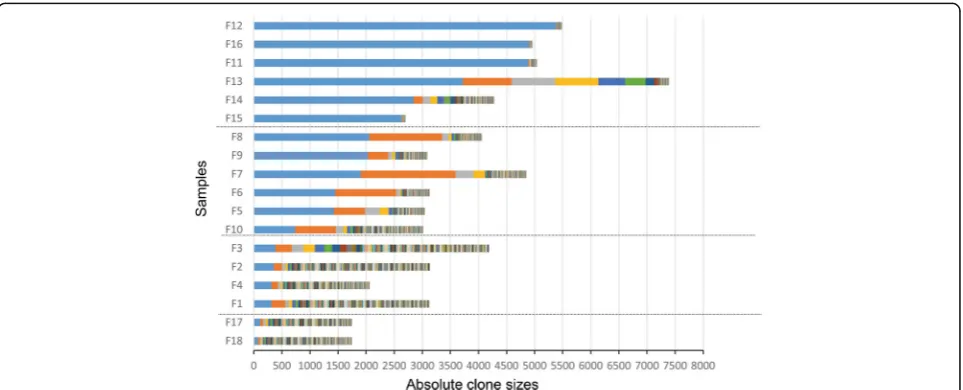
Having access to the biomaterials bank of JSPFAD [44, 45], we obtained 18 samples from HTLV-1–infected in-dividuals with PVLs ranging from 1.24 to 100.7%. Detailed information on these samples is presented in Table 1. The results of our clonality analysis are pre-sented in Fig. 1, and detailed information on the integra-tion sites and clone sizes are provided in Addiintegra-tional File 1: Table S1. Samples F18, F17, F1, F2, F3 and F4 showed a uniform distribution pattern of clones with no large difference in clone size (polyclonal pattern). The size of the largest clone in each of these samples was 77, 112, 310, 357, 388 and 314 cells, respectively, and the PVLs
were 3.52, 1.24, 7.57, 5.24, 7.16 and 6.02%, respectively (Fig. 1). F18 and F17 had PVLs lower than 4% and very small clone sizes. Samples F5, F6, F7, F8, F9 and F10 had non-uniform sizes (oligoclonal pattern). The size of the largest clone in each of these samples was 1427, 1446, 1904, 2055, 2029 and 736 cells, respectively; the size of the second-largest clone was 552, 1088, 1690, 1293, 361 and 725 cells; and the PVLs were 31.15, 23.56, 36.63, 43.24, 28.53 and 15.25% (Fig. 1, Table 1 and 2). Samples F11, F12, F13, F14, F15 and F16 harbored a dominant expanded clone (monoclonal pattern) with a high abso-lute number of infected cells. The largest clone size for each of these samples was 4883, 5377, 3721, 2848, 2634 and 4909 cells, respectively, and the PVLs were 100.7, 83.81, 64.43, 27.92, 51.9 and 51.42%, respectively (Fig. 1, Table 1 and 2). The PVL for each sample is also shown in the same order in Additional file 1: Figure S2. The PVLs of the samples and the sizes of the largest clone had a correlation of R2= 0.785.
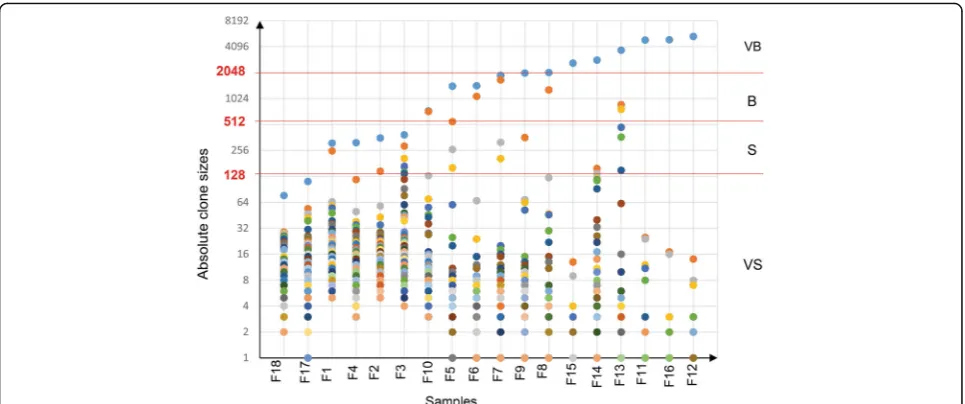
Defining appropriate thresholds for the absolute clone size
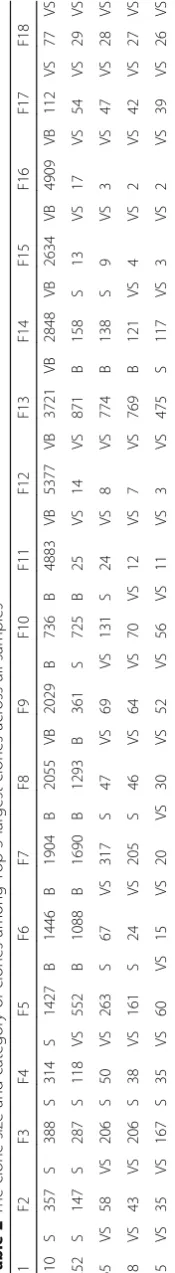
Each clone contains infected cells with identical integra-tion sites. Based on the distribuintegra-tion of clone sizes (abso-lute number of infected cells in each clone) determined for the AC and ATL samples, we defined three thresh-olds for categorizing the clones (Fig. 2). In the simplest assessment, a cell with replication capacity N is theoret-ically capable of generating a colony of 2Ncells [21]. The clone sizes were densely distributed in the lower end of the size range and sparsely distributed in the upper end of the size range. To illustrate the pattern of clone size distribution, we show the distribution of the top five lar-gest clones in Additional file 1: Figure S3. Based on the density distribution, we tested different thresholds and selected the thresholds (27, 29, and 211) that best catego-rized clones. Using these three thresholds, we divided the observed clones into four distinct size groups: very small (VS, 1–128 infected cells), small (S, 128–512 in-fected cells), big (B, 512–2048 infected cells) and very big (VB, >2048 infected cells). The size and category of the top five clones across all samples are provided in Table 2.
Taking advantage of automata theory to describe clonality data
The DFA in this study can present the observed clones in an ordered string based on their sizes, which is then accepted as input and then provide a graphical output that describes the clonality dynamics. In DFA, states and transitions can be graphically represented by circles and arrows, respectively. We defined the four states q0, q1, q2 and q3 for the machines. To start the analysis, the NGS-derived, quantified clone-size data were sorted in
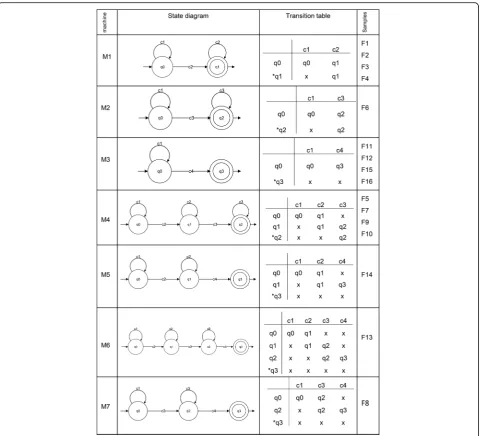
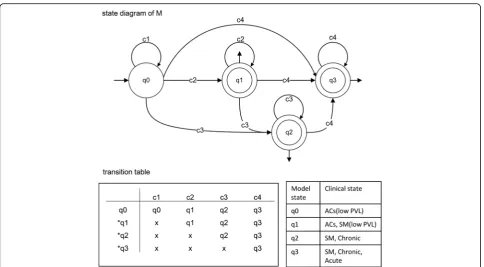
ascending order. Then, based on the threshold criteria that we described above, the sorted data were allocated to the VS, S, B and VB groups (Table 2), which were rep-resented by the symbols c1, c2, c3 and c4, respectively. Our DFA read the clone size data as a finite string of symbols as an input. The set of all inputs is denoted by Σ* and can be any combination of c1, c2, c3, and c4. As an automaton sees an input, it decides whether to transi-tion from one of a sequence of states (in our case denoted q0, q1, q2, q3, where qi ∈ Q, 0≤i≤3) to an-other. The transition function δ takes the current state and the recent symbol as its inputs. Fig. 3 illustrates the DFA machines for clonality data obtained from HTLV-1–infected individuals. According to the clonality data obtained from the clinical samples (Fig. 1 and Table 2), we designed seven DFA machines (M1–M7). To de-scribe them informally, these machines are composed of different combinations of VS, S, B, and VB: [M1: VS, S], [M2: VS, B], [M3: VS, VB], [M4: VS, S, B], [M5: VS, S, VB], [M6: VS, S, B, VB], and [M7: VS, B, VB]. We repre-sented these machines by state diagrams and transition tables in Fig. 3. The clonality patterns of F1, F2, F3 and F4 are modeled by M1; the pattern of F6 is modeled by M2; the patterns of F11, F12 and F15 are modeled by M3; the patterns of F5, F7, F9 and F10 are modeled by M4; the pattern of F14 is modeled by M5; the pattern of F13 is modeled by M6; and the pattern of F8 is modeled M7 (Fig. 3). Finally, to achieve a model describing all clonality data, we combined these seven machines and proposed our main machine (M) (Fig. 4). State q1 means that the clonality pattern is polyclonal, and the patient status is either AC or SM with low PVL. In other words, q1 accepts any combination of c1 and c2 clone sizes. State q2 means that the clonality pattern is oligoclonal, and the patient status is either SM or chronic, indicating that q2 accepts any combination of c1, c2 and c3 clone sizes. State q3 means that the clonality pattern is mono-clonal or largely expanded oligomono-clonal, and the patient status is either SM, chronic or acute. In other words, q3 accepts any combination of c1, c2, c3 and c4. Our final DFA (M; Fig. 4) completely represents clonal expansion based on integration sites across all samples. DFA of AC and SM samples with low PVLs (F1, F2, F3 and F4) ter-minated in the final state of q1. DFA of SM and chronic samples (F6, F5, F7, F9 and F10) terminated in the final state of q2. DFA of SM, chronic and acute samples (F8, F11, F12, F13, F14, F15 and F16) terminated at q3.
Discussion
of NGS technologies. However, this explosion in rapidly generated, massive sets of loosely structured raw data has challenged our abilities to quantitatively analyze and draw knowledge from this information [52]. Formal modeling can address this problem by enabling appro-priate simplification of real data and making sense of observed experimental data. Empirical modeling pro-vides an accurate and complete picture of observed complex data, and it has many applications in the life science [53]. The merging of mathematics, computer sci-ence and biology in empirical models can reshape these fields by providing new ways of thinking about a prob-lem. The virtue of mathematics in modeling is to confer clarity and precision to explanations, and to provide coherence and formalism to experimental observations [54]. The quantitative and objective power of mathemat-ics allows understanding of otherwise hidden aspects of biological phenomena [28]. Computational models en-able intuitive representation of the masses of biological data via their visualization capability, which in turn facil-itates mechanistic understanding of disease [55].
The most effective and appropriate type of mathemat-ical/computational modeling varies for each biological question. A practical model that is properly formulated to explain and interpret experimental and clinical data obtained from analyzing clonal expansion in ATL is greatly needed. We need a model that can imitate the components of our biological system (the clonality patterns and clone sizes) and reflect its properties intuitively.
In the current study, we aimed to organize and intui-tively express data from NGS on clonal expansion of HTLV-1–infected individuals using finite automata
theory. Finite automata theory can describe and analyze dynamic behaviors of systems, and it is capable of simply representing complicated processes [43, 52]. Finite au-tomata theory, which is a well-developed formal system, is used in processing various strings and sequences, especially in DNA sequence processing [51]. DFA are a subtype of finite automata theory and are simple compu-tational structures that can formally illustrate the size order and combination of observed clones (clonality patterns). Our model translates the observed data into formal mathematical language by formulating a precise relationship between a set of clones in terms of their sizes and presenting this relationship in an easily under-stood state diagram.
assess their contribution to ATL progression. In other words, we quantified how large a clone must be to affect the clinical status of an infected individual.
Generally, it is known that competition between clones shapes their distribution [3], but we do not know how a clone wins this competition to undergo clonal expan-sion. Presumably, a clone needs to become large enough to gain a fitness advantage to out-compete other clones. Coexistence of large numbers of S and VS clones, as well as presence of limited numbers of B or VB clones to-gether with large numbers of S or VS clones in each given sample was observed. Total number and type of isolated clones are provided in Table 1, and Table 2. Therefore, we suggest that small cell populations (VS
patterns with PVLs > 4% were categorized in the same group. Below the threshold of 27cells, the clones in the samples that had polyclonal patterns with PVLs < 4% were categorized in the same group. This quantified categorization of clone size not only is more intuitive for biological interpretation but also facilitates the transferal of clone size information into our model.
To convert the complex nature of data on clonal ex-pansion into a manageable level of simplicity, borrowed the aid of mathematics and computer science. Our pro-posed DFA describe the clonality status of infected indi-viduals as the output of final states q1, q2 and q3. Transitions are described by the functionδ, which speci-fies exactly one next state for each possible combination of state and input symbol. The rows in the transition table indicate the states Q, the columns the input sym-bols, and the table entries the transition functionδ. We indicated the accepting state with an asterisk in the figures. F = q1, q2, q3 indicates the final states, which consist of a set of states Q.
The final state of q1 represents an early stage of clonal expansion in which clone sizes does not exceed the threshold of 512 infected cells. AC patients with PVL > 4% and the SM ATL patients with low PVL terminated in this state. The DFA of samples of clinically progressed patients with SM and chronic subtypes with maximum clone sizes of 2048 infected cells terminated at the final state of q2. The final state of q3 included samples of the
SM, chronic and acute subtypes with clone size > 2048. Acute samples, which represent the final stage of ATL progression, were observed only in q3. VB clones were observed only in the samples whose DFA terminated at q3. In the current study, c4 (VB clone) was observed only once in each analyzed sample. Since, presence of more than one VB clone is theoretically possible, we put a loop on the q3 final state of our final DFA machine. In the case of observing such a sample, the clonality will be defined as a largely expanded oligoclonal pattern with q3 final state.
second time point were presumably decreased because of therapy. However, the major clone with integration site of Chr9:123682855 (+) remained stable and domin-ant over the 2-year period. The DFA for both time points terminated in q3. Thus, it appears that reaching the final state of q3 is a factor that can be used as a risk indicator. Because the final state of this patient was already q3 at the first time point, progression to the acute stage was predicted by our DFA. As further valid-ation of our DFA, the other patients with acute ATL also had DFA that terminated at q3, and thus we expected these patients to have a poor prognosis. Subsequently, we confirmed the poor prognosis of these patients (F13, F14, F15 and F16) by checking their clinical follow-up data, which showed that they had all died of the disease. However, AC patients (F1, F2 and F3) and patients with SM ATL with low PVL (F4) who showed the final state of q1 in the DFA remained clinically stable without dis-ease progression in two years.
The data suggest that our final proposed machine (M) not only describes the clonality status of patients at sin-gle time points within a cross-sectional analysis but also opens the door for future analyses of longitudinal sam-ples for predictive purposes. The predictive ability of this model with larger numbers of samples from the same in-dividuals over time still needs to be examined.
We believe our model is an appropriate empirical model for this system because it uses real biological data without theoretical assumptions as well as the fewest number of variables and the simplest set of relationships to explain the clonality status of samples. This model has the potential to provide insight into clonal expansion of ATL, but we are still far from understanding exactly when, where and at which step clonal expansion and transformation occur and how they can be controlled. However, our multidisciplinary strategy for translating the data of clonal expansion into the computable lan-guage of mathematics via modeling opens new avenues to approach these relevant questions in future studies.
Currently, ATL patients are categorized into different subtypes of disease progression based on clinical mani-festations [46]. These standard clinical criteria for diagnosis mainly include organ involvement, leukemic manifestation, and levels of lactate dehydrogenase and calcium [58]. However, molecular features that represent the disease status remain to be characterized. Consider-ing that in clinical practice distinct therapeutic strategies are used for the treatment of different subtypes of ATL, accurate subtype classification is of great importance. Thus, there is demand for more robust classification of ATL subtypes mediated by a genomic feature, such as HTLV-1 clonal composition. This kind of analysis would be also helpful in clinical decision-making, such as mon-itoring the outcome of therapeutic interventions, based
on analysis of the clonality status of patients before and after therapy [59]. In this respect, constructing an empir-ical model of clonal expansion would be one of the pri-mary steps towards developing a powerful software tool for automated analysis and interpretation of individual clonality, which holds great promise for molecular diagnostics and personalized therapeutic interventions.
Conclusions
We used HTLV-1 integration sites as a stable fingerprint to identify infected cells and accurately monitor their clonal expansion. We isolated large numbers of integra-tion sites and quantified the clone sizes of eighteen clin-ical samples by our high throughput and validated methodology. We defined a threshold system that cate-gorizes the size of clones into discrete groups based on the number of infected cells in each clone. We could quantify polyclonal, oligoclonal and monoclonal patterns using this categorization. We found that harboring larger clones was strongly associated with the progression of a patient to the more aggressive type of ATL, whereas smaller clones were observed across all samples and had little impact on progression. All samples with low PVLs (<10%) had smaller clones, however those with higher PVL had both smaller clones and one or two dominant larger clones. For the first time, we suggested DFA as a formalism that can represent sequential order of clones. We found that our DFA accurately reflect the true patterns of clonal expansion for each sample. Analyzing a large cohort of clinical samples from the same patients over time with the appropriate formal models will pro-vide new insights into the clonal expansion of ATL and will allow for possible clinical applications of clonality in molecular diagnostics and predictions of prognosis.
Additional files
Additional file 1: Table S1.Five largest clones and their integration-site positions for each sample.Figure S1.Overview of the library preparation for sequencing and data analysis. We used a specific pipeline to isolate integration sites from the raw NGS data. In the case of Read-1, the first 5 bp were trimmed, the next 5 bp were used to de-multiplex indexed samples, the 23 bp corresponding to the LTR primer were removed, the next 27 bp were subjected to a BLAST search against the long terminal repeat (LTR) reference sequence, and the remaining 40 bp were subjected to a BLAST search against an HTLV-1 reference sequence. Reads confirmed to be from HTLV-1 were removed, and the remaining reads were considered to be human. Using Bowtie, we then aligned those reads to the human genome (hg19). Subsequently, we retrieved data from Read-2 (tag information) to measure the clone sizes. The final output included information about the integration sites and clone sizes and was input as a string of information into our model. Finally we constructed DFA machines for each analyzed sample.Figure S2.Distribution of PVLs across the analyzed samples. The samples are displayed in descending order based on their largest clone size. (F18, F17, F1, F4, F2, F3, F10, F5, F6, F7, F9, F8, F15, F14, F13, F11, F16 and F12) on X axis. The corresponding PVLs of each sample are shown on Y axis. The PVLs and the size of largest clones had a correlation of R2 = 0.785.
The samples are displayed in ascending order based on their largest clones. Three main patterns, polyclonal, oligoclonal and monoclonal, were observed and categorized. The polyclonal pattern is divided (blue dashed line) into samples with PVL≤4% and PVL > 4%. (PDF 386 kb)
Abbreviations
ATL:Adult T-cell leukemia; HTLV-1: Human T-cell leukemia virus type-1; PVL: Proviral load; AC: Asymptomatic carrier; SM: Smoldering; JSPFAD: Joint Study on Predisposing Factors of ATL Development; NGS: Next generation sequencing; DFA: Deterministic finite state automata
Acknowledgements
A. Farmanbar expresses deep respect and gratitude to the Otsuka Toshimi scholarship foundation for supporting his graduate studies. We thank JSPFAD for providing clinical samples; M. Nakashima and T. Akashi for maintenance of JSPFAD; T. Yamada and H. Farmanbar for their advices onin silicoanalysis and mathematics; Y. Suzuki, K. Abe, K. Imamura, T. Horiuchi, and M. Tosaka for sequencing technical support; and U. Firouzi for helps in design of figures. Computational analyses were provided by the supercomputer system of the Human Genome Center, the Institute of Medical Science, the University of Tokyo. We appreciate the technical assistance by Hideyuki Nishijima.
Funding
This work was supported by Japan Agency for Medical Research and Development (AMED) grant number of 16ck0106133h0103 and
16ck0106136h0103 to (TW), Ministry of Education, Culture, Sports, Science, and Technology grant number of 221S0001 and 26293226 to (TW); the Japanese Society for the Promotion of Science, DC1 grant number of 24.6916 to (SF).
Availability of data and materials
The datasets generated during the current study have been deposited in the Sequence Read Archive of NCBI with SRA study accession of SRP080123.
Authors’contributions
TW, KU, AF, and SF conceived the project. AF and SF designed and carried out the experiments and wrote the manuscript. AF and SF performedin
silicodata analysis and interpreted the data. SF performed the wet laboratory experiments. AF performed DFA modeling. SP and KN contributed to thein
silicodata analysis and interpretation. All authors assisted in drafting and critically revising the manuscript. TW supervised the study. All authors read and approved the final manuscript.
Competing interests
The authors declare that they have no competing interests.
Consent for publication
Not applicable.
Ethics approval and consent to participate
This project was approved by research ethics committee of the University of Tokyo (approval No.10–50 and No.14–155).
Author details
1Department of Computational Biology and Medical Sciences, Graduate
School of Frontier Sciences, The University of Tokyo, Tokyo, Japan. 2Laboratory of Functional Analysis in silico, Human Genome Center, Institute
of Medical Science, The University of Tokyo, Tokyo, Japan.3Hematology/ Oncology, Research Hospital, Institute of Medical Sciences, The University of Tokyo, Tokyo, Japan.4Department of Advanced Medical Innovation, St. Marianna University School of Medicine, Kanagawa, Japan.
Received: 30 October 2016 Accepted: 22 December 2016
References
1. Nowell PC. The clonal evolution of tumor cell populations. Science. 1976;194(4260):23–8.
2. Crespi B, Summers K. Evolutionary biology of cancer. Trends Ecol Evol. 2005;20(10):545–52.
3. Merlo LMF, Pepper JW, Reid BJ, Maley CC. Cancer as an evolutionary and ecological process. Nat Rev Cancer. 2006;6(12):924–35.
4. Greaves M. Evolutionary determinants of cancer. Cancer Discov. 2015;5(8):806–20. 5. Greaves M. Cancer causation: the Darwinian downside of past success?
Lancet Oncol. 2002;3(4):244–51.
6. Greaves M, Maley CC. Clonal evolution in cancer. Nature. 2012; 481(7381):306–13.
7. Sprouffske K, Merlo LM, Gerrish PJ, Maley CC, Sniegowski PD. Cancer in light of experimental evolution. Curr Biol. 2012;22(17):R762–771.
8. Firouzi S, Lopez Y, Suzuki Y, Nakai K, Sugano S, Yamochi T, Watanabe T. Development and validation of a new high-throughput method to investigate the clonality of HTLV-1-infected cells based on provirus integration sites. Genome Med. 2014;6(6):46.
9. Horne SD, Ye CJ, Abdallah BY, Liu G, Heng HHQ. Cancer genome evolution. Transl Cancer Res. 2015;4(3):303–13.
10. Sidow A, Spies N. Concepts in solid tumor evolution. Trends Genet. 2015;31(4):208–14.
11. Takatsuki K. Discovery of adult T-cell leukemia. Retrovirology. 2005;2:16. 12. Gallo RC. The discovery of the first human retrovirus: HTLV-1 and HTLV-2.
Retrovirology. 2005;2:17.
13. Okamoto T, Ohno Y, Tsugane S, Watanabe S, Shimoyama M, Tajima K, Miwa M, Shimotohno K. Multi-step carcinogenesis model for adult T-cell leukemia. Jpn J Cancer Res. 1989;80(3):191–5.
14. Fujino T, Nagata Y. HTLV-I transmission from mother to child. J Reprod Immunol. 2000;47(2):197–206.
15. Tsukasaki K, Tobinai K. Biology and treatment of HTLV-1 associated T-cell lymphomas. Best Pract Res Clin Haematol. 2013;26(1):3–14.
16. Etoh K, Tamiya S, Yamaguchi K, Okayama A, Tsubouchi H, Ideta T, Mueller N, Takatsuki K, Matsuoka M. Persistent clonal proliferation of human T-lymphotropic virus type I-infected cellsin vivo. Cancer Res. 1997;57(21):4862–7.
17. Ishitsuka K, Tamura K. Human T-cell leukaemia virus type I and adult T-cell leukaemia-lymphoma. Lancet Oncol. 2014;15(11):e517–526.
18. Iwanaga M, Watanabe T, Yamaguchi K. Adult T-cell leukemia: a review of epidemiological evidence. Front Microbiol. 2012;3:322.
19. Iwanaga M, Watanabe T, Utsunomiya A, Okayama A, Uchimaru K, Koh KR, Ogata M, Kikuchi H, Sagara Y, Uozumi K, et al. Human T-cell leukemia virus type I (HTLV-1) proviral load and disease progression in asymptomatic HTLV-1 carriers: a nationwide prospective study in Japan. Blood. 2010;116(8):1211–9.
20. Yoshida M, Seiki M, Yamaguchi K, Takatsuki K. Monoclonal integration of human T-cell leukemia provirus in all primary tumors of adult T-cell leukemia suggests causative role of human T-cell leukemia virus in the disease. Proc Natl Acad Sci U S A. 1984;81(8):2534–7.
21. Rodriguez-Brenes IA, Wodarz D. Preventing clonal evolutionary processes in cancer: Insights from mathematical models. Proc Natl Acad Sci U S A. 2015;112(29):8843–50.
22. Berry CC, Gillet NA, Melamed A, Gormley N, Bangham CRM, Bushman FD. Estimating abundances of retroviral insertion sites from DNA fragment length data. Bioinformatics. 2012;28(6):755–62.
23. Gillet NA, Malani N, Melamed A, Gormley N, Carter R, Bentley D, Berry C, Bushman FD, Taylor GP, Bangham CRM. The host genomic environment of the provirus determines the abundance of HTLV-1–infected T-cell clones. Blood. 2011;117(11):3113–22.
24. Kamihira S, Sugahara K, Tsuruda K, Minami S, Uemura A, Akamatsu N, Nagai H, Murata K, Hasegawa H, Hirakata Y, et al. Proviral status of HTLV-1 integrated into the host genomic DNA of adult T-cell leukemia cells. Clin Lab Haematol. 2005;27(4):235–41.
25. Cook LB, Rowan AG, Melamed A, Taylor GP, Bangham CR. HTLV-1-infected T cells contain a single integrated provirus in natural infection. Blood. 2012;120(17):3488–90.
26. Gammon K. Mathematical modelling: Forecasting cancer. Nature. 2012;491(7425):S66–67.
27. Segal E, Friedman N, Kaminski N, Regev A, Koller D. From signatures to models: understanding cancer using microarrays. Nat Genet. 2005;37:S38–45.
28. Altrock PM, Liu LL, Michor F. The mathematics of cancer: integrating quantitative models. Nat Rev Cancer. 2015;15(12):730–45.
30. Beerenwinkel N, Schwarz RF, Gerstung M, Markowetz F. Cancer evolution: mathematical models and computational inference. Syst Biol.
2015;64(1):e1–25.
31. Tanaka RJ, Ono M. Skin Disease Modeling from a Mathematical Perspective. J Invest Dermatol. 2013;133(6):1472–8.
32. Nowak MA, Bangham CR. Population dynamics of immune responses to persistent viruses. Science. 1996;272(5258):74–9.
33. Wodarz D, Bangham CR. Evolutionary dynamics of HTLV-I. J Mol Evol. 2000;50(5):448–55.
34. Stilianakis NI, Seydel J. Modeling the T-cell dynamics and pathogenesis of HTLV-I infection. Bull Math Biol. 1999;61(5):935–47.
35. Wang L, Li MY, Kirschner D. Mathematical analysis of the global dynamics of a model for HTLV-I infection and ATL progression. Math Biosci.
2002;179(2):207–17.
36. Katri P, Ruan S. Dynamics of human T-cell lymphotropic virus I (HTLV-I) infection of CD4+ T-cells. C R Biol. 2004;327(11):1009–16.
37. Cai L, Li X, Ghosh M. Global dynamics of a mathematical model for HTLV-I infection of CD4+ T-cells. Appl Math Model. 2011;35(7):3587–95.
38. Lim AG, Maini PK. HTLV-I infection: a dynamic struggle between viral persistence and host immunity. J Theor Biol. 2014;352:92–108.
39. Harel D. Statecharts - a Visual Formalism for Complex-Systems. Sci Comput Program. 1987;8(3):231–74.
40. Turing AM. On computable numbers, with an application to the Entscheidungsproblem. P Lond Math Soc. 1937;42:230–65.
41. Khwaja AA, Urban JE. A property based specification formalism classification. J Syst Software. 2010;83(11):2344–62.
42. Hopcroft JE, Motwani R, Ullman JD. Introduction to Automata Theory, Languages, and Computation. 3rd ed. Prentice Hall; 2006. ISBN 10: 0321455371 / ISBN 13: 9780321455376
43. Demetriu LA. Abstract Biological Systems as Sequential Machines -Behavioral Reversibility. B Math Biophys. 1966;28(2):153–60.
44. Yamaguchi K, Uozumi K, Taguchi H, Kikuchi H, Okayama A, Kamihira S, Hino S, Nosaka K, Watanabe T. Nationwide cohort study of HTLV-1 carriers in Japan: Joint study on predisposing factors of ATL development (JSPFAD). Aids Res Hum Retrov. 2007;23(4):582–2.
45. Biomaterial resource bank of HTLV-1 carriers JSPFAD: http://htlv1.org/old/ bank-en.html. Accessed 29 Oct 2016.
46. Shimoyama M. Diagnostic criteria and classification of clinical subtypes of adult T-cell leukaemia-lymphoma. A report from the Lymphoma Study Group (1984–87). Br J Haematol. 1991;79(3):428–37.
47. FastQC: A quality control tool for high throughput sequence data.http://
wwwbioinformaticsbabrahamacuk/projects/fastqc/.
48. Altschul SF, Gish W, Miller W, Myers EW, Lipman DJ. Basic Local Alignment Search Tool. J Mol Biol. 1990;215(3):403–10.
49. Seiki M, Hattori S, Hirayama Y, Yoshida M. Human adult T-cell leukemia virus: complete nucleotide sequence of the provirus genome integrated in leukemia cell DNA. Proc Natl Acad Sci U S A. 1983;80(12):3618–22. 50. Langmead B, Trapnell C, Pop M, Salzberg SL. Ultrafast and memory-efficient
alignment of short DNA sequences to the human genome. Genome Biol. 2009;10(3):R25.
51. Holub J. The Finite Automata Approaches in Stringology. Kybernetika. 2012;48(3):386–401.
52. Shendure J, Aiden EL. The expanding scope of DNA sequencing. Nat Biotechnol. 2012;30(11):1084–94.
53. Shou W, Bergstrom CT, Chakraborty AK, Skinner FK. Theory, models and biology. Elife. 2015;4:e07158.
54. May RM. Uses and abuses of mathematics in biology. Science. 2004;303(5659):790–3.
55. Fisher J, Henzinger TA. Executable cell biology. Nat Biotechnol. 2007;25(11):1239–49.
56. Takemoto S, Matsuoka M, Yamaguchi K, Takatsuki K. A novel diagnostic method of adult T-cell leukemia: monoclonal integration of human T-cell lymphotropic virus type I provirus DNA detected by inverse polymerase chain reaction. Blood. 1994;84(9):3080–5.
57. Tsukasaki K, Tsushima H, Yamamura M, Hata T, Murata K, Maeda T, Atogami S, Sohda H, Momita S, Ideda S, et al. Integration patterns of HTLV-I provirus in relation to the clinical course of ATL: frequent clonal change at crisis from indolent disease. Blood. 1997;89(3):948–56.
58. Tsukasaki K, Hermine O, Bazarbachi A, Ratner L, Ramos JC, Harrington Jr W, O’Mahony D, Janik JE, Bittencourt AL, Taylor GP, et al. Definition, prognostic
factors, treatment, and response criteria of adult T-cell leukemia-lymphoma: a proposal from an international consensus meeting. J Clin Oncol. 2009;27(3):453–9.
59. Aoki S, Firouzi S, Lopez Y, Yamochi T, Nakano K, Uchimaru K, Utusnomiya A, Iwanaga M, Watanabe T. Transition of adult T-cell leukemia/lymphoma clones during clinical progression. Int J Hematol. 2016;104(3):330–7.
• We accept pre-submission inquiries
• Our selector tool helps you to find the most relevant journal
• We provide round the clock customer support
• Convenient online submission
• Thorough peer review
• Inclusion in PubMed and all major indexing services
• Maximum visibility for your research
Submit your manuscript at www.biomedcentral.com/submit