RESEARCH
Optimizing recombinant protein
expression via automated induction profiling
in microtiter plates at different temperatures
Martina Mühlmann , Eva Forsten, Saskia Noack and Jochen Büchs
*Abstract
Background: Escherichia coli (E. coli) is the most abundant expression host for recombinant proteins. The produc-tion efficiency is dependent on a multitude of parameters. Therefore, high-throughput applicaproduc-tions have become an increasingly frequent technique to investigate the main factors. Within this study, the effects of temperature, induc-tion time and inducer concentrainduc-tion on the metabolic state and the product formainduc-tion were extensively examined. Induction profiling of E. coli Tuner(DE3) pRhotHi-2-EcFbFP was performed in 48-well Flowerplates and standard 96-well plates using a robotic platform. In parallel shake flask cultivations, the respiration activity of the microorgan-isms was analyzed. Therefore, two online-monitoring systems were applied: the BioLector for microtiter plates and the RAMOS-device for shake flasks. The impact of different induction conditions on biomass and product formation as well as on the oxygen transfer rate was surveyed.
Results: Different optimal induction conditions were obtained for temperatures of 28, 30, 34, and 37 °C. The best inducer concentrations were determined to be between 0.05 and 0.1 mM IPTG for all investigated temperatures. This is 10–20 times lower than conventional guidelines suggest. The induction time was less relevant when the correct inducer concentration was chosen. Furthermore, there was a stronger impact on growth and respiration activity at higher temperatures. This indicated a higher metabolic burden. Therefore, lower IPTG concentrations were advanta-geous at elevated temperatures. Very similar results were obtained in standard 96-well plates.
Conclusion: Two online-monitoring systems were successfully used to investigate the optimal induction conditions for the E. coli Tuner(DE3) pRhotHi-2-EcFbFP strain (lacY deletion mutant) at four different temperatures. The experi-mental effort was reduced to a minimum by integrating a liquid handling robot. To reach the maximum product formation, a detailed induction analysis was necessary. Whenever the cultivation temperature was changed, the induction conditions have to be adapted. Due to the experimental options provided by the BioLector technology, it was found that the higher the cultivation temperature, the lower the inducer concentration that has to be applied. Keywords: Induction profiling, Recombinant protein, Temperature, E. coli, High-throughput, Microtiter plate, BioLector
© The Author(s) 2017. This article is distributed under the terms of the Creative Commons Attribution 4.0 International License (http://creativecommons.org/licenses/by/4.0/), which permits unrestricted use, distribution, and reproduction in any medium, provided you give appropriate credit to the original author(s) and the source, provide a link to the Creative Commons license, and indicate if changes were made. The Creative Commons Public Domain Dedication waiver (http://creativecommons.org/ publicdomain/zero/1.0/) applies to the data made available in this article, unless otherwise stated.
Background
In 1982, the recombinant protein technology achieved the great breakthrough with Humulin, a recombinant human insulin expressed in Escherichia coli (E. coli), which was the first approved biopharmaceutical [1]. Since that time, more than 400 recombinant proteins
were introduced to the market [2]. E. coli is still the most popular host organism for heterologous protein produc-tion due to its well-known genetics, high growth rates on inexpensive media, and a wide range of possible expres-sion vectors [3].
Recombinant protein production always implicates a perturbation of the host cell metabolism, which typically leads to lower biomass growth rates [4–6]. This stems from high maintenance requirements for the replication
Open Access
of inserted plasmids and from the resources needed for the transcription of target genes [7–9]. Particularly, plas-mids with high copy numbers can overburden the cell and induce a metabolic collapse, which results in low product yields or even cell death [10–12]. Thus, a good balance of biomass growth and product formation asso-ciated with unavoidable cell stress has to be found to achieve high productivity. Therefore, many parameters have to be individually optimized. This involves not only the choice of vector and promoter system, but also com-position of the medium, oxygen supply, cultivation tem-perature and induction conditions [3, 10, 13–17].
The reduction of cultivation temperature is one of the common approaches to prevent formation of inclusion bodies by correct folding of the molecule [18–20]. Unfor-tunately, this comes along with prolonged cultivation times. A fast approach to investigate temperature effects in microtiter plates is through temperature profiling as described by Kunze et al. [21].
One of the most frequently used expression systems is the E. coli T7 system under control of the lac operon, present in pET and pRhot vectors. The expression of the target protein can be induced with lactose or the non-degradable analog isopropyl β-d-thiogalactopyranoside (IPTG) [22, 23]. Such inducible expression systems allow the precise and adjustable separation of growth and pro-duction phases by the variation of inducer concentration and induction time. However, the large space available for optimization is also coupled to high experimental effort. This can be handled with miniaturized cultiva-tions in high-throughput applicacultiva-tions. The fast detection of optimized induction conditions can be conducted on robotic platforms [24].
Miniaturization of culture scale may impede access to process parameters and sufficient oxygen supply. Oxygen limited cultivations should be avoided to achieve repro-ducible results and enable easy scale-up. Moreover, insuf-ficient oxygen supply mostly leads to altered metabolism and lower product formation [25–27]. A good strategy is to use special 48-well flower-shaped microtiter plates incubated in a BioLector device to detect biomass and fluorescent molecules via optical measurements. The flower shape of the wells serve as baffles allowing oxygen transfer rates (OTR) of up to 100 mmol/L/h [28, 29].
Several studies have shown the results of induction profiles in 48-well Flowerplates but either at single tem-peratures [24, 30–32] or with few data points [33, 34]. The aim of this study was to comprehensively investigate the effect of temperature on optimal induction condi-tions. Therefore, the fluorescent model protein FbFP was expressed in E. coli Tuner(DE3) under control of the T7 promoter. This strain has a lacY deletion to prevent the active transport of IPTG into the cell. Instead, IPTG
enters the cell solely via concentration-dependent diffu-sion [35]. Complete induction profiles with variations of IPTG concentrations and times of induction were per-formed in 48-well Flowerplates. The robotic platform RoboLector consisting of a liquid handling system and a BioLector device was used to enable an automated induc-tion. During cultivation, biomass concentration and product formation were detected via scattered light and fluorescence measurement. Oxygen transfer rates were observed in simultaneous shake flask cultivations using the Respiration Activity Monitoring System (RAMOS)-device and compared to the results obtained in microtiter plates.
Methods Microorganism
For all experiments, the strain E. coli Tuner(DE3) pRhotHi-2-EcFbFP was used. The Tuner(DE3) strains are lacY deletion mutants of BL21; therefore, no lactose permease is produced. The entry of IPTG is solely regu-lated by concentration-dependent diffusion which leads to adjustable levels of homogenous protein expression throughout the entire population [35]. A copy of the T7 polymerase gene controlled by the lacUV5 promoter is chromosomally integrated. The plasmid pRhotHi-2 is provided with a T7 promoter to allow inducible high-level expression of heterologous proteins [23]. The recombinant protein EcFbFP is an (FMN)-binding fluo-rescent protein, which is codon-optimized for the expres-sion in E. coli and whose maturation is, compared to GFP, independent of oxygen supply [36].
Shake flask cultivations in RAMOS device
The in-house manufactured RAMOS is a device used for online-monitoring of the OTR, the carbon dioxide transfer rate (CTR) and the respiratory quotient (RQ) in up to eight shake flasks. The OTR is a suitable param-eter to quantify the physiological state of a culture of aerobic microorganisms [37]. Commercial versions of the RAMOS device can be purchased from Kühner AG, Birs-felden, Switzerland or HiTec Zang GmbH, Herzogenrath, Germany. All shake flask cultivations were conducted in 250 mL shake flasks and cultivated on an orbital shaker (ISF1-X, Kühner AG, Birsfelden, Switzerland) at a shak-ing frequency of 350 rpm and a shakshak-ing diameter of 50 mm.
Microtiter plate cultivations in the BioLector device
Depending on the applied optical filter or monochro-mator position, the backscattered light (indicator for biomass) or the fluorescence of the sample (indicator for fluorescent products) can be detected. In this work, a commercially available BioLector (m2p-Labs, Bae-sweiler, Germany) was used for the measurement of scattered light, FbFP-fluorescence and DOT. For DOT measurements, Flowerplates with optodes were used (MTP-48-BO, m2p-Labs, Baesweiler, Germany). The cor-responding excitation and emission wavelength as well as the gain factors are specified in Table 1. 48-well and 96-well microtiter plate cultivations were performed at a shaking frequency of 1400 and 1000 rpm, respectively. The shaking diameter was always 3 mm.
The BioLector is part of the so-called RoboLector plat-form which combines the BioLector technology with a liquid handling system. It was already introduced by Huber et al. [24] and extended by Mühlmann et al. [39]. The robot enables the automation of many process steps and is used in this work for the automated induction of cultures.
Growth media
Two different growth media were used for cultiva-tion. The first preculture was incubated in complex ter-rific broth (TB) [40]. The medium was composed of 12 g/L tryptone (Lot Number: 134209944), 24 g/L yeast extract (Lot Number: 314216947), 12.54 g/L K2HPO4, 2.31 g/L KH2PO4 and 5 g/L glycerol dissolved in deion-ized water. All ingredients were purchased from Roth, Karlsruhe, Germany. The pH-value was 7.2 ± 0.2 with-out adjustment. The second preculture and the main culture were carried out in modified Wilms-MOPS mineral medium according to Wilms et al. [41]. The mineral medium consisted of 20 g/L glucose, 6.98 g/L (NH4)2SO4, 3 g/L K2HPO4, 2 g/L Na2SO4, 0.2 M (N-Morpholino)-propanesulfonic acid (MOPS), 0.5 g/L MgSO4·7H2O, 0.01 g/L thiamine hydrochloride, 1 mL/L trace element solution [0.54 g/L ZnSO4·7H2O, 0.48 g/L CuSO4·5H2O, 0.3 g/L MnSO4·H2O, 0.54 g/L CoCl2·6H2O, 41.76 g/L FeCl3·6H2O, 1.98 g/L CaCl2·2H2O, 33.4 g/L Na2EDTA·2H2O (Titriplex III)]. The pH-value was adjusted to 7.5 using 1 M NaOH. Both media were sup-plemented to obtain a final concentration of 50 µg/mL kanamycin from a 1000-fold concentrated stock solution prior to cultivation.
For induction, IPTG was dissolved in a pure basic Wilms-MOPS mineral medium (without glucose, trace elements, magnesium sulfate, thiamine and kanamycin). Different concentrated stock solutions were prepared to enable the final correct IPTG concentrations (0–1 mM) in the respective microtiter plate well.
Precultures
All experiments started with two precultivation steps in shake flasks. For the first preculture, 10 mL of TB-medium were inoculated to an initial optical density of 0.05 (OD600) from cryogenically preserved cultures and incubated over night at 30 °C. For the second preculture, 8 mL of the modified Wilms-MOPS mineral medium were inoculated to an initial optical density of 0.2 (OD600) from the first preculture and incubated at 37 °C in a RAMOS device until the OTR reached a value between 20 and 40 mmol/L/h.
Main cultivation
The main cultivations were carried out simultaneously in RAMOS and BioLector devices at temperatures of 28, 30, 34, and 37 °C. To enable equal starting conditions in shake flasks and microtiter plates, a mastermix consist-ing of Wilms-MOPS mineral medium inoculated with cells from the second preculture was prepared. The ini-tial optical density (OD600) was set to 0.1. The mastermix was thereupon distributed among the cultivation sys-tems. The shake flask cultivation conditions were identi-cal to the second preculture. Microtiter plate cultivations were conducted in 48-well Flowerplates (m2p-Labs, Bae-sweiler, Germany) and 96-well plates (black-clear, BD-Bioscience, USA). Each well was filled either with 800 µL (48-well) or 200 µL (96-well) mastermix and sealed with a gas permeable perforated silicone layer (F-GPRS48-10, m2p-Labs, Baesweiler, Germany) or a gas permeable membrane (AeraSeal, Excel-Scientific, CA, USA).
Induction profiling
During the main cultivation, the induction was carried out automatically for microtiter plate cultivations by the liquid handling system (Hamilton STAR, Hamilton Robotics, Martinsried, Germany) as part of the RoboLec-tor platform and manually for shake flask cultivations. An appropriate concentrated IPTG-gradient was provided in a single 96-well microtiter plate (flat-bottom, Roth, Karlsruhe, Germany) sealed with X-pierce film (XP-25, Excel Scientific, CA, USA). This plate was located out-side of the BioLector on the RoboLector deck at room temperature. Within the programmed RoboLector
Table 1 Applied excitation and emission wavelength for BioLector cultivations
Optical signal Excitation (nm) Emission (nm) Gain (−)
Scattered light 620 – 20
FbFP 450 492 60
method, the user can individually select the columns to be induced, the induction volume and time. For induc-tion profiling, 20 µL (48-well) or 10 µL (96-well) of the provided IPTG solution were transferred column by col-umn at predefined times by the liquid handling system into the microtiter plate standing inside the BioLector device. By the end, the IPTG concentration in each well was between 0–1 mM. For induction with 0 mM IPTG, pure basic Wilms-MOPS mineral medium (without glu-cose, trace elements, magnesium sulfate, thiamine and kanamycin) instead of IPTG, was used.
Offline analysis
Standard optical density (OD600) was determined manu-ally for the calibration curve (Additional file 1: Figure S5) via a Genesys 20 photometer (Thermo Scientific, Dreieich, Germany) in 1.5 mL microcuvettes (PS, Plastibrand, Roth, Karlsruhe, Germany). For values higher than 0.4 the sam-ples were appropriately diluted with 0.9% [m/v] NaCl solu-tion. Osmolality was measured by a cryoscopic osmometer (Osmomat 030, Gonotec GmbH, Berlin, Germany).
Calibration curve
To allow the conversion of scattered light, measured by the RoboLector device, into standard OD600, calibration curves for 48-well and 96-well microtiter plates were generated. A non-induced main culture from the station-ary phase was utilized. The cell culture was centrifuged at 18,000g for 10 min, the supernatant was removed and the cell pellet was resuspended in Wilms-MOPS mineral medium (without glucose) to adjust OD600 values from 0.1 to 12. Cavities of a 48-well Flowerplate (singular deter-mination of samples) and 96-well microtiter plate (trip-licate determination of samples) were filled with 800 or 200 µL, respectively. Scattered light was measured at tem-peratures of 28, 30, 34, and 37 °C, applying the BioLector system with the parameters listed in Table 1. Data were determined from at least five consecutive measurement cycles. The shaking frequencies used were identical to the cultivation conditions. The data were fitted using linear regression with the software Origin 9.0. The results are presented in Additional file 1: Figure S5. These fits were applied to calculate the OD600 at the respective time of induction for all induction profiles (upper x-axis of Figs. 2,
4, 5 and Additional file 1: Figures S1–S2). The scattered light mean of all cultivations that have not been induced up to this time were used to obtain the respective OD600.
Results and discussion
Comparable oxygen supply in microtiter plates and shake flasks
The combination of RAMOS and BioLector online-monitoring technologies provide broad information of
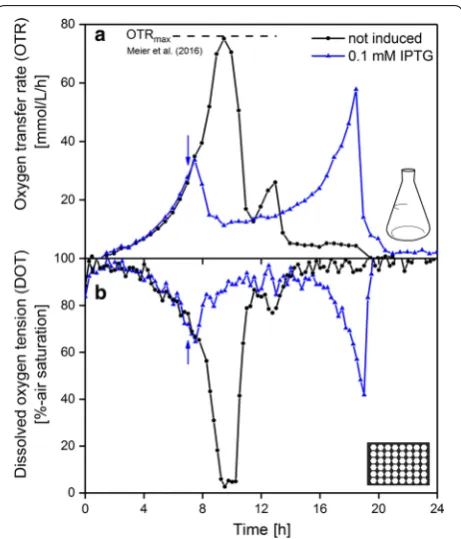
maximum reached OTR lies at 76 mmol/L/h. This agrees with the calculated OTRmax according to Meier et al. [46]. The osmolality, which is required to calculate the OTRmax, was determined in an additional experiment (data not shown), where samples were taken every hour. The osmo-lality decreased from 0.69 Osmol/kg at the beginning of the cultivation to 0.52 Osmol/kg at the end of the cultiva-tion. During the critical time at around 9–11 h, the osmo-lality reached a value of around 0.62 Osmol/kg, leading to the calculated OTRmax value. This is the first hint of a short oxygen limitation and it is confirmed when looking at the slope of the OTR curve. It is clearly visible that a higher OTR would have been reached when the increase in OTR would not be limited by the maximum oxygen transfer capacity of the shake flask under these cultivation conditions. Hence, a short oxygen limitation is present for
both cultivation systems. This was accepted since induced cultures typically do not reach such high OTR values. This was proven through a culture which was induced after 7 h with 0.1 mM IPTG. The OTR and DOT differ largely from the non-induced culture. The oxygen con-sumption decreases more or less directly after induction and remains at a low plateau afterwards. At the end of the cultivation, the OTR increases again, but no oxygen limi-tation occurres throughout the cultivation. This can be confirmed by the progress of DOT as the curve never falls below 40% air saturation.
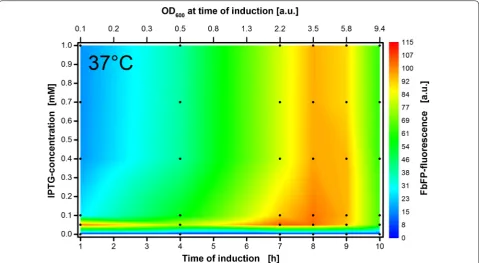
Induction profiling covering conventional conditions The induction profile of E. coli Tuner(DE3) EcFbFP at 37 °C in a 48-well Flowerplate is illustrated in Fig. 2. Dur-ing the whole cultivation process, scattered light and FbFP-fluorescence was measured for 36 individual culti-vations (indicated by black dots in Fig. 2). The maximal achieved recombinant protein content in terms of fluo-rescence intensity at the end of each cultivation is shown in dependency of the inducer concentration and time of induction. Since many manuals recommend using 1 mM IPTG by default [13], the utilized IPTG gradient ranges from 0 to 1 mM. As described in the methods sec-tion, this IPTG-gradient was automatically added by the RoboLector into the 48-well Flowerplate. Thereby, the shaking process of the Flowerplate inside the BioLector device stopped shortly at distinct induction times rang-ing from 1 to 10 h after the start of the main culture.
A characteristic optimum consisting of a horizon-tal and vertical part forming a reversed “L” is indicated by red color coding in the graph. When induction takes place within the small time slot of 8–9 h of cultivation, high fluorescence intensities are reached independent of IPTG concentration. When induction occurs within the first 9 h of cultivation, a specific low inducer concentra-tion of 0.05 mM IPTG has to be used.
The biomass concentration has to reach a distinct threshold to withstand the metabolic burden induced by higher IPTG concentrations. The higher the biomass concentration, the lower the IPTG to cell ratio. Involv-ing the optical density OD600 (Fig. 2, upper x-axis), the threshold lies in this case at a value around 3.5. How-ever, a very late induction is also counterproductive since most of the resources are then already converted to bio-mass instead of recombinant proteins. For practical and economic reasons, it is worthwhile to utilize low inducer concentrations (0.05 mM IPTG at 37 °C). This saves expensive chemicals and no mandatory online-monitor-ing is necessary since induction time has a low impact. However, it has to be mentioned that the same low IPTG concentration in a culture of strains holding the lacY gene could result in lower product formation due to the Fig. 1 Comparison of oxygen transfer rate (OTR, measured in shake
irregular distribution of IPTG within the entire popula-tion. Since the temperature is reduced in the next sec-tion, the large experimental space up to 1 mM IPTG was also checked at 30 °C (see Additional file 1: Figure S1). Just as for 37 °C, no improvement in product formation is observed for IPTG concentrations above 0.4 mM. To optimize the experimental search space, the maximum applied inducer concentration was therefore reduced to 0.4 mM IPTG. Consequently, higher information den-sity is achieved within the inducer concentration ranging from 0 to 0.4 mM.
Comparison of selected induction conditions at 28 and 37 °C
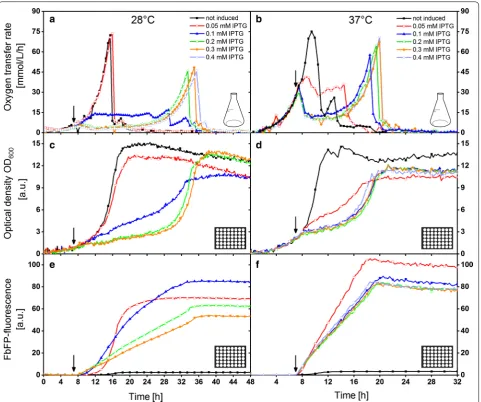
A comparison of OTR, biomass and product formation at 28 and 37 °C is given in Fig. 3. The standard cultiva-tion temperature of E. coli is 37 °C. In contrast, 28 °C is far from the optimal growth temperature. However, it is often used to obtain soluble recombinant protein pro-duction and to avoid inclusion body formation [18, 20]. The results are obtained from two parallel RAMOS and BioLector cultivations, respectively. The same data are also available for 30 and 34 °C in Additional file 1: Fig-ure S3. The cultivation at 37 °C was conducted under
the same cultivation conditions as for Fig. 2, besides a smaller IPTG concentration range. Induction was manu-ally performed in shake flask cultivations and automati-cally in microtiter plate cultivations after 7 h (indicated by arrows). This time was chosen in advance. It was intended to detect the most diverse oxygen transfer rates and product formations for different inducer concentra-tions at one induction time. Because of one failed auto-mated induction in the microtiter plate, the curves for 0.4 mM IPTG at 28 °C (Fig. 3c, e) are missing.
The non-induced culture reaches the maximum OTR within 16 h at 28 °C (Fig. 3a), whereas it takes only 9 h at 37 °C (Fig. 3b). This clearly indicates, as expected, a higher growth rate at a higher temperature. For the induced cultures, the induction took place after 7 h for both temperatures. Therefore, the culture at 28 °C was induced at lower cell densities than the one at 37 °C. A direct comparison of the effect of induction at the same biomass concentration is provided in Additional file 1: Figure S4.
source is depleted and the OTR drops down. This phe-nomenon is also reflected in the optical density (Fig. 3c, d). The induced growth curve (0.05 mM IPTG) at 28 °C has only low deviations compared to the non-induced culture. The deviation becomes apparent at the end of the cultivation when an optical density of only 13, instead of 15, is reached. Thereby, some of the glucose is consumed to form the product instead of biomass. However, at 37 °C, the biomass growth is strongly dis-turbed after induction with 0.05 mM IPTG and only a
(lower inducer per biomass ratio), the metabolic burden is higher than for 28 °C.
Doubling the inducer concentration to 0.1 mM IPTG increases the metabolic burden significantly for both temperatures. The OTR curve at 28 °C also reveals a plateau, but at a lower level of around 13 mmol/L/h. The optical density progression looks similar to the cultivation with 0.05 mM IPTG at 37 °C, resulting in both having the highest production among the investi-gated induction conditions in Fig. 3. The induction with 0.1–0.4 mM IPTG at 37 °C lead to the following analo-gous trends. Directly after induction, the respiration is strongly reduced and recovers after a few hours, ending with a final relatively high OTR peak. This is consistent with the biomass growth, which is slower compared to 0.05 mM IPTG. The final product concentration attains only a value of 80 a.u. Increasing the IPTG concentration to 0.2 mM or higher at 28 °C, results in similar trends. The OTR stays at a very low level below 4 mmol/L/h after induction, the optical density barely increases for a long time and only low final product concentrations are achieved. However, the biomass growth recovers after 28 h and high final ODs are reached; thus, mar-ginal energy is spent for recombinant protein production. Thus, the metabolic burden was too high at the time of induction.
The results are in good agreement with previously pub-lished observations. Kunze et al. noticed a correlation of OTR and product formation. Phases of low OTR were identified as production phases whereas phases of high OTR were related to low productivity and undisturbed cell growth [47]. There is one extension, which has to be made; phases of low OTR are only related to high pro-ductivity if a specific threshold is exceeded. A respiration rate of about 10 mmol/L/h should still be present.
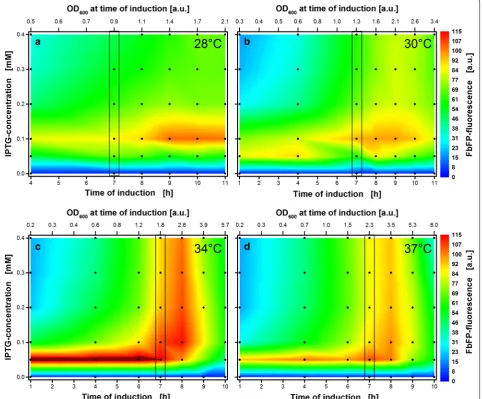
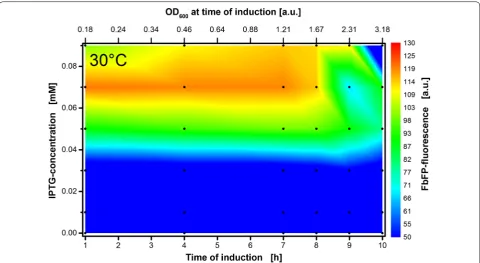
Comparison of induction profiles at four temperatures So far, a strong influence of temperature on the metabo-lism of E. coli Tuner(DE3) pRhotHi-2-EcFbFP was pre-sented in the previous section. The results were shown for selected induction conditions as time progressed. Figure 4 shows the overall formed product at four tem-peratures (28, 30, 34 and 37 °C) over a broad range of induction conditions. The corresponding induction pro-files are illustrated in Fig. 4a–d. Vertical black boxes sym-bolize the induction conditions from parallel shake flask cultivations. Thereby, Fig. 4a, d refer to Fig. 3 and Fig. 4b, c refer to Additional file 1: Figure S3.
The induction profile at 37 °C (Fig. 4d) is a replication of Fig. 2 at lower IPTG concentrations. The area for opti-mal induction concurs quite well for both experiments. The ideal inducer concentration of 0.05 mM IPTG is
identical as well as the best time-point for induction at 8 h or accordingly, an optical density of 3.5.
With a reduction in temperature, the optimal induc-tion zone is shifted and altered (Fig. 4a–d). Firstly, the absolute measured product concentration varies with temperature. The horizontal optimum at 34 °C (0.05 mM IPTG, 1–6 h) is even outside of the applied fluorescence scale. Since the FbFP fluorescence is not temperature sensitive within the investigated temperature range and no inclusion body formation at 37 °C could be detected via SDS-PAGE (data not shown), the highest product concentration is achieved at 34 °C. These findings are in contradiction with the common approach to reduce tem-perature for increased productivity [20], but are consist-ent with some other studies [33, 34].
Secondly, the vertical optimum strongly changes. While the vertical optimal zone is present at 37 and 34 °C, it fades out at 30 °C and disappears at 28 °C. Thus, a defined low inducer concentration is all the more important at lower temperatures. There was the assumption of a later vertical optimum (induction after 11 h and later) for 28 and 30 °C but it was rebutted by the trend of lower opti-mal optical densities at lower temperatures. While the best optical density for induction is 3.5 (x-axis at the top of the graph) at 37 °C, it decreases to 2.6 at 34 °C. It is less clear at 30 °C, but there is a light green-yellow area above the optimum, in particular at 9 h. This less pronounced vertical area corresponds to an optical density of 2.1, which is again lower compared to the higher tempera-tures. Therefore, a further optimum after 11 h at 28 °C is rather unlikely.
Thirdly, the optimal inducer concentration decreases with higher temperatures. This effect was already identi-fied above (see Fig. 3). Thus, the trend is valid for a broad range of induction conditions. While the optimal inducer concentration is 0.1 mM IPTG at 28 °C, it decreases at 34 and 37 °C to 0.05 mM IPTG. A transition area is visible at 30 °C, where 0.05 mM IPTG is preferable for early induc-tion and 0.1 mM IPTG is better for later inducinduc-tion. The optimal inducer concentration seems to lie in between the two concentrations. Thus, this area is investigated in more detail in the next section.
Induction profile with low inducer concentrations
In the previous section, a switch in the optimal inducer concentration from 0.05 to 0.1 mM was detected at 30 °C. It was assumed that the real optimal inducer concen-tration is to be found between those concenconcen-trations. In order to examine the optimal induction conditions at 30 °C more closely, a detailed analysis of smaller inducer concentrations ranging from 0 to 0.09 mM IPTG was conducted. The results are presented in Fig. 5. To high-light the best induction conditions, the scale indicat-ing the FbFP fluorescence is modified in this plot. The
the product concentration is in the same range as for the improved protocol at 30 °C, the assumption is obvious, that the ideal inducer concentration was coincidently met at 34 °C. Probably, equally high product formation can be achieved at all temperatures between 28 and 37 °C when the exact individual inducer concentration between 0 and 0.1 mM IPTG is applied.
Conclusion
Within this study, the ideal induction conditions for the expression of recombinant proteins as a function of tem-perature for the lacY mutant strain E. coli Tuner(DE3) expressing the fluorescent protein EcFbFP was compre-hensively investigated. In comparison to other strains, the lack of lactose permease in this strain enables the uniform distribution of inducer concentration over the entire population. Automated induction profiles at temperatures of 28, 30, 34, and 37 °C were prepared in non-oxygen limited cultures in 48-well Flowerplates using a robotic platform. The obtained results clearly illustrate major changes in induction optima at different temperatures. In general, the following trends could be determined:
• Optimal inducer concentrations for the investigated strain were far below the conventional recommended inducer concentration of 1 mM IPTG. The best results were obtained with an IPTG concentration between 0.05 and 0.1 mM for all investigated tem-peratures.
• The higher the temperature, the lower the optimal IPTG concentration.
• The lower the temperature, the smaller the scope for inducer concentration. At higher temperatures, the area for optimal induction formed a reversed “L”, meaning a horizontal optimum at different induction times and a vertical optimum at different inducer concentrations. At lower temperatures, only the horizontal optimum is left. While IPTG concentra-tions from 0.05 to 1 mM IPTG at distinct induction times result in high product formation at 37 °C, it is restricted to 0.1 mM at 28 °C.
maximum oxygen transfer capacity (OTRmax) constant. The highest product formation was obtained, when the metabolic burden led to a reduced and relatively constant low respiration activity. Furthermore, this was related to a linear growth behavior [48]. When induction took place at the same biomass concentration, lower inducer concentrations resulted in similar metabolic burden, at higher temperatures than the higher inducer concentra-tions at lower temperatures. The validity of the above reported findings for other strains and promoter sys-tems still has to be investigated. However, in preliminary experiments, the E. coli BL21(DE3) strain expressing a cellulase under the control of different promoters resulted also in high product concentrations when small inducer concentrations (0.05–0.1 mM) were applied.
These results confirm the need for induction profiling. Without precise investigation of induction conditions, it is almost impossible to find optimal cultivation condi-tions to express high amounts of recombinant proteins. Certainly, another E. coli strain or another target protein can lead to completely different induction profiles, but the effect of temperature should always be considered. When comparing expression efficiencies at different tem-peratures, the respective optimal induction conditions always have to be used. Otherwise, the comparison is misleading.
Abbreviations
a.u.: arbitrary unit; CTR: carbon dioxide transfer rate; DOT: dissolved oxygen tension; E. coli: Escherichia coli; FbFP: (FMN)-binding fluorescent protein; FMN: flavin mononucleotide; GFP: green fluorescent protein; IPTG: isopropyl β-d
-thiogalactopyranoside; OD: optical density; OD600: optical density at 600 nm; OTR: oxygen transfer rate; OTRmax: maximum oxygen transfer capacity; RAMOS: respiration activity monitoring system; RQ: respiratory quotient; TB: terrific broth.
Authors’ contributions
MM designed the study, supervised the cultivation experiments, performed the data analysis and drafted the manuscript. EF and SN conducted the culti-vation experiments. JB initiated and supervised the study, participated in data interpretation and assisted in drafting the manuscript. All authors read and approved the final manuscript.
Acknowledgements Not applicable.
Competing interests
The authors declare that they have no competing interests.
Additional file
Additional file 1: Figure S1. Induction profile with automated addition of 0–1 mM IPTG solution after 1–10 h of cultivation time at 30 °C. Figure S2. Comparison of induction profiles at 30 and 37 °C in 48-well plates and 96-well plates. Figure S3. Comparison of selected induction conditions at 30 and 34 °C measured in a RAMOS and a BioLector device. Figure S4. Comparison of selected induction conditions at 30 and 34 °C measured in a RAMOS and a BioLector device. Figure S5. Calibration curves for con-version of scattered light measured by the RoboLector device to standard optical density in 48-well and 96-well plates.
Availability of data and materials
The datasets supporting the conclusions of this article are included within the article.
Consent for publication Not applicable.
Ethics approval and consent to participate Not applicable.
Funding
This work was performed as part of the Cluster of Excellence “Tailor-Made Fuels from Biomass”, which is funded by the Excellence Initiative by the German federal and state governments to promote science and research at German universities.
Publisher’s Note
Springer Nature remains neutral with regard to jurisdictional claims in pub-lished maps and institutional affiliations.
Received: 17 July 2017 Accepted: 21 November 2017
References
1. FDA. Human insulin receives FDA approval. FDA Drug Bull. 1982;12:18–9. 2. Sanchez-Garcia L, Martin L, Mangues R, Ferrer-Miralles N, Vazquez E,
Villaverde A. Recombinant pharmaceuticals from microbial cells: a 2015 update. Microb Cell Fact. 2016;15:33.
3. Terpe K. Overview of bacterial expression systems for heterologous protein production: from molecular and biochemical fundamentals to commercial systems. Appl Microbiol Biotechnol. 2006;72:211.
4. Basan M, Hui S, Okano H, Zhang Z, Shen Y, Williamson JR, Hwa T. Overflow metabolism in Escherichia coli results from efficient proteome allocation. Nature. 2015;528:99–104.
5. Betenbaugh MJ, Beaty C, Dhurjati P. Effects of plasmid amplification and recombinant gene expression on the growth kinetics of recombinant E. coli. Biotechnol Bioeng. 1989;33:1425–36.
6. Miao F, Kompala DS. Overexpression of cloned genes using recombinant
Escherichia coli regulated by a T7 promoter: I. Batch cultures and kinetic modeling. Biotechnol Bioeng. 1992;40:787–96.
7. Bhattacharya SK, Dubey AK. Metabolic burden as reflected by mainte-nance coefficient of recombinant Escherichia coli overexpressing target gene. Biotechnol Lett. 1995;17:1155–60.
8. Bienick MS, Young KW, Klesmith JR, Detwiler EE, Tomek KJ, Whitehead TA. The interrelationship between promoter strength, gene expression, and growth rate. PLoS ONE. 2014;9:1–10.
9. Bentley WE, Mirjalili N, Andersen DC, Davis RH, Kompala DS. Plasmid-encoded protein: the principal factor in the “metabolic burden” associ-ated with recombinant bacteria. Biotechnol Bioeng. 1990;35:668–81. 10. Rosano GL, Ceccarelli EA. Recombinant protein expression in Escherichia
coli: advances and challenges. Front Microbiol. 2014;5:116.
11. Dürrschmid K, Reischer H, Schmidt-Heck W, Hrebicek T, Guthke R, Rizzi A, Bayer K. Monitoring of transcriptome and proteome profiles to investi-gate the cellular response of E. coli towards recombinant protein expres-sion under defined chemostat conditions. J Biotechnol. 2008;135:34–44. 12. Rahmen N, Fulton A, Ihling N, Magni M, Jaeger K, Büchs J. Exchange of
single amino acids at different positions of a recombinant protein affects metabolic burden in Escherichia coli. Microb Cell Fact. 2015;14:10. 13. Donovan RS, Robinson CW, Glick BR. Review: optimizing inducer and
culture conditions for expression of foreign proteins under the control of the lac promoter. J Ind Microbiol. 1996;16:145–54.
14. Berrow NS, Büssow K, Coutard B, Diprose J, Ekberg M, Folkers GE, et al. Recombinant protein expression and solubility screening in Escherichia coli: a comparative study. Acta Crystallogr Sect D. 2006;62:1218–26. 15. Morowvat MH, Babaeipour V, Rajabi Memari H, Vahidi H. Optimization
• We accept pre-submission inquiries
• Our selector tool helps you to find the most relevant journal
• We provide round the clock customer support
• Convenient online submission
• Thorough peer review
• Inclusion in PubMed and all major indexing services
• Maximum visibility for your research
Submit your manuscript at www.biomedcentral.com/submit
Submit your next manuscript to BioMed Central
and we will help you at every step:
production by Escherichia coli using the response surface methodology. Jundishapur J Microbiol. 2014;8:e16236.
16. Diederichs S, Korona A, Staaden A, Kroutil W, Honda K, Ohtake H, Büchs J. Phenotyping the quality of complex medium components by simple online-monitored shake flask experiments. Microb Cell Fact. 2014;13:149. 17. Marini G, Luchese MD, Argondizzo APC, de Goes ACMA, Galler R, Alves
TLM, et al. Experimental design approach in recombinant protein expres-sion: determining medium composition and induction conditions for expression of pneumolysin from Streptococcus pneumoniae in Escherichia coli and preliminary purification process. BMC Biotechnol. 2014;14:1. 18. Schein CH, Noteborn MHM. Formation of soluble recombinant proteins
in Escherichia coli is favored by lower growth temperature. Nat Biotech-nol. 1988;6:291–4.
19. Vera A, González-Montalbán N, Arís A, Villaverde A. The conformational quality of insoluble recombinant proteins is enhanced at low growth temperatures. Biotechnol Bioeng. 2007;96:1101–6.
20. Dragosits M, Frascotti G, Bernard-Granger L, Vázquez F, Giuliani M, Baumann K, et al. Influence of growth temperature on the production of antibody Fab fragments in different microbes: a host comparative analysis. Biotechnol Prog. 2011;27:38–46.
21. Kunze M, Lattermann C, Diederichs S, Kroutil W, Büchs J. Minireactor-based high-throughput temperature profiling for the optimization of microbial and enzymatic processes. J Biol Eng. 2014;8:22.
22. Studier FW, Moffatt BA. Use of bacteriophage T7 RNA polymerase to direct selective high-level expression of cloned genes. J Mol Biol. 1986;189:113–30.
23. Katzke N, Arvani S, Bergmann R, Circolone F, Markert A, Svensson V, et al. A novel T7 RNA polymerase dependent expression system for high-level protein production in the phototrophic bacterium Rhodobacter capsula-tus. Protein Expr Purif. 2010;69:137–46.
24. Huber R, Ritter D, Hering T, Hillmer A, Kensy F, Müller C, et al. Robo-Lector—a novel platform for automated high-throughput cultivations in microtiter plates with high information content. Microb Cell Fact. 2009;8:42.
25. Peter CP, Lotter S, Maier U, Büchs J. Impact of out-of-phase conditions on screening results in shaking flask experiments. Biochem Eng J. 2004;17:205–15.
26. Zimmermann HF, Anderlei T, Büchs J, Binder M. Oxygen limitation is a pitfall during screening for industrial strains. Appl Microbiol Biotechnol. 2006;72:1157–60.
27. Freyer SA, König M, Künkel A. Validating shaking flasks as representative screening systems. Biochem Eng J. 2004;17:169–73.
28. Samorski M, Müller-Newen G, Büchs J. Quasi-continuous combined scattered light and fluorescence measurements: a novel measurement technique for shaken microtiter plates. Biotechnol Bioeng. 2005;92:61–8. 29. Funke M, Diederichs S, Kensy F, Müller C, Büchs J. The baffled microtiter
plate: increased oxygen transfer and improved online monitoring in small scale fermentations. Biotechnol Bioeng. 2009;103:1118–28.
30. Hemmerich J, Kensy F. Automated microbioreactor systems for pharma-ceutical bioprocessing: profiling of seeding and induction conditions in high-throughput fermentations. Pharm Bioprocess. 2014;2:227–35. 31. Rohe P, Venkanna D, Kleine B, Freudl R, Oldiges M. An automated
workflow for enhancing microbial bioprocess optimization on a novel microbioreactor platform. Microb Cell Fact. 2012;11:144.
32. Wandrey G, Bier C, Binder D, Hoffmann K, Jaeger K, Pietruszka J, et al. Light-induced gene expression with photocaged IPTG for induction profiling in a high-throughput screening system. Microb Cell Fact. 2016;15:145.
33. Ladd Effio C, Baumann P, Weigel C, Vormittag P, Middelberg A, Hubbuch J. High-throughput process development of an alternative platform for the production of virus-like particles in Escherichia coli. J Biotechnol. 2016;219:7–19.
34. Baumann P, Hahn T, Hubbuch J. High-throughput micro-scale cultivations and chromatography modeling: powerful tools for integrated process development. Biotechnol Bioeng. 2015;112:2123–33.
35. Marbach A, Bettenbrock K. lac operon induction in Escherichia coli: systematic comparison of IPTG and TMG induction and influence of the transacetylase LacA. J Biotechnol. 2012;157:82–8.
36. Drepper T, Huber R, Heck A, Circolone F, Hillmer A, Büchs J, Jaeger K. Flavin mononucleotide-based fluorescent reporter proteins outperform green fluorescent protein-like proteins as quantitative in vivo real-time reporters. Appl Environ Microbiol. 2010;76:5990–4.
37. Anderlei T, Büchs J. Device for sterile online measurement of the oxygen transfer rate in shaking flasks. Biochem Eng J. 2001;7:157–62.
38. Kensy F, Zang E, Faulhammer C, Tan R, Büchs J. Validation of a high-throughput fermentation system based on online monitoring of biomass and fluorescence in continuously shaken microtiter plates. Microb Cell Fact. 2009;8:31.
39. Mühlmann M, Kunze M, Ribeiro J, Geinitz B, Lehmann C, Schwaneberg U, et al. Cellulolytic RoboLector—towards an automated high-throughput screening platform for recombinant cellulase expression. J Biol Eng. 2017;11:1.
40. Tartof KD, Hobbs CA. Improved media for growing plasmid and cosmid clones. Focus. 1987;9:12.
41. Wilms B, Hauck A, Reuss M, Syldatk C, Mattes R, Siemann M, Altenbuchner J. High-cell-density fermentation for production of l-N-carbamoylase
using an expression system based on the Escherichia coli rhaBAD pro-moter. Biotechnol Bioeng. 2001;73:95–103.
42. Wewetzer S, Kunze M, Ladner T, Luchterhand B, Roth S, Rahmen N, et al. Parallel use of shake flask and microtiter plate online measuring devices (RAMOS and BioLector) reduces the number of experiments in laboratory-scale stirred tank bioreactors. J Biol Eng. 2015;9:2. 43. Marques MPC, Cabral JMS, Fernandes P. Bioprocess scale-up: quest for
the parameters to be used as criterion to move from microreactors to lab-scale. J Chem Technol Biotechnol. 2010;85:1184–98.
44. Maier U, Büchs J. Characterisation of the gas–liquid mass transfer in shak-ing bioreactors. Biochem Eng J. 2001;7:99–106.
45. Huber R, Roth S, Rahmen N, Büchs J. Utilizing high-throughput experi-mentation to enhance specific productivity of an E. coli T7 expression system by phosphate limitation. BMC Biotechnol. 2011;11:22.
46. Meier K, Klöckner W, Bonhage B, Antonov E, Regestein L, Büchs J. Correla-tion for the maximum oxygen transfer capacity in shake flasks for a wide range of operating conditions and for different culture media. Biochem Eng J. 2016;109:228–35.
47. Kunze M, Huber R, Gutjahr C, Müllner S, Büchs J. Predictive tool for recom-binant protein production in Escherichia coli shake-flask cultures using an on-line monitoring system. Biotechnol Prog. 2012;28:103–13.
48. Ladner T, Mühlmann M, Schulte A, Wandrey G, Büchs J. Prediction of