Border Cablegation System Design
Thomas J. Trout, Dennis C. Kincaid
MEMBER MEMBER
ASAE ASAE
ABSTRACT
C
ablegation semi-automated irrigation systems can effectively apply water to borders and basins. A buried pipeline conveys water to riser outlets on each border. The system is designed hydraulically such that controlled movement of a plug in the pipe distributes water sequentially to consecutive borders. The outlets operate hydraulically like weirs at heads below 80 mm. Belled-ends on the outlets increases their capacity 75% at low heads. Border cablegation design equations, graphs and procedures are described.
INTRODUCTION
Cablegation is a semi-automated system for applying surface irrigation water (Kemper et al., 1981; Kemper et al., 1985; and Kemper et al., 1987). The system was initially developed for furrow irrigation, but can be effectively adapted to border and basin irrigation. For efficient border or basin irrigation, water is applied at high rates for short periods of time so that the water spreads quickly across the land surface. Short set times and numerous set changes require frequent labor input. Consequently, a system which automatically changes flows from one border to the next will provide substantial labor savings. Since automated systems can more easily be operated on a schedule based on crop water needs or soil characteristics rather than farmer convenience, water application efficiency is often increased.
Several systems to automate border irrigation have been developed (Humpherys, 1986). These systems generally use automated gates or valves at each border which open and/or close in response to a time-based controller. Due to large gravity flows which require large gate sizes and the spatially-distributed control points, these systems tend to be expensive. Also, because numerous gates must all operate properly, reliability is a major concern.
Border cablegation systems can be lower cost and more reliable than other automated systems because they do not require gates and the system operation is controlled from one location. Border cablegation
Article was submitted for publication in January 1989; reviewed and approved for publication by the Soil and Water Div. of ASAE in May
1989.
The authors are: THOMAS J. TROUT and DENNIS C. KINCAID, Agricultural Engineers, USDA-Agricultural Research Service, Soil and Water Management Research Unit, Kimberly, 1D.
Acknowkdgment: The author would like to thank W. D. Kemper for
helping develop cablegation for borders and to Hugh Sharp, a farmer who recognized the potential of the system and has enthusiastically provided a field laboratory for testing developments.
Controller
riff
P messiou
cir,rinpga t.te
tio: Irrigation in
Structure
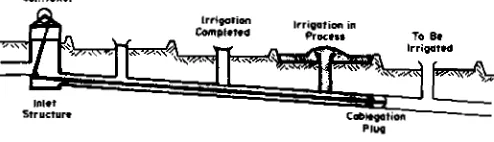
Fig. 1—Schematic of a border cablegation system In operation.
application does require adequate elevation drop between borders or water supply elevation head, as will be discussed. Fourteen border cablegation systems are currently (1989) in operation in three western states.
This article describes the components and operation of border cab legation systems, presents discharge calibrations of larger riser outlets, and presents a procedure for designing the application systems. Procedures for designing the borders or basins themselves will not be discussed.
SYSTEM DESCRIPTION
A border cablegation system, depicted in Fig. 1, is composed of a main conveyance pipeline, which is usually buried, large-diameter riser outlets to each border or basin, a cablegation plug, cable and a plug speed controller. The plug blocks water flow in the main pipeline and forces it out the risers. The plug is attached, via the cable, to the controller which regulates the speed at which water pressure pushes the plug through the pipe. The controller speed is set to advance the plug from one riser to the next in the irrigation time required to apply the desired amount of water. Cablegation plugs, cable, and various types of speed controllers are described in detail in Kemper et al., 1985; Kemper et al., 1987; and USDA-ARS, 1987. Commercial suppliers of components are listed in USDA-ARS (1987).
No valves are used with cablegation systems. Water routing is accomplished by hydraulic design of the main pipe and riser outlets to insure all water discharges onto the border directly upstream of the plug. The elevation difference between riser outlets on consecutive borders must exceed the head (pressure) required to overcome friction loss in the main pipe between outlets and discharge the design flow from a riser or set of risers. Equivalently, the riser outlet size must be large enough to discharge the design flow without backing water up such that it spills from upstream risers.
System grade can be increased beyond the land grade by elevating the risers, as shown in Fig. 2. Sufficient water supply head must be available at the system inlet to discharge the flow from the first outlet. Additional water supply head can be generated by converting open ditches
To Be Irr gated
Adequate Slope on Elevated Outlets
Risers
Inlet Structure Bur ed Cablecotion
I nadequ of e
Lana Slope
Fig. 2—Border cablegation with elevated riser outlets to increase the system grade beyond the land slope.
Irrigation Completed
Cutback Hiols
Flow Flow To Be
Irrigated
Cobleqation Plug
- . k • .
to pipelines or with low head pumps. Outlet capacity can be increased by using larger risers, by installing multiple risers on each border, and by expanding or belling the ends of the outlets, as depicted in Fig. 1. Risers one size smaller than the main pipe are generally used because reducing saddles cost less than even-size saddles.
Although the usual procedure with border irrigation is to apply a large constant flow, cablegation can also provide cutback flows, as illustrated in Fig. 3. If the flow exceeds the capacity of one outlet, the hydraulic head will exceed the elevation of the upstream outlet(s) and water will flow from the upstream outlet(s). Cablegation cutback flow time will be 50% of the total application time if two outlets flow simultaneously, 67% (in two steps) if three outlets flow, etc. Cutback flow rates will depend on the system and supply rate, but will generally be less than half that from the downstream outlet.
RISER OUTLET CALIBRATION Procedure
Riser outlets as used on border cablegation systems were calibrated in the USDA-ARS hydraulics laboratory at Kimberly, Idaho. Figure 4 shows a schematic drawing of the riser configuration and measurement points. Flow to the horizontal conveyance pipe, Qp, was measured with a 150 mm venturi-type flow meter which had been volumetrically calibrated. Bypass flow from the end of the pipe, Qd, was regulated with a butterfly valve and measured with a propeller meter which had been calibrated with the venturi meter. Riser discharge, Q„ was calculated as Qp-Qd .
Piezometric head at points p, d and r, relative to the elevation of the riser outlet (top), was measured with water manometers. Points p and d were approximately two pipe diameters from the riser centerline. Point r was one riser diameter from the riser top. Total head was determined by adding the calculated velocity head to the piezometric head. Risers were three-to-four diameters long and one pipe size smaller than the conveyance pipe. They were attached to the main pipe with a saddle. Friction losses between pressure measurement points were generally less than 3% of the measured heads and were not considered.
Observations of the shape of the nappe discharging
Fig. 3—Border cablegation delivering cutback flows.
Fig. 4—Schematic of a belled-end riser outlet as calibrated showing head measurement points.
from the riser indicated that the head relative to the riser top required to produce a given discharge could be effectively decreased by expanding or belling out the discharge end of the riser. Although the shape of the nappe changes with discharge, the discharge characteristics did not appear too sensitive to the bell shape. Risers with a 50-mm radius outward curve at the discharge end were calibrated. The belled-end, as shown in Fig. 4, was formed on PVC pipe sections by heating the end in a 150°C oil bath until the PVC softened, then forcing it over a bell-shaped mold.
Results
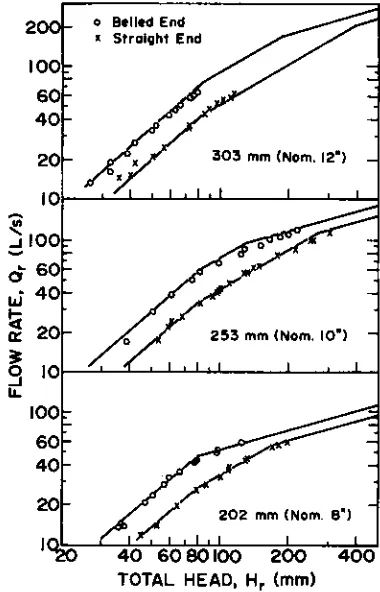
Figure 5 shows the riser discharge, Q, versus total riser head, H„ for three sizes of straight- and belled-end risers. Data for all risers follow a 1.5 slope on the log-log plot up to a head of about 80 mm. Beyond 80 mm, the slope of the relationship gradually decreases and appears to approach 0.5 at high heads. The riser outlets thus operate like weirs at low heads, then, as head increases,
TOTAL HEAD, H r. (mm)
gradually approach the operation of normal full pipe flow in which head loss is proportional to the velocity head.
The head: discharge data for H r<80 mm were fitted to the rectangular sharp-crested weir discharge equation (Bos, 1976, page 36):
Q cd(213)(2g)0.54.11.5 [1] where
Q = discharge rate (m3/s)
cd = a discharge coefficient
g = acceleration of gravity (9.81 m/s2) b = the weir width, (m)
H = the total head on the weir (m).
Substituting the riser circumference, where D r is riser pipe inside diameter, for the weir width, equation [1] becomes:
= u1 cd DrfIr l .5 [21
where u, is a constant dependent on units. Constants for three sets of alternative units are (1) 9.28 for SI consistent units with Q in m 3/s, D in m and H in m; (2) 2.93 x 10- 4 for convenient Si units with Q in liters per second (L/s), D in mm and H in mm, and (3) 1.40 for convenient English units with Q in cubic feet per second (cfs), D in inches and H in feet.
Equation 2 fit the low-head data (H r<80 mm) well when cd =0.65 for straight-end risers and c d =1.13 for belled-end risers (Fig. 5). A discharge coefficient of 0.65 is 8% larger than that recommended for fully suppressed sharp-crested rectangular weirs (Bos, 1976, page 159). Belling out the end of the riser outlet increases its capacity by 74%.
The belied-end riser is similar to a truncated form of the cylindrical-shaped, short-crested weir. The discharge coefficient for such weirs increases with the ratio of the head to the cylinder radius, R. Converted to the form of equation [1], the equivalent coefficient range is 0.64 -0.75 for .5CH/R<1.6 (i.e., 25CHC80 mm when R = 50 mm) (Bos, 1976, page 219). Since the crest length of the circular-shaped belled-end riser is actually at the Iip of the bell, it will be 314 mm (2•n-50 mm) longer than the circumference of the straight-ended riser. With this adjustment, the calibrated discharge coefficient for the belled-end risers ranged from 0.75 to 0.85 for the different riser sizes which is still somewhat larger than that for cylindrical crested weirs. This result is unexpected since the riser outlet outflow nappe is nonaerated which would decrease the discharge compared to the aerated cylindrical weir. The larger-than-expected discharge coefficient might result from the upward momentum of the water in the vertical riser or from the radial flow which will decrease the nappe thickness with distance from the lip of the bell and thus increase the slope of the nappe top water surface. Since the cylindrical weir discharge coefficient increase with H is a result of the nonaerated nappe, the constant c r, for the riser is not unexpected.
The minimum head loss possible in discharging flow from a full pipe is one velocity head. Although the data at high heads are limited, the discharge of straight-end
risers appears to approach this limit. Thus, in this high head range, the discharge for straight-end risers, is estimated by
Qr = A N/2g171r = u3Dr 2\/i-ir [3]
where A is the pipe area. In the sets of units defined for equation [2], 3.48 (consistent SO, 1.10 x 10- 4 (convenient SI) and .0438 (convenient English).
The belled-end outlet discharge at high heads appears to exceed the straight-end discharge by about 20%, implying that about 40% of the velocity head is converted to piezometric head in the expansion, or equivalently, that the effective exit diameter is about 10 q larger than the riser diameter. The projected discharge relationships at high heads are shown in Fig. 5.
In the intermediate head range, the discharge hydraulics gradually convert from weir flow, proportional to the riser circumference fi r ' 5, to full pipe flow, proportional to the riser area and Fi r". For simplicity, a linear relationship of the form:
Qr = K7rDrHr [4]
was fit to the data. The coefficient K was determined by matching the weir discharge at H r=80 mm:
ui cd Hrm l ' 5 cd Hrm0'5
QM
K • • • [5]
7TDrHr irDr HrM
where Q M is the weir flow at H im, the maximum weir flow head (80 mm). Substituting equation [5] into equation [4] yields:
Qr–ul cdHrM0.5DrHT=U7 cd Dr Hr [6]
where II, = 2.62, 0.00262, and 0.717 for consistent SI, convenient SI, and convenient English units, respectively. This relationship, plotted on Fig. 5, adequately represented the discharge data in the intermediate range. This equation is considered valid for mm until the predicted discharge exceeds that given by equation [3].
Read Loss at Riser Entrance
Vennard and Dentoni (1954) found that the entrance loss into a branching lateral varied with the size of the lateral relative to the main pipe and the portion of the flow which is diverted into the lateral. For the riser and main pipe combinations used in the calibration tests (D/D,==-0.8), the predicted entrance loss, H e, varies between 0.9 . h, and 1.0•h, for Q/Q p<.45, where hr = the upstream main pipe velocity head, and increases to about 2•h, when all the flow is diverted into the riser (Q/Q p =1). This relationship is plotted in Fig. 6 along with the collected head loss data, 1-1, Although the data are scattered due to the small measured head differences, they support the published relationship.
0 2 0.4 0.6 0.8
Or /Qp
RISER 0
RISER i-I
Fig. 6—Predicted and measured head toes at the riser entrance.
except the last (downstream) generally discharge less than half the flow in the pipe upstream of the riser. Consequently, IC, = 1 for all risers except the last one flowing. For the final riser, QE=Q, and Ke= 2.
Head Loss at Riser Bifurcation
With multiple border cablegation riser outlets flowing simultaneously, generally Q/Qp<.5 for all except the last riser. When the riser flow was less than 50% of the pipe flow, a slight increase in total head was measured in the main pipe across the flow division point (i.e., from point p to d). This agrees with the results presented by McNown (1954). The reason is that the diverted flow originates near the edge of the main pipe where the velocity, and thus velocity head, is less than the mean. For border cablegation design, this net head increase is negligible. Consequently, at each upstream riser, no net total head change is assumed to occur.
RISER
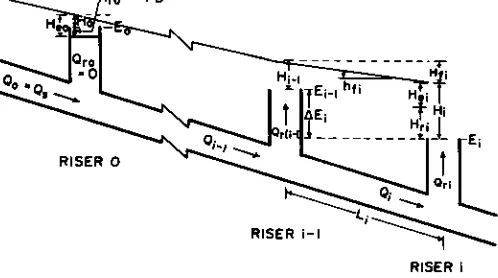
Flg. 7—Schematic of the terms used in the border cahlegation design iterative solution.
where
H1
=
the total head in the pipe relative to the riser outlet at the riser i= the total head in the pipe relative to the riser outlet at the next upstream riser, i-1
= the friction loss in the pipe between risers i-1 and i
AB, = the outlet elevation change between riser i-1 and i
Note that all heads are measured relative to the riser outlet (top) and that AE, is generally negative. Pipe friction loss rate, hi(m/m) can be calculated by an equation such as the Hazen-Williams formula (Albertson et al., 1960):
Q
i
1.85u4
D 4.865 [8]
hfi =
where QI
=
C=u4
=
BORDER CABLEGATION MODEL
To design border cablegation systems, the required elevation drop between outlets to discharge the design flow from a riser or set of risers must be determined. The elevation drop must exceed the head required to discharge the flow from the riser(s) plus the friction loss between outlets. When all flow is discharged from one riser, this head can be calculated directly as the sum of the riser head, H„ and the riser entrance loss, H,, at the given discharge rate. However, when flow is discharging from more than one riser simultaneously, an iterative solution is required. The solution is most easily accomplished by assuming a system flow rate and a head at the first upstream outlet with no discharge, and proceeding downstream calculating riser heads and discharges. Either the initial head or system flow rate is then adjusted until the sum of the riser discharges equals the total flow. Figure 7 shows a schematic with the terms used in the solution.
Total hydraulic head in the pipe at a riser relative to the riser outlet (top) is calculated by:
Hi =.Hi
-1 - Hfi - [ 7 ]
the pipe flow rate upstream of riser i
the Hazen-Williams roughness coefficient (C=140 to 150 for PVC pipe)
11.0 (consistent SI units), 1.20 x 10 10 (convenient SI), or 8.48 x 10 5 (convenient English).
The friction loss between risers is then:
Hfi hfiLi [9]
where L, is the spacing between risers i-1 and i (same units as H).
The riser head H 1, is Hi-H,, where the riser entrance loss, H,„ is:
Vi2 (42
Hei = Ke —
2 g =u5 KenD 4
where
V, = flow velocity in the pipe upstream of riser i LC, = 2.0 for the last (downstream) riser flowing and
1.0 for all other risers
0 (els)
2 3 4
1. " 1 " ' I — 345 kPa (5016.1 PIP Pipe ••
552 kPo (801b.) PIP Noe.
I 1 1
Nominal Diameter 253 mm (PO")
. •
381 mm (15")
80
▪ 70
a
-e 60 4 w 50
U 40
Cr • 3 N20
cr-
902030
40 50 60 70 8 Q, (cfs)2
0.25
020
0.15 Straight End — Belled End
2
...
a
0.10
0.05
Qs (cfs)
2 3 4
.-• Straight End — Belted End
I—
•
30 2 0 20 N WE 1 30 30 40 50 60
us = .0828 (consistent SI units), 8.28 x 10⁷ (convenient SI), or 522 (convenient English). Once Hr, is determined, the riser discharge, Q„, is calculated from equation [2], [3] or [6], depending on the value of H,. This is discharge is subtracted from Q, to determine the pipe flow rate in the next section.
Calculations begin at the first upsteam riser at which there is no discharge. The riser head, Hro, must be less than or equal to zero to prevent flow. Generally, a maximum head or freeboard, FB, is specified to allow for riser installation elevation tolerances. Thus, the maximum head in the riser will be -FB. Recall that for Qr=0,K, = 1 so the head in the pipe, Ho, is one velocity head greater than H,. (i.e., water will rise only one piezometric head in the riser). Therefore, the maximum head in the pipe at this initial riser is:
H0 = Hr + He0 = -FB+He0 [11]
Riser head and discharge calculations proceed stepwise downstream until Q7.140 (i.e., the sum of the riser discharges exceeds the system flow rate, W = 4). This determines the number of risers, N=i, required to discharge the system flow rate. The system capacity with N risers flowing can be
/
determined by increasing Q, ,
incrementally until QNQs — Qr1 + Qa + is within an allowable tolerance of zero. Alternatively, the minimum elevation drop between outlets required to discharge Q, can be determined by incrementally decreasing AE until is acceptably small.
A FORTRAN 77 computer model was written using these equations and procedures to design border cablegation systems. Copies of the program, compiled for use on IBM-compatible desk-top computers, are available from the authors. Information required to run the model includes:
1. the supply rate to the system, Q, 2. the main pipe inside diameter, Dp 3. the main pipe roughness coefficient, C 4. the riser inside diameter size, D,
5. the outlet end type (straight- or belled-end) 6. the outlet spacing, L, both between and within
borders
7. the elevation change between riser outlets, AE 8. the number of outlets (borders) which flow
simultaneously.
The model then determines the number of risers required to discharge Q,, and either the maximum capacity of the configuration, or the minimum elevation drop between outlets required to discharge Q,.
Graphical Solution
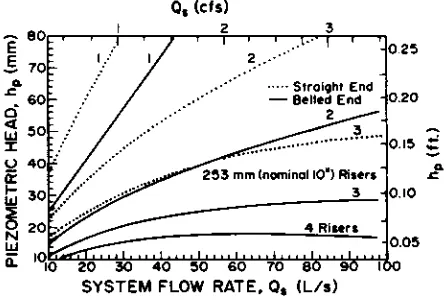
Commonly, border cablegation systems are designed to deliver water to only one border at a time (no cutback). If only one riser is used on a border or the risers are 1) grouped closely together so that friction losses between risers can be ignored, and 2) all at the same elevation, general relationships can be generated between Qs and H, for various outlet types, numbers, and pipe and outlet sizes. Figure 8 shows the friction head loss rate in commonly-used sizes of plastic pipe based on equation [8]. Figures 9 and 10 show the head required to discharge various flow rates through closely-spaced groups of straight- or belled-end riser outlets
20 40 60 80 100 120 140
FLOW RATE, 0 (-/s)
Flg. 8—Pipe friction loss rate for nominal 254-, 305- and 381-mm (10-, 12- and 15-in.) plastic irrigation pipe (C=150).
based on equations [2] and [10]. The head depicted in Figs. 9 and 10 is piezometric head in the pipe just upstream of the first flowing riser (H 1 -11„ 1 ). Thus, the sum of this head and the pipe friction loss, Elf, is equal to the minimum required elevation drop between border outlets.
Design Example
Twenty-meter wide borders are to be irrigated with 60 Us flow concentrated on one border. The field cross
SYSTEM FLOW RATE, Q, (L/s)
Fig. 9—Discharge from a group of closely-spaced 253-mm (nominal 10-in.) riser outlets vs. piezometric head in a 305-mm (12-In.)
conveyance pipe.
SYSTEM FLOW RATE, Os (Lis)
Fig. 10—Discharge from a group of closely-spaced 303-mm (nominal
12-In.) riser outlets vs. piezometric head in a 381-mm (15-112.) conveyance pipe.
.010
008
8
.006• .004
fr
.002 Lal
slope along the proposed cablegation pipe is 0.003 (0.3%) giving an average elevation drop between borders of 0.003 x 20 = 0.06 m.
From equation [8] or Fig. 8, the pipe friction loss at 60 Us in nominal 305-mm (12-in.) 349 kPa (50-lb) PIP pipe (DP = 303 mm) is .0019 x 20 m = .038 m, leaving only .060-.038=.022 m or 22 mm of head to discharge water from the outlets. Figure 9 shows that four nominal 254-mm (10 in.) belied-end risers are required to discharge 60 L/s if only 22-mm head is available. An alternative design would be to use 381-mm (15 in.) pipe and 305-mm outlets. The friction loss in 381-mm pipe (Dp = 379 mm) is .0006 m/m or .012 m in 20 m leaving 48-mm head at the riser. Figure 10 shows that two belled-end or three straight-end 305-mm outlets require 42 mm of head to discharge 60 L/s, leaving approximately 6 mm as freeboard.
A second design alternative, if adequate head is available at the inlet, would be to increase the slope on the outlets by utilizing elevated risers to allow using 305-mm pipe and only two 254-mm belled-end outlets per border. Since the two 254-mm belled outlets require 43 mm of head to discharge 60 L/s, and a minimum freeboard of 6 mm is desirable, .043 + .006 + .038 = .087 m of elevation drop is required for each 20-m border which requires an outlet grade increase from .003 to .0044. This would require extra elevation at the first riser of about 0.56 m for a 400-m long cablegation line.
Other Design Considerations
Closely spaced riser outlets, even though installed at the same elevation, will not discharge equal flows. Due to riser discharge, the downstream flow rate in the main pipe and velocity head decreases. Thus, the entrance loss for the next riser is smaller and riser head, and discharge is greater. The effect of the velocity head decrease at each succeeding riser overshadows even the influence of the larger entrance loss coefficient for the downstream-most flowing riser. For example, with three, closely spaced, equi-elevation, 305-mm (12-in.) belled-end outlets discharging 85 Us, 22%, 35% and 43% of the flow is discharged from the first, second and third risers, respectively. The relative differences increase as the system supply rate (and thus velocity head) increases. The riser discharge differences can be eliminated by compensating for the entrance loss differences with riser elevation, but this will decrease the capacity of the outlet group. The discharge differences can also be reduced by increasing the spacing between risers to increase the intervening friction loss, although friction loss at the reduced flow rate is generally small.
When equal-elevation outlets are distributed across a border, the system capacity is increased. This results from decreased friction loss since a smaller portion of the pipe length between borders is carrying the whole flow. However, if a controller which advances the plug at a constant rate is used, the outlets must be grouped together so they all begin and end flow at nearly the same time. Electronic controllers are available which can advance the plug in incremental distances.
The design calculations determine the minimum elevation drop required between outlets for a given system capacity. When all flow is discharged onto one border, elevation drops greater than the minimum do not
affect the operation. If slopes along the pipe or border widths vary, each set of outlets can be designed independently for the available elevation drop and spacing. Generally, a system can be divided into subsections on which a uniform grade and outlet configuration are used.
Outlet grade or the elevation drop between outlets determines discharge capacity. The conveyance pipe does not need to follow the outlet grade. However, the riser outlet height above the pipe determines the amount of water pressure on the plug and, when a controller which is influenced by plug pull is used, water pressure affects plug movement speed. For example, with a waterbrake controller (Kincaid, 1985), doubling the riser height, which nearly doubles the pressure on the plug, increases the plug travel speed by nearly 40%. Bury the pipe no deeper than climate and surface loading requires. This minimizes riser lengths and thus the force exerted on the plug, cable and controller.
The cablegation plug is removed at the end of the irrigation though a standpipe placed at the tailend of the cablegation pipeline. The standpipe can also serve as the last outlet. The end of the pipeline must be connected to a drain which can discharge water leakage past the plug. If the leakage is not drained, it accumulates in the tail-end of the system and exerts back pressure on the plug, reducing the force available to move the plug. Leakage is generally less than 0.5 L/s.
Due to the large flows in a concentrated area around riser outlets, soil erosion must be controlled, especially if riser outlets are elevated above the field surface. Erosion can be controlled with cobble-stone riprap placed in a shallow depression around the risers, a large tire split in half around its circumference placed around each riser, or the establishment of a permanent cover crop.
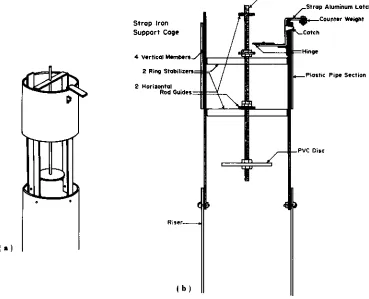
Limited field cross slope often limits the applicability of border cablegation or necessitates the use of large, more expensive pipe. Shut-off risers can reduce the outlet slope required to only the friction loss rate in the pipe. These devices automatically drop a short pipe section on the end of the riser when the plug advances to the next outlet. This effectively raises the outlet elevation, allowing the head required to disharge water to be transferred sequentially from outlet to outlet. Two types of shut-off risers have been developed. One described in USDA-ARS (1988), uses air pressure to inflate a small bladder which pushes a plunger to release a latch and drop the pipe section. The pressure is created when the plug passes and water surges into a small-diameter closed riser attached to the conveyance pipe. The small, closed riser, which is located just beyond the next downstream outlet, is connected to the shut-off riser with tubing. Thus, when the plug passes an outlet, the next upstream outlet is shut off.
Strap Aluminum Latch Counter Weight Catch
Strap iron Support Coq.
4 Vertical Members 2 Ring Stabilizers 2 Horizontal tontal
Rod Guides
Threaded Rod
PVC Disc
Riser
b )
Hinge
Plastic Pipe Section
a
Fig. 11—Border cablegation discharge activated shut-off riser. (a) Plan view (b) Cross-sectional view.
thus preventing a premature release of the latch. Both types of shut-off risers must be manually reset at the beginning of each irrigation.
DISCUSSION
Economical border cablegation systems generally require a minimum of 0.003 m/m cross slope on the outlets. This is adequate to apply 70 Us to 15-m wide borders or 100 Us to 25-m wide borders using 381-mm (15-in.) conveyance pipe and three 305-mm (12-in.) belled-end risers per border. Lack of adequate field cross slope on land which can be economically levelled for border or basin irrigation will often limit the use of border cablegation. However, as noted earlier, riser outlet slope can be increased beyond field slope by elevating the risers. For example, if 0.6 m of water supply head above the field is available at the inlet, 0.0015 m/m of extra outlet slope can be generated on a 400-m long line. When supply head is not adequate fo elevated risers, a low head pump can generate the required head with little energy consumption.
Shut-off risers greatly reduce the slope requirement of border cablegation systems and will often make border cablegation feasible. A 381-mm (15-in.) pipe with shut-off risers on a 0.0015 m/m slope will deliver 100 L/s to any width of borders. One shut-off riser will usually replace two or three conventional riser outlets, and thus may not increase system costs. However, they do introduce mechanical devices to an otherwise extremely simple system. Mechanical devices in irrigation systems increase maintenance and may decrease reliability.
The cost of border cablegation systems depends primarily on the pipe length and size. A system with 400
m of 381-mm (15-in.) conveyance pipe and three risers for each 25 m wide border on a 16-Ha square field would cost about $7,500 for conveyance pipe; $2,000 for 48 risers and saddles; $2,000 for structures and installation; and $1,000 for controller, plug and cable, totaling $12,500 or $780 per Ha (1989 prices).
Water application depths with border cablegation are determined by the system flow rate and plug movement speed. Because infiltration and roughness may vary across a field and with time, a preset application time or rate may not complete field coverage or may create excess ponding or runoff at the tail end of sloping borders. Consequently, the irrigator must revisit the field during the irrigation to observe the irrigation and make any necessary readjustments to the system. This feedback process can be easily automated on borders by using simple sensors to monitor the flow advance down the border (Humpherys and Oest, 1988). Because with cablegation, plug position and thus irrigation set changes are controlled from one location, feedback control is less expensive than with other application systems. A border cablegation feedback control system is described in USDA-ARS (1987).
SUMMARY
discharge water from the risers. The required elevation drop can be calculated or determined for the graphs presented. Cross slopes generally must exceed 0.003 m/m for economical border cablegation systems. Part of this slope can be generated by elevated risers.
References
1. Albertson, M.L., J.R. Barton and D.B. Simons. 1960. Fluid
Mechanics for Engineers. Englewood Cliffs, New Jersey: Prentice Hall.
2. Bos, M.G. 1976. Discharge measurement structures. Int'l. Institute for Land Reclamation and Improvement. Wageningen, Netherlands.
3. Humplierys, A.S. 1986. Automated farm surface irrigation systems worldwide. Int'l Commission Irrig. & Drain., New Delhi 110021.
4. Humpherys, A.S. and Ed Oest. 1988. Automated level basin irrigation field studies. ASAE Paper No. 88-2583. St. Joseph, MI: ASAE.
5. Kemper, W.D., W.H. Heinemann, D.C. Kincaid and R.V.
Worstell. 1981. Cablegation: 1. Cable controlled plugs in perforated supply pipes for automatic furrow irrigation. Transactions of the ASAE 24(6):1526-1532.
6. Kemper, W.D., D.C. Kincaid, R.C. Worstell, W.H. Heinemann, T.J. Trout and J.E. Chapman. 1985. Cablegation systems for irrigation: Description, design, installation, and performance. USDA-ARS 21, Kimberly, Idaho 83341.
7. Kemper, W.D., T.J. Trout and D.C. Kincaid 1987. Cablegation: Automated supply for surface irrigation. In Advances in
Irrigation. ed. D. Hillel. 4:1-66. Academic Press.
8. Kincaid, D.C. 1985. Cablegation: VI. The waterbrake controller. Transactions of the ASAE 28(6):1957-1960.
9. McNown, I. S. 1954. Mechanics of manifold flow. Transactions
of the ASCE 119:1103-1118.
10. Vennard, J.K. and D.W.I. Dentoni. 1954. Discussion of mechanics of manifold flow, 1.5. McNown. Transactions of the ASCE 119:1136-1140.
11. USDA-ARS. 1987. Annual cablegation update. Kimberly, Idaho 83341.
12. USDA-ARS. 1988. Annual cablegation update. Kimberly, Idaho 83341.