Ames Laboratory Publications Ames Laboratory
7-2006
Differentiating Writing Inks Using Direct Analysis
in Real Time Mass Spectrometry
Roger W. Jones
Iowa State University, [email protected]
Robert B. Cody
JEOL USA Inc.
John Frederick McClelland
Iowa State University
Follow this and additional works at:http://lib.dr.iastate.edu/ameslab_pubs
Part of theBiochemistry, Biophysics, and Structural Biology Commons,Chemistry Commons, Forensic Science and Technology Commons, and theMechanical Engineering Commons
The complete bibliographic information for this item can be found athttp://lib.dr.iastate.edu/ ameslab_pubs/239. For information on how to cite this item, please visithttp://lib.dr.iastate.edu/ howtocite.html.
Differentiating Writing Inks Using Direct Analysis in Real Time Mass
Spectrometry
Abstract
Writing ink analysis is used in establishing document authenticity and the sources and relative ages of written entries. Most analytical methods require removing samples or visibly altering the document. Nondestructive, in situ analysis of writing inks on paper without visible alteration is possible using mass spectrometry with a new ion source called Direct Analysis in Real Time. Forty-three different black and blue ballpoint, black fluid, and black gel inks were examined. Both dyes and persistent but thermally labile components of the inks contribute to the mass spectra, principally as protonated molecules [M1H]1. Numerous ink components were identified from the spectra. The spectra were placed in a searchable library, which was then challenged with two spectra from each of the 43 inks. The best match for each of the challenge spectra was correct for all but one ink, which matched with a very similar ink by the same manufacturer.
Keywords
forensic science, questioned documents, inks, mass spectrometry, ink library
Disciplines
Biochemistry, Biophysics, and Structural Biology | Chemistry | Forensic Science and Technology | Mechanical Engineering
Comments
This is the peer reviewed version of the following article:Journal of Forensic Science54 (2006): 915, which has been published in final form at http://onlinelibrary.wiley.com/doi/10.1111/j.1556-4029.2006.00162.x. This article may be used for non-commercial purposes in accordance with Wiley Terms and Conditions for self-archiving.
1
-Differentiating Writing Inks Using Direct Analysis in Real Time Mass Spectrometry
Roger W. Jones,1 Ph.D.; Robert B. Cody,2 Ph.D.; and John F. McClelland,1 Ph.D.
1Institute for Physical Research and Technology, Iowa State University, Ames, IA 50011-3020. 2JEOL USA Inc., Peabody, MA 01960.
ABSTRACT: Writing ink analysis is used in establishing document authenticity and the sources and relative ages of written entries. Most analytical methods require removing samples or visibly altering the document. Nondestructive, in situ analysis of writing inks on paper without visible alteration is possible using mass spectrometry with a new ion source called Direct Analysis in Real Time. Forty-three different black and blue ballpoint, black fluid, and black gel inks were examined. Both dyes and persistent but thermally labile components of the inks contribute to the mass spectra, principally as protonated molecules [M+H]+. Numerous ink components were identified from the spectra. The spectra were placed in a searchable library, which was then challenged with two spectra from each of the 43 inks. The best match for each of the challenge spectra was correct for all but one ink, which matched with a very similar ink by the same manufacturer.
KEYWORDS: forensic science, questioned documents, inks, mass spectrometry, ink library
Analysis of writing ink on questioned documents is often used in establishing whether a document is authentic or fraudulent, whether written entries come from a common source (same ink formula), and the relative ages of entries. This may require identification of the manufacturer and specific formula of ink. Numerous analytical methods have been used in the analysis of inks. These include thin-layer chromatography (1,2), liquid chromatography (3,4), capillary zone electrophoresis (5,6), gas chromatography (7), infrared spectroscopy (8,9), mass spectrometry (10–13), and gas chromatography–mass spectrometry (14,15). In general, these methods require cutting sample material from the questioned document or otherwise visibly altering it. In addition, they often require skilled sample preparation, and the separation techniques require substantial time to achieve the separation.
A new sampling interface for mass spectrometers called Direct Analysis in Real Time (DART) has recently been introduced (16), and it does not visibly alter the ink line being tested. DART samples any material held in its ionization stream, which is open to the environment, so no macroscopic sample needs to be cut from a questioned document for an analysis to be performed, and the appearance of the writing is not changed by the sampling process. The area sampled is 3 to 5 mm long, so individual written characters can be analyzed. DART uses a heated stream of excited and ionized helium or nitrogen to evaporate or ablate material from a sample and then ionize that material so that it may be analyzed by the mass spectrometer. We report here an initial study on applying DART mass spectrometry to the rapid, in situ analysis of writing inks on paper to assess its capability to differentiate one ink from another and thereby identify the ink as to manufacturer and formula.
2
-Methods
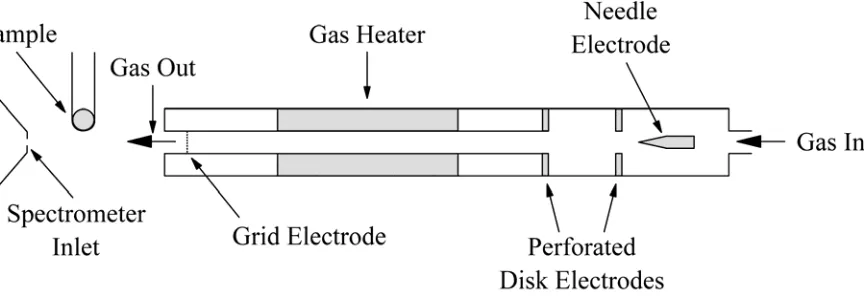
A schematic of the DART source is shown in Fig. 1. Nitrogen or helium gas is introduced into a discharge chamber in which a needle electrode is held at a potential of several kilovolts. The resulting discharge produces a plasma of ions, electrons, and excited-state species. The working species in the DART ionization process is believed to be excited-state helium atoms or nitrogen molecules. A subsequent chamber has perforated electrodes, which may be biased to remove ions. The gas is warmed in a third region that is surrounded by a heater. Gas exits the source through a grid electrode, which removes ions of the wrong polarity. The DART source aims the gas flow at the mass spectrometer inlet orifice across a 5–25 mm gap that is open to the laboratory room. The material to be analyzed is held in the gas stream within this gap. A more detailed discussion of the DART source can be found elsewhere (16).
Samples consisted of ink lines drawn freehand on Whatman 1 filter paper. Filter paper is a neutral matrix that allowed observation of the ink spectra virtually free of substrate interferences. A total of 43 inks from pens or refill cartridges purchased between 2001 and 2004 were examined. These consisted of 13 black ballpoint inks, 10 blue ballpoint inks, 10 black fluid inks, and 10 black gel inks. All of the inks had been written on paper either 11 or 16 months prior to testing, except for four black ballpoint inks, which were seven weeks old. A sliding mount with adjustable stops was used to assure reproducible positioning of the samples in the DART ionizing beam. Samples were wrapped around a 3-mm-diameter rubber cylinder, which was held perpendicular to the ionizing beam in the source-inlet gap, as shown in Fig. 1. The gap was 25 mm wide for the work reported here. Each sample was positioned so that the ink line was parallel to the cylinder axis and on the front of the cylinder protruding into the ionizing beam. The ionizing beam sampled an approximately 3-mm-long section of the ink line. When replicate samplings were taken for a specific ink, a different line was used for each sampling. Samples were handled with gloves on the day they were analyzed, but gloves were not used when the samples were written or when they were handled prior to the day of analysis. Fresh fingerprints on the samples could be detected in the DART mass spectra. Fingerprint residues consist primarily of urea, lactic acid, amino acids, fatty acids, di- and triglycerides, and squalene (17), and DART mass spectra of fingerprints are dominated by these species, detected as [M+H]+ in positive-ion mass spectra and [M–H]– in negative-ion spectra. On the other hand, blank paper
[image:4.612.96.528.81.229.2]3
-produced only a weak DART mass spectrum, so the blank background spectrum subtracted from the data presented here was acquired when the DART sampler was empty.
Samples on the mounting cylinder were quickly slid into the ionizing beam so that each sampling began at a specific point in time. Most inks produced an immediate, strong pulse of ions lasting 10–15 seconds when first placed in the ionizing beam. For ballpoint inks, this was usually followed by a less intense but relatively constant tail of ion production lasting at least 3 min. Some fluid and gel inks also produced a tail, but most did not. Ion production by the fluid and gel inks was generally less intense than from the ballpoint inks. The mass spectra shown in the figures here and used in the library analysis are 1 min averages beginning at the start of the initial ion pulse.
The mass spectrometer used was a JMS-100TLC (AccuTOF™) atmospheric pressure ionization time-of-flight mass spectrometer (JEOL USA; Peabody, MA), operated in positive-ion mode with a resolving power of greater than or equal to 6000 (full-width at half-maximum definition). For all ink measurements reported herein, the Orifice 1 potential parameter was set to 30 V, resulting in minimal fragmentation. The ring lens and Orifice 2 potential parameters were each set to 5 V. Orifice 1 was set to a temperature of 120 °C. The RF ion guide potential was set to 600 V. Data acquisition was set to acquire m/z 60-1000.
The DART ion source was operated with helium gas at a flow rate of approximately 4 L/min during active measurement. When not measuring samples, the source was purged with dry nitrogen. The gas heater was set to 325 °C. The discharge needle electrode shown in Fig. 1 was operated at 4000 V, the first (upstream) perforated disk electrode was grounded, the second perforated disk electrode was set to 50 V, and the grid electrode was set to 150 V.
Exact mass calibration was accomplished by including a mass spectrum of neat polyethylene glycol (PEG) (average molecular weight 600) in each data file. A melting point tube dipped in PEG 600 was passed in front of the DART ion source for 1–2 seconds to produce the calibration spectrum. No contamination or carryover was observed from the polymer after the melting point tube was removed.
The quality of the data allowed identities to be assigned to many individual peaks in the mass spectra. The AccuTOF instrument (JEOL USA) determines highly accurate m/z values and isotopic ratios. Although only integer mass values are given in this paper, the mass calibration was accurate to within 0.003 u. This, combined with automated matching of isotopic abundances, allowed elemental composition assignments to be made for individual peaks. DART spectra are dominated by protonated molecules, [M+H]+, so this also determined the
formula of the molecule. Unless otherwise indicated, all identified peaks are [M+H]+ species. There are often multiple theoretically possible molecular structures corresponding to a single elemental formula, but inks are simple enough mixtures that if the determined elemental composition of a peak matched that of a known ink component, the identity of the peak could be assigned with high confidence.
Centroided mass spectra were exported to the NIST Mass Spectral Search Program (Version 2.0) user interface for library creation and library search. The NIST program converted the exact mass data to integer-mass data for library search operations. The library search tests do not take advantage of either the exact-mass values or the assigned peak identities.
4
-Results and Discussion
Previous studies of the mass spectrometry of inks have examined desorbing ink directly from paper (10,11) and analyzing ink extracts by both electrospray ionization (12) and field desorption (13). Ink mass spectra produced by these methods consist primarily of cationized molecules from the ink dyes. DART sampling, too, is a relatively gentle ionization technique, and its spectra are dominated by
protonated molecules, [M+H]+, but DART
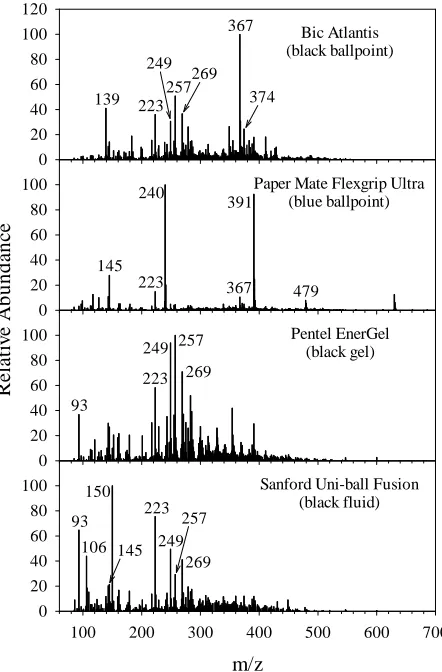
spectra are richer, with peaks from substantially more species than just the dyes. Figure 2 shows a mass spectrum for each of the four types of ink examined: black ballpoint, blue ballpoint, black gel, and black fluid. Although there is substantial variation among DART ink spectra, even for inks of the same type, the spectra in the figure show peaks typical of their ink type. The peaks at
m/z 367 and from dioctyl phthalate (m/z 391) in the Bic Atlantis and Paper Mate Flexgrip spectra, respectively, are strong peaks in many of the ballpoint spectra, but are weak or absent in all of the gel and fluid inks examined. 2-Phenoxyethanol is present in many ballpoint inks (15), and it produces a moderate [M+H]+ at m/z 139 for some ballpoints, but it is weak or absent from the fluid and gel inks, with one
exception. It is the base peak in the spectrum of Cross Porous-Point Refill, a black fluid ink. On the other hand, glycerol (m/z 93), diethanolamine (m/z 106), and triethanolamine (m/z 150) are strong or moderate in many gel and fluid ink spectra, but absent from the ballpoints. Dyes are present, but they do not necessarily dominate the spectra. The base peak of the Paper Mate Flexgrip spectrum at m/z 240 comes from the blue dye ditolylguanidine. This peak is strong for several of the blue inks examined but absent from all of the black inks. Crystal violet, a common cationic dye in black ballpoint inks, also appears in the DART spectra, but in an unusual way. The molecular cation of crystal violet has a mass of 372 u, but the dye peak in the mass spectrum is at m/z 374, corresponding to [M+2H]+. The identity of this peak was confirmed by examination of the neat, powdered dye. It produced peaks at both m/z 374 (the base peak) and
m/z 360, which corresponds to [M+2H]+ for methyl violet, a related dye cation present in the
commercial dye. A m/z 360 peak appears in the black ballpoint spectra, but it has not been marked in the figures because it is small. The spectra also contain many peaks that are observed in all types of ink. These include m/z 145 (possibly dimethyl maleate), 223 (diethyl phthalate), 249 ([C16H24O2+H]+), 257 (possibly palmitic acid), and 269 ([C18H24N2+H]+).
0 20 40 60 80 100 120 0 20 40 60 80 100 0 20 40 60 80 100 m/z
100 200 300 400 500 600 700 0 20 40 60 80 100 Bic Atlantis (black ballpoint)
Paper Mate Flexgrip Ultra (blue ballpoint)
Pentel EnerGel (black gel)
Sanford Uni-ball Fusion (black fluid) R el a ti ve A bun da nc e
139 223257 269 367 374 249 145 223 240 391 479 367 223 249 257 269 93 93 150 223 249 257 269 106 145
FIG. 2—Direct Analysis in Real Time
[image:6.612.312.533.87.423.2]5
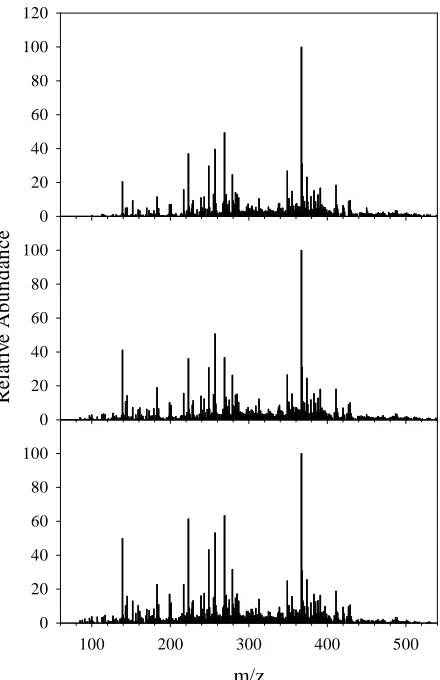
-The mass spectra are dependent on the positioning of the sample in the DART ionizing beam, so there is some variation from one spectrum to the next. Figure 3 shows three replicate spectra of the Bic Atlantis black ballpoint ink. The specific peaks present do not vary among the replicates, but the relative abundances do. Nevertheless, the same 10 peaks are the strongest 10 peaks in all three spectra and the relative abundance rankings do not change much for most of the larger peaks.
A library-search test was conducted to assess the ability of DART mass spectra to differentiate one ink from another. Two mass spectra for each of the 43 inks analyzed were placed in a library, and then each of the 86 spectra was searched against this library. Of course, because all of the spectra were in the library, each spectrum matched perfectly with itself when tested. This “Hit #0” was ignored, and the best match of a spectrum not with itself was considered the first hit, the best match. If Hit #1 was with the other spectrum entry in the library for the same ink, then the match was correct. The black fluid and gel inks and the blue ballpoint inks all produced correct matches using either the Quick Identity or Simple Similarity search option in the NIST Mass Spectral Search Program, both
in reverse mode. The Quick Identity search required that the m/z range be limited to 390 and less to produce a perfect set of matches. The black ballpoints searched best using a reverse mode Quick Identity search with no m/z limit. Under this set of parameters, all but one black ballpoint ink searched correctly. Both Bic Cristal Grip spectra matched best with one of the Bic Atlantis spectra. In each case the other Cristal Grip spectrum was the second-best match.
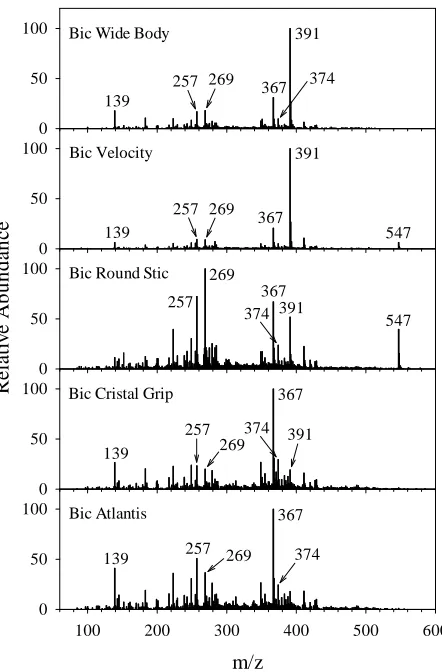
Five different black Bic ballpoint inks were included in the test set because these inks use the same dyes, and their mass spectra produced by other sampling methods are very similar (11). Figure 4 shows DART mass spectra for the five Bic inks. They divide into three distinct groups. The Atlantis and Cristal Grip ink spectra are very similar, as are the Velocity and Wide Body spectra. The Round Stic differs from both of those pairs. Apparently, the repeatability of the DART spectra was sufficient to reliably differentiate the Velocity and Wide Body inks, but it was not for the Atlantis and Cristal Grip pair. Of course, it is possible that the Atlantis and Cristal Grip inks have the same formula and so should not be distinguishable. Library-spectrum matching appears to be robust to individual peak-height variations such as those seen in Fig. 3, perhaps because of the large number of peaks present in each DART spectrum.
Re
la
ti
ve
A
b
u
n
d
an
ce
0 20 40 60 80 100 0 20 40 60 80 100 120
m/z
100 200 300 400 500
0 20 40 60 80 100
[image:7.612.311.531.85.425.2]6
-The ink lines were not visibly altered by the DART analysis. Inspection with a low-power microscope failed to show any difference between the sampled and unsampled regions of individual ink lines. Mass spectrometry using DART sampling is a quick, nondestructive method for analyzing ink in situ on questioned documents. It produces spectra of sufficient quality and diversity to distinguish all but the most similar of inks from one another.
Acknowledgements
This project was supported in part by Grant no. 2001-LT-BX-K004 awarded by the National Institute of Justice, Office of Justice Programs, U.S. Department of Justice. Points of view in this document are those of the authors and do not necessarily represent the official position or policies of the U.S. Department of Justice. The work was supported in part by the Department of Energy Office of Energy Efficiency and Renewable Energy, Industrial Technologies Program. This manuscript has been authored by Iowa State University of Science and Technology under Contract No. W-7405-ENG-82 with the U.S. Department of Energy.
References
1. American Society for Testing and Materials. E 1422-98 Standard guide for test methods for forensic writing ink comparison. Annual Book of ASTM Standards, 14.02. West Conshohocken, PA: ASTM International; 2000:545-552.
2. American Society for Testing and Materials. E 1789-96 Standard guide for writing ink identification. Annual Book of ASTM Standards, 14.02. West Conshohocken, PA: ASTM International; 2000:740-745.
3. Lyter AH III. Examination of ball pen ink by high pressure liquid chromatography. J Forensic Sci 1982;27:154-160.
4. Tebbett IR, Chen C, Fitzgerald M, Olson L. The use of HPLC with multiwavelength detection for the differentiation of non ball pen inks. J Forensic Sci 1992;37:1149-57.
0 50 100 0 50 100 R e la ti v e A bun da n ce 0 50 100 0 50 100 m/z
100 200 300 400 500 600
0 50 100
Bic Wide Body
Bic Velocity
Bic Round Stic
Bic Cristal Grip
Bic Atlantis 391 374 547 547 367 367 391 367 269 139 257 257 139 391 139 139 391 367 367 257 269 257 257 269 269 269 374 374 374
[image:8.612.312.533.86.422.2]7
-5. Fanali S, Schudel M. Some separations of black and red water-soluble fiber-tip pen inks by capillary zone electrophoresis and thin-layer chromatography. J Forensic Sci 1991;36:1192-7.
6. Zlotnick JA, Smith FP. Separation of some black rollerball pen inks by capillary electrophoresis: preliminary data. Forensic Sci Int 1998;92:269-80.
7. Aginsky VN. Some new ideas for dating ballpoint inks—A feasibility study. J Forensic Sci 1993;38:1134-50.
8. Harris J. A preliminary report on the nondestructive examination of ballpoint pen ink on questioned documents by FT-IR spectroscopy. Can Soc Forensic Sci J 1991;24:5-21.
9. Crowther D, Best M, Wohlfarth C. Analysis of nanogram spots of ink by fourier transform infrared microscopy and spectral stripping. Anal Comm 1996;33:71-3.
10. Grim DM, Siegel J, Allison J. Evaluation of desorption/ionization mass spectrometric methods in the forensic applications of the analysis of inks on paper. J Forensic Sci 2001;46:1411-20.
11. Michigan State University Department of Chemistry Searchable Pen and Dye Databases, http://poohbah.cem.msu.edu/PenInks/Pens_Main.htm.
12. Ng L-K, Lafontaine P, Brazeau L. Ballpoint pen inks: characterization by positive and negative ion-electrospray ionization mass spectrometry for the forensic examination of writing inks. J Forensic Sci 2002;47:1238-47.
13. Sakayanagi M, Komuro J, Konda Y, Watanabe K, Harigaya Y. Analysis of ballpoint pen inks by field desorption mass spectrometry. J Forensic Sci 1999;44:1204-14.
14. Wilson JD, LaPorte GM, Cantu AA. Differentiation of black gel inks using optical and chemical techniques. J Forensic Sci 2004;49:364-70.
15. LaPorte GM, Wilson JD, Cantu AA, Mancke SA, Fortunato SL. The identification of 2-phenoxyethanol in ballpoint inks using gas chromatography/mass spectrometry—Relevance to ink dating. J Forensic Sci 2004;49:155-9.
16. Cody RB, Laramée, JA, Durst HD. Versatile new ion source for the analysis of materials in open air under ambient conditions. Anal Chem 2005;77:2297-302.
17. Asano KG, Bayne CK, Horsman KM, Buchanan MV. Chemical composition of fingerprints for gender determination. J Forensic Sci 2002;47:805-7.
Additional information and reprint requests: Roger W. Jones, Ph.D.