Chemistry Publications
Chemistry
2008
Exploration of complex multilayer film growth
morphologies: STM analysis and predictive
atomistic modeling for Ag on Ag(111)
Maozhi Li
Iowa State UniversityP.-W. Chung
Iowa State UniversityE. Cox
Iowa State University
Cynthia J. Jenks
Iowa State University, [email protected]
Patricia A. Thiel
Iowa State University, [email protected]
See next page for additional authors
Follow this and additional works at:
http://lib.dr.iastate.edu/chem_pubs
Part of the
Materials Science and Engineering Commons
,
Mathematics Commons
, and the
Physical Chemistry Commons
The complete bibliographic information for this item can be found at
http://lib.dr.iastate.edu/
chem_pubs/27
. For information on how to cite this item, please visit
http://lib.dr.iastate.edu/
howtocite.html
.
This Article is brought to you for free and open access by the Chemistry at Iowa State University Digital Repository. It has been accepted for inclusion in Chemistry Publications by an authorized administrator of Iowa State University Digital Repository. For more information, please contact
Exploration of complex multilayer film growth morphologies: STM
analysis and predictive atomistic modeling for Ag on Ag(111)
Abstract
Scanning tunneling microscopy studies are integrated with development of a realistic atomistic model to both
characterize and elucidate the complex mounded morphologies formed by deposition of Ag on Ag(111) at
150 and 180 K. Threefold symmetric lateral shapes of islands and mounds are shown to reflect the influence of
a nonuniform step edge barrier inhibiting interlayer transport. Modeling of structure at the mound peaks leads
to a sensitive estimate of the magnitude of this large barrier.
Keywords
Institute of Physical Research and Technology, Ames Laboratory, Materials Science and Engineering,
Mathematics
Disciplines
Materials Science and Engineering | Mathematics | Physical Chemistry
Comments
This article is from
Physical Review B
77, no. 3 (2008): 033402, doi:
10.1103/PhysRevB.77.033402
.
Authors
Maozhi Li, P.-W. Chung, E. Cox, Cynthia J. Jenks, Patricia A. Thiel, and James W. Evans
Exploration of complex multilayer film growth morphologies: STM analysis and predictive
atomistic modeling for Ag on Ag(111)
Maozhi Li, P.-W. Chung, E. Cox, C. J. Jenks, P. A. Thiel, and J. W. Evans
Institute of Physical Research and Technology, Department of Chemistry, Department of Materials Science and Engineering, Department of Mathematics, and Ames Laboratory-U.S. DOE, Iowa State University, Ames, Iowa 50011, USA
共Received 12 October 2007; published 3 January 2008兲
Scanning tunneling microscopy studies are integrated with development of a realistic atomistic model to both characterize and elucidate the complex mounded morphologies formed by deposition of Ag on Ag共111兲at 150 and 180 K. Threefold symmetric lateral shapes of islands and mounds are shown to reflect the influence of a nonuniform step edge barrier inhibiting interlayer transport. Modeling of structure at the mound peaks leads to a sensitive estimate of the magnitude of this large barrier.
DOI:10.1103/PhysRevB.77.033402 PACS number共s兲: 68.55.A⫺, 68.37.⫺d, 68.43.Jk
Deposition drives film growth far from equilibrium and can produce an extraordinary variety of complex film morphologies.1This is the case even for strain-free homoepi-taxial growth. Limited edge diffusion generates irregular is-land shapes,2 and inhibited interlayer transport due to the presence of an Ehrlich-Schwoebel共ES兲step edge barrier pro-duces mounds 共multilayer stacks of two-dimensional is-lands兲. In the case of large ES barriers, these mounds can exhibit terraced wedding-cake-like structures reminiscent of highly eroded landscapes.1 Encoded in these complex mor-phologies are details of the underlying atomistic processes controlling growth. Furthermore, the variation of morphol-ogy with surface temperature共T兲reflects the associated en-ergetics.
A key challenge is to extract information about such pro-cesses and energetics from suitable analysis. Simple analytic modeling may extract the terrace diffusion barrier from sub-monolayer island densities at lowTand the magnitude of the ES barrier from the initial population of higher layers.1 How-ever, complete understanding of complex multilayer mor-phologies is most convincingly共but rarely兲demonstrated by successful development of predictive atomistic lattice-gas models. These should be capable of describing the growth not just for a singleT but for a range of T, potentially ex-hibiting quite different morphologies. Such model develop-ment integrated with scanning tunneling microscopy共STM兲 experiments might also reliably determine the rates or acti-vation barriers for key surface diffusion processes.3
Homoepitaxial growth of Ag on Ag共111兲 is a “classic” system which provides a prototype for rapid kinetic rough-ening involving formation of mounded morphologies and which also exhibits dramatic island shape transitions. How-ever, there are still basic unresolved issues for this growth system, so it is chosen here as a case study. Previous trans-mission electron microscopy4 and STM studies5 have re-vealed wedding-cake-like mounds for growth at 300 K. However, their lateral sizes at 300 K were so large due to rapid terrace diffusion that these morphologies were im-pacted by substrate dislocations. Other studies of this system were directed toward determination of the ES barrier, still a subject of much controversy.6 These included analyses of island decay, initial population of higher layers,6 and also diffraction studies of multilayer growth and kinetic
roughen-ing for various T below 300 K.7–9 The latter indicated so-called Poisson growth reflecting negligible interlayer trans-port due to an effectively insurmountable ES barrier: the surface roughness defined as the rms variation of film height
共in units of interlayer spacing兲satisfiesW⬇1/2for coverage in monolayers共MLs兲. TheW values smaller than1/2 re-flect downward transport, and larger values can only be achieved with upward transport between layers. Surprisingly, for Ag/Ag共111兲, there has been no systematic real-space STM investigation of multilayer growth morphologies for lower T between 100 and 200 K where expected dramatic changes in island and mound structures are not readily as-sessed from more limited diffraction data.
In this Brief Report, we present a comprehensive analysis combining both STM and realistic atomistic modeling for multilayer growth of Ag on Ag共111兲 focusing on deposition at 150 and 180 K. Kinetic Monte Carlo共KMC兲simulation of island shape behavior under judiciously selected conditions unequivocally reveals the existence and impact of a nonuni-form ES barrier. This conclusion is supported by analysis of energetics using semiempirical potentials. We find that com-plex transitions in submonolayer island shapes between 120 and 200 K are propagated into lateral shapes of multilayer mounds and that growth is Poisson-like. Our multilayer analysis focuses on the mean size of top layers of mounds which, in contrast to surface roughness W, is shown to be highly sensitive to magnitude of the ES barrier. The goal of reliable model prediction of diverse growth behavior for dif-ferentT is achieved, but it requires also accounting for the onset of reversibility in island formation in thisTregime.
Our experimental procedures are described in Ref. 10.
共ultra high vacuum system with base pressure ⬃1 ⫻10−10Torr; Ag共111兲 sample from Princeton scientific cooled with liquid nitrogen; deposition using an Omicron EFM3 evaporator with Ag flux of 0.003 ML/s; imaging of the film morphology using an Omicron VTSTM.兲Growth of Ag films on Ag共111兲 up to ⬃3 – 5 ML was monitored be-tween 120 and 200 K. Our atomistic lattice-gas model incor-porates the appropriate fcc共111兲crystal structure where steps have distinct A- and B-type structures for orientations differ-ing by 60°.1,10 Deposition at rate 0.003 ML/s accounts for downward funneling of atoms deposited right at step edges
共although this process has minimal effect for morphologies PHYSICAL REVIEW B77, 033402共2008兲
considered here with broad terraces兲. Adatoms reside at threefold hollow fcc sites in each layer and can only hop between fcc sites. We choose a common prefactor of 1011/s for both intra- and interlayer diffusions of isolated atoms and a terrace diffusion barrier of 97 meV as determined previously.1The ES barriers at portions of steps with local A-type and B-type orientations are treated as distinct free parameters. Edge diffusion parameters were chosen to re-cover submonolayer island shapes described below.10,11 The system size in our KMC simulations is⬃280⫻280 nm2.
Inhibited edge diffusion produces the following complex shape transitions of Ag islands on Ag共111兲 as observed at
⬃0.3 ML:10 dendritic shapes with triangular envelopes at ⬃120 K; fairly isotropic “fat fractals” at ⬃150 K; and dis-torted hexagons at ⬃180 K. The equilibrium island shapes are near-perfect hexagons due to almost equal A- and B-step energies,12 so the shape deviations from sixfold symmetry are purely kinetic in origin. The following observations are of key relevance for our study. At⬃120 K, atoms aggregat-ing with saggregat-ingle atoms attached to straight edges can relax to kink sites much more easily at B steps than at A steps. Thus, growth orthogonal to A steps is faster, producing the den-drites with triangular envelops aligned with B steps. This so-called “anisotropy in corner rounding共ACR兲”13 also en-sures that atoms aggregating at corners of distorted hexago-nal islands at 180 K more easily reach A steps than B steps.10 Consequently, growth controlled by ACR produces shorter A steps and longer B steps.
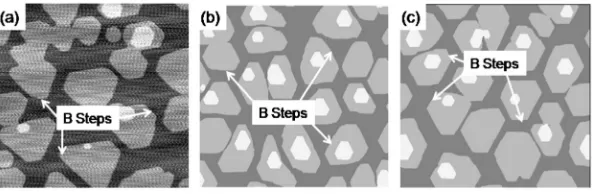
However, STM studies of deposition at 180 K with a ju-diciously selected higher coverage of 0.7 ML instead find distorted hexagonal island shapes with shorter B steps and longer A steps关see Fig.1共a兲兴.14To elucidate this observation, we simulate island growth first selecting a uniform ES bar-rier so atoms descend at A and B steps with equal probability, and interlayer transport does not tend to distort hexagonal island shapes关see Fig. 1共b兲兴. Thus, the effect of ACR pre-vails to produce shorter A steps, inconsistent with experi-ment. Then, we introduce a nonuniform ES barrier, atoms descending more easily at B steps than at A steps. Our simu-lations show that for coverages below⬃0.5 ML, islands are distorted hexagons with shorter A steps. However, at higher coverages, more atoms deposit on top of islands, and their shapes evolve from having shorter A steps to having shorter B steps. Figure1共c兲shows the simulated morphology at 0.7 ML with nonuniform ES barrier. Easier descent of atoms at B steps causes these steps to grow out faster, overwhelming the effect of ACR and producing longer A steps关Fig.1共c兲兴, con-sistent with experiment.
Our demonstration of a nonuniform ES barrier is consis-tent with semiempirical embedded atom method 共EAM兲
analysis of the interlayer transport energies. EAM is not ex-pected to predict precise values of diffusion barriers, but it generally does correctly illustrate trends. Specifically, the EAM barriers for interlayer transport at portions of steps with local B-like structure共e.g., straight B steps or kinks on A steps兲 are similar and are about 1/2 of those for local A-like structure共e.g., straight A steps or kinks on B steps兲. This reflects the feature that exchange diffusion is facile for the former but not for the latter. Thus, in contrast to common perception, kinks do not always enhance downward trans-port: for Ag on Ag共111兲, downward transport is more facile at straight B steps than at kinks on those steps.15 In our subsequent modeling, the ES barrier depends on the local step structure with a fixed ratio of 1/2 for B-like versus A-like structure, its magnitude being a free parameter.
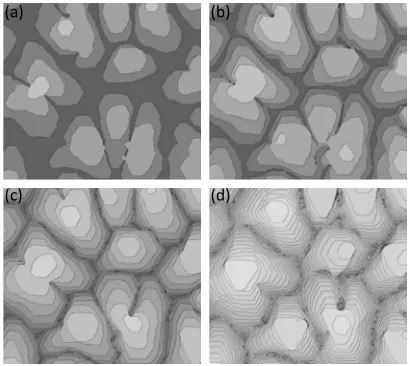
Next, we turn to the analysis of complex multilayer growth morphologies for 3 ML films. Figure2共a兲shows the fat fractal mounds grown at 150 K, and Fig. 2共d兲 shows more regular shaped mounds grown at 180 K. In both cases, W⬃1/2 follows Poisson-like growth. This motivates run-ning benchmark simulations of our atomistic model with an infinite ES barrier, which indeed produces morphologies with lateral shapes similar to experiment 关Figs. 1共c兲 and 1共f兲兴.16However, the islands or terraces forming the peaks of the mounds are much smaller than in experiment, and the side profiles of mounds are more sharply peaked. This can be understood from general considerations:1 the ES barrier is large but not infinite; it does cause atoms landing on terraces on the sides of mounds to attach to ascending steps rather than to descend; but those landing on top cannot reach an ascending step, so interrogate the descending step many times, and are likely to descend; this enhances growth of the top layer islands. Thus, the mean size of these islands, in contrast toW, should be sensitive to the ES barrier magni-tude. Simple estimates for this size have been developed as-suming circular islands and a uniform ES barrier.1However, these treatments are not readily adapted to irregular mound shapes and nonuniform ES barriers.
Fortunately, application of our atomistic lattice-gas model allows direct assessment of relevant behavior. Simulations reveal a very rapid variation of the mean size of the top layer islands with the magnitude of the ES barrier 共see below兲 potentially allowing effective determination of this magni-tude by comparison with the experimental mean size. How-ever, to be deemed reliable and predictive, the model should be able to reproduce the mean size of top layer islands mea-sured in experiments at differentTwith the samechoice of ES barrier. One complication is that the top layer size is determined not only by the ES barrier but also by the details of the nucleation process. Therefore, we first perform simu-FIG. 1. Ag islands on Ag共111兲for 0.7 ML at 180 K.共a兲STM image. KMC simulation with共b兲 uniform ES barrier of 0.1 eV and共c兲nonuniform ES barrier 共0.08 eV at B steps; 0.16 eV at A steps兲. Image sizes:⬃280⫻280 nm2. The B-step orientation is maintained in Figs.2and4.
BRIEF REPORTS PHYSICAL REVIEW B77, 033402共2008兲
[image:4.612.53.353.58.156.2]lations of our atomistic model with reversible island forma-tion allowing dimer dissociaforma-tion controlled by a bond energy of 0.24 eV, but with stable trimers 共i.e., a critical size of i= 2兲. The bond energy is taken from previous density func-tional theory 共DFT兲 analysis.17 However, we find that the magnitude of the ES barrier must be chosen at least 30% lower at 180 K than at 150 K to match experiment. This indicates that the bond energy of 0.24 eV is higher than the physical value, making nucleation on top of islands too easy at 180 K共although still more difficult that at 150 K兲.
To resolve this inconsistency, we found that by selecting a lower Ag dimer bond energy of 0.18 eV, our modeling does produce aT-independent estimate of the ES barrier magni-tude. In this case, island nucleation is highly reversible at 180 K共but still withi= 2兲and somewhat reversible at 150 K. Is this estimate of the bond energy realistic? Our recent ex-tensive plane-wave DFT studies indicate that this bond en-ergy converges unusually slowly with the size of the lateral unit cell used in the calculations. The previous high value of
⬃0.24 eV came from a typical 4⫻4 choice,17but lower con-verged values of⬃0.19 eV are achieved with a 6⫻6 cell.18 The key analysis of the variation of top layer size with ES barrier is shown in Fig.3. By comparing simulation
predic-tions with experimental values共horizontal dashed lines兲, we estimate an ES barrier of 0.085 eV for B steps by matching 150 K data 关Fig. 3共a兲兴, and a fairly consistent value of 0.075 eV by matching 180 K data 关Fig. 3共b兲兴, with double those values of 0.15– 0.17 eV for A steps. These values are based on use of a common prefactor for intra- and interlayer diffusions. They should be compared with the commonly adopted effective or average value for the ES barrier of
⬃0.13 eV 共Ref. 6兲 with the ratio of interlayer to intralayer prefactors of either close to or above unity. However, re-analysis of those earlier studies is called for given our dem-onstration and characterization of nonuniformity in the ES barrier.
To gauge the challenge and success of our modeling, it should be noted that the experimental values for the mean top layer island size共which we match兲 differ by more than an order of magnitude between 150 and 180 K. Simulated images of the morphologies of 3 ML films in Fig. 2共b兲 at 150 K and Fig.2共e兲for 180 K capture all the features of the STM images in Figs.2共a兲and2共b兲: our model matches not just only the lateral shapes and structure near the peaks of the mounds but also the average densities or lateral sizes of the mounds.
Having developed a predictive atomistic model, it can be used to explore complex morphological evolution for ex-tended film growth to higher coverages or for different T. Figure4 shows the predictions for film growth up to 20 ML at 150 K. The irregular fat fractal structure of submonolayer islands10 is replaced by more compact but still irregular mound shapes. Subsequent shapes are controlled in part by packing of mound bases to cover the substrate. Reduction of the terrace widths during growth is enforced by the Poisson-like increase in roughness and the near absence of mound coarsening. There have been extensive attempts to quantify such features from diffuse diffraction profile data, particu-larly the mean and standard deviation of the terrace width distribution共both proposed to scale like⬃−2/3at lowerT兲.9 However, those analyses were based on
quasi-one-(a) (d)
(b) (e)
(b) (e)
[image:5.612.316.557.60.250.2](c) (f)
FIG. 2.共Color online兲Comparison of 3 ML film morphologies of Ag/Ag共111兲obtained from关共a兲and共d兲兴STM and关共b兲,共c兲,共e兲, and共f兲兴KMC at关共a兲–共c兲兴150 K and关共d兲–共f兲兴180 K with关共b兲and 共e兲兴finite nonuniform and关共c兲and共f兲兴infinite ES barriers, respec-tively. Images sizes: 175⫻175 nm2for 150 K and 280⫻280 nm2 for 180 K.
FIG. 3. Dependence of mean top layer island size for 3 ML films on the magnitude of the ES barrier at B steps共1/2 of the ES barrier at A steps兲:共a兲150 K and共b兲180 K.
BRIEF REPORTS PHYSICAL REVIEW B77, 033402共2008兲
[image:5.612.58.293.61.389.2]dimensional Markovian models for film morphologies with assumed ⌫ distribution of terrace widths or on heuristic forms for oscillating height correlation functions. Direct analysis of our extended simulations as shown in Fig. 4,
indicates a slower decrease in mean terrace width closer to
⬃−1/2. In addition, previous studies of diffraction profiles at higherTindicated triangular symmetry with a preponderance of共111兲facets associated with A steps rather than共100兲 fac-ets associated with B steps.8 This feature is apparent at 180 K in our STM images 关Fig. 2共d兲兴. It is recovered in simulations with a nonuniform ES barrier关Fig.2共e兲兴but not with a uniform or infinite ES barrier.
Despite long standing interest in the Ag/Ag共111兲system as a prototype for rough multilayer growth, no comprehen-sive STM studies or realistic atomistic modeling were avail-able and uncertainty persisted regarding interlayer transport. Here, we integrate STM studies with successful development of a predictive model for complex growth morphologies be-tween 120 and 200 K. Description of growth must account for the onset of reversibility in island nucleation, complex transitions in island growth shapes, and a nonuniform ES barrier as demonstrated in this study.
This work was supported by NSF Grant No. CHE-0414376 and performed at Ames Laboratory-U.S. DOE共 op-erated under Contract No. DE-AC02-07CH11358兲. M. L. was also supported by NSF of China共10704088兲. We thank C. Ghosh for EAM analysis.
1T. Michely and J. Krug,Islands, Mounds, and Atoms共Springer,
Berlin, 2004兲; J. W. Evans, P. A. Thiel, and M. C. Bartelt, Surf. Sci. Rep. 61, 1共2006兲.
2R. Q. Hwang and M. C. Bartelt, Chem. Rev.共Washington, D.C.兲
97, 1063共1997兲.
3K. J. Caspersen, A. R. Layson, C. R. Stoldt, V. Fournee, P. A.
Thiel, and J. W. Evans, Phys. Rev. B 65, 193407共2002兲. 4K. Meinel, M. Klaua, and H. Bethge, J. Cryst. Growth 89, 447
共1988兲.
5J. Vrijmoeth, H. A. van der Vegt, J. A. Meyer, E. Vlieg, and R. J.
Behm, Phys. Rev. Lett. 72, 3843共1994兲.
6K. Bromann, H. Brune, H. Roder, and K. Kern, Phys. Rev. Lett.
75, 677共1995兲; K. Morgenstern, G. Rosenfeld, E. Laegsgaard, F. Besenbacher, and G. Comsa,ibid. 80, 556共1998兲; K. R. Roos and M. C. Tringides,ibid. 85, 1480共2000兲; 87, 149602共2001兲; J. Krug,ibid. 87, 149601共2001兲; K. Morgenstern and F. Besen-bacher, ibid. 87, 149603 共2001兲; J. Krug, P. Politi, and T. Michely, Phys. Rev. B 61, 14037共2000兲; Z. Chvoj and M. C. Tringides,ibid. 66, 035419共2002兲.
7W. C. Elliot, P. F. Miceli, T. Tse, and P. W. Stephens, Phys. Rev.
B 54, 17938共1996兲.
8Ch. Ammer, T. Schaefer, Ch. Teichert, K. Meinel, and M. Klaua,
Surf. Sci. 307-309, 570共1994兲.
9E. Z. Luo, J. Wollschlager, F. Wegner, and M. Henzler, Appl.
Phys. A: Mater. Sci. Process. 60, 19共1995兲; J. Wollschlager, E. Z. Luo, and M. Henzler, Phys. Rev. B 57, 15541 共1998兲; G.
Rosenfeld, R. Servaty, C. Teichert, B. Poelsema, and G. Comsa, Phys. Rev. Lett. 71, 895共1993兲.
10E. Cox, M. Li, P. W. Chung, C. Ghosh, T. S. Rahman, C. J. Jenks,
J. W. Evans, and P. A. Thiel, Phys. Rev. B 71, 115414共2005兲. 11Edge diffusion barriers were slightly modified from Ref.10 to
better describe observed island shapes: 0.28 共0.30 eV兲 along straight A共B兲steps; 0.28共0.33兲eV from A共B兲steps to corners; 0.08共0.13兲eV from corners to A共B兲steps; prefactor of 1013/s. 12C. Steimer, M. Giesen, L. Verheij, and H. Ibach, Phys. Rev. B 64,
085416共2001兲.
13H. Brune, H. Röder, K. Bromann, K. Kern, J. Jacobsen, P. Stoltze,
K. Jacobsen, and J. Nørskov, Surf. Sci. 349, L115共1996兲. 14Longer B steps at highTwere incorrectly reported in Ref.10. The
substrate used there at highT was reoriented by ⬃180° from that used at lowT 共cf. Fig.1兲.
15In contrast, on fcc共100兲 surfaces, kinks always facilitate
down-ward transport via exchange which is aided by rapid edge diffu-sion. EAM indicates that downward transport on Ag共111兲occurs via exchange at steps with local B-like structure共but not local A-like structure兲.
16At 180 K, these simulations actually invert the experimental
tri-angular symmetry as explained below.
17K. A. Fichthorn and M. Scheffler, Phys. Rev. Lett. 84, 5371 共2000兲.
18M. Shen, J. M. Wen, C. J. Jenks, P. A. Thiel, D. J. Liu, and J. W.
Evans, Phys. Rev. B 75, 245409共2007兲.
(a) (b)
[image:6.612.71.276.60.243.2](c) (d)
FIG. 4. Simulated morphologies at 150 K:共a兲1 ML,共b兲2 ML, 共c兲4 ML, and共d兲20 ML. Images sizes: 100⫻100 nm2.
BRIEF REPORTS PHYSICAL REVIEW B77, 033402共2008兲