149 Available online at www.ijiere.com
International Journal of Innovative and Emerging
Research in Engineering
e-ISSN: 2394 - 3343 p-ISSN: 2394 - 5494
Design of Flexible pavement by CBR method according Traffic
volume study data
Prof.Varsha Lanjewar
1, Anil patle
2, Lokesh Chawale
3, Ashwini Bhoge
4, Trupti Dharmik
5, Priyanka Ilme
6,
Rohit Kohre
7, Sudhir Atrahe
81Assistant professor, M.I.E.T. Shahapur, Bhandara,Maharashtra,[email protected] 2Research scholar, M.I.E.T. Shahapur, Bhandara,Maharashtra,[email protected]
3Research scholar, M.I.E.T. Shahapur, Bhandara,Maharashtra,[email protected] 4Research scholar, M.I.E.T. Shahapur, Bhandara,Maharashtra,[email protected] 5Research scholar, M.I.E.T. Shahapur, Bhandara,Maharashtra,truptidharmik20694@gmailcom
6Research scholar, M.I.E.T. Shahapur, Bhandara,Maharashtra,[email protected] 7Research scholar, M.I.E.T. Shahapur, Bhandara,Maharashtra,[email protected]
8Research scholar, M.I.E.T. Shahapur, Bhandara,Maharashtra,[email protected]
ABSTRACT: -
It is very important to overcome the problems of failure of flexible pavements of roads due to improper design. For the determination of bearing capacity of soil. C.B.R. Proper design of roads according to the traffic count and bearing capacity of foundation soil of road is necessary. To design flexible pavement it is necessary to determine the physical properties of soil like Optimum moisture content, maximum dry density and bearing capacity of soil To make the bituminous concrete the selection of proper grade of bitumen are essential for that grade penetration test necessary to performed. Gradation of aggregate is very essential for making bituminous concrete.
Keywords: Flexible Pavements, traffic volume study, California Bearing Ratio Value test, Gradation of aggregate.
I.INTRODUCTION
The purpose of pavements is to carry traffic safely conveniently and economically over its extended life .the pavement must provide smooth riding quality with adequate skid resistance and have adequate thickness to insure that the traffic loads are distributed over an area so that the stresses and strain at all levels in the pavements and subgrade are within the capabilities of materials at each levels. Then pavement is the actual travel surface especially made durable and serviceable to withstand the traffic load commuting upon it. Pavement grand friction for the vehicles thus providing comfort to the drivers and transfers the traffic loads from the upper surface to the natural soil. The California bearing ratio method is used for calculating bearing capacity i.e. mechanical strength of soil. In 1928 California division of highway in the U.S.A. developed CBR method for pavement design. The quantity of base course and sub-base material is properly given by California bearing ratio method. The CBR method of pavement design gives the total thickness requirement of the pavement above a subgrade. The CBR method performs on soil sample is based on the strength parameter of subgrade soil and subsequent pavement material.
II.EXPERIMENTAL PROGRAMMES
It is very important to know the different properties of soil i.e. Optimum moisture content and Maximum Dry Density test. To know the property, quality and exact proportion of aggregate it is necessary to conduct the test like Impact test, Abrasion test and Flakiness index test is performed. Similarly to know the different properties and grade of the bitumen the test like Ductility test and penetration test is performed on the Bitumen.
A. Collection of soil sample
150 B. Traffic Volume Study
It is very much necessary to calculate the total traffic before the design of pavement thickness. Vehicle travelling from roads transfer ESWL to the surface of the ground. So it is essential to calculate at what amount of vehicles travelling from particular area to be design. Traffic volume study gives idea to determine a suitable thickness of pavement for the analysis and trends of traffic the traffic volume study is very much essential. For the purpose of planning their traffic operation and for the planning and designing the existing facilities traffic volume study gives better idea. Traffic volume changes according to time to time. [1]
The methods of counting traffic volume are as follows:-
I) Mechanical counters
II) Manual count
From the above method Manual count method is used for calculating the traffic volumes.
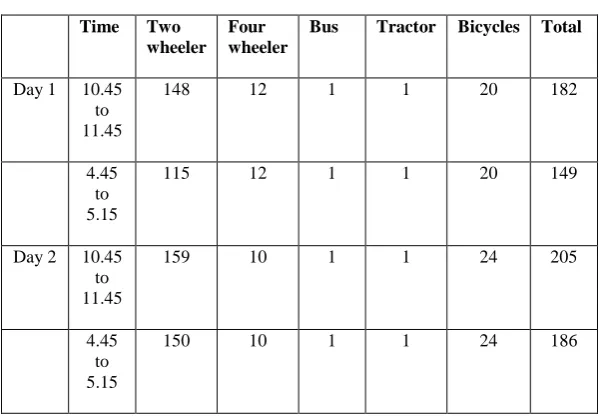
Manual count Method: - Manual counts are done by trained persons. For the manual counts of traffic volume daily peak hour is considered for a particular institute. The traffic volume may be calculated on peak hour at Incoming time and Outgoing time. For the design purpose two day traffic counting is done. The result of two day traffic is as follows
Table 1. Traffic volume data.
Time Two wheeler
Four wheeler
Bus Tractor Bicycles Total
Day 1 10.45 to 11.45
148 12 1 1 20 182
4.45 to 5.15
115 12 1 1 20 149
Day 2 10.45 to 11.45
159 10 1 1 24 205
4.45 to 5.15
150 10 1 1 24 186
From the above data of traffic volume the average traffic volume taken as 195 commercial vehicles per day.
For the design purpose the average traffic volume increased to 10 times ADT.
C. Computation of design traffic:-
The design traffic in terms of the cumulative number of standard axles to be carried during the design life of the road should be computed using the following equation, from IRC 37-2001
N=365𝑥((1+𝑟)𝑛−1)𝑥𝐴𝑥𝐷x𝐹
𝑟 ………..equation (i) Where,
N= the cumulative number of standard axles to be catered for in the design in the terms of msa.
A= initial traffic in the year of completion of construction in terms of number of commercial vehicles per day
D= lane distribution factor
151 n=design life in years
r=annual growth rate of commercial vehicles (0.075)
Calculation:-
N=365𝑥((1+0.075)10−1)𝑥1950𝑥0.75𝑥4.5 0.075
= 33.98 msa
=30 msa
D. Testing on soil sample:-
1. OMC and MDD Test.
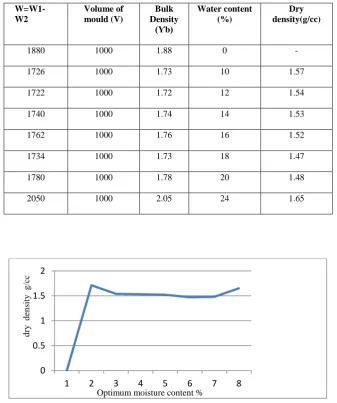
Optimum moisture content and Maximum Dry density test performed to determine the moisture content for the CBR test. Optimum Moisture content is the water content at which maximum dry density. For the design of new roads as per the IRC recommendation the subgrade soil sample should be compacted at OMC to proctor density whenever suitable compaction equipment is available to achieve this density in the field. Maximum Dry Density is the peak dry unit weight. The observation table for OMC and MDD are as follows
Table 2. Observation table of OMC and MDD test.
Figure1.Graph of OMC and MDD.
From the above graph the result of OMC and MDD test are as follow 0
0.5 1 1.5 2
1 2 3 4 5 6 7 8
d
ry
d
en
sity
g
/cc
Optimum moisture content %
W=W1-W2
Volume of mould (V)
Bulk Density
(Ƴb)
Water content (%)
Dry density(g/cc)
1880 1000 1.88 0 -
152 Table 3.Result of OMC and MDD.
Table 4. Result of CBR test
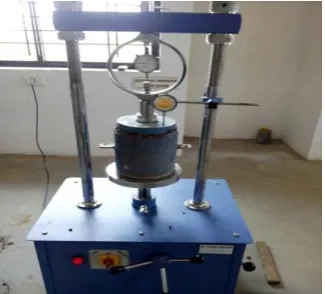
2. CBR TEST
California Bearing Ratio is the ratios of force per unit area required for penetrate into the soil mass with circular plunger of 50 mm diameter at the rate of 1.25mm/min. The CBR value is recorded at 2.5 mm and 5mm penetration. By using average CBR value and traffic count in msa referred CBR design chart (recommended by IRC) Gives depths of construction. [2]
Figure 2.California bearing ratio test.
Average CBR Value for 2.5 mm = (2.61+2.69+2.47)/3 = 2.59 %
Average CBR Value for 5 mm = (2.04+2.18+2.09)/3 = 2.10 %
The average CBR Value = 2.35 is taken as 3%
For 3% CBR value and Traffic volume of 30 msa referring IRC37-2012 gives different Crust thickness.
Test Results
1) OMC 10%
2) MDD 1.57g/cc
Sr.no .
Penetratio n(mm)
Load (kg) Load on plunger (kg/cm2) = Load/area of plunger
Standard Load
CBR value (%) = Load on plunger *100/standard load
Sample 1 Sample 2 Sample 3
Sample 1
Sample 2
Sample 3
Sampl e 1
Sample 2 Sample 3
1 2.5 36 37 34 1.83 1.88 1.73 70 2.61 2.69 2.47
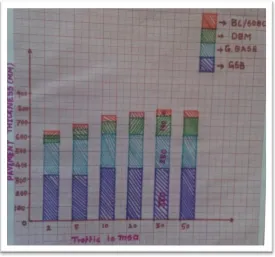
153 Figure 3.Graph of pavement thickness as per IRC 37-2012.
From Graph,
Thicknesses of different crust of flexible pavement are as follows:-
Granular Sub-base = 380 mm.
Granular base = 250 mm.
Dense bituminous macadam = 140 mm.
Bituminous concrete = 40 mm.
Figure 4.Different crust thickness as per IRC 37-2012
Soil Subgrade layer: - The soil subgrade is a layer of natural soil prepared to receive the other layers of the pavement. The load of pavements are ultimately supported by the soil subgrade and dispersed to the earth mass below.
Sub-base course:-It is layer of selected granular soil, stabilized soil or gravels, boulders ,broken stones ,bricks etc. the main purpose of providing sub-base layer is to permit the building of relatively thick pavement at low cost.
Base course:-It is the foundation layer, designed for its structural stability. The main function of the base course in flexible pavement is to improve the load supporting capacity by distributing the load through s finite thickness.
Bituminous concrete (40 mm)
Dense bituminous macadam (140mm)
Base course (250mm)
154 Dense Bituminous macadam: - It is the binder course used for roads with more number of heavy commercial vehicles. In dense bituminous macadam mix there is a wide scope for varying the gradation to obtain a good mix without affecting the durability of pavement.
Wearing course:-It is that component of pavement with which the wheels of vehicles are in actual contact. The main purpose of wearing course is to provide smooth and dense riding surface that resist the pressure exerted by tyres.
For design of bituminous concrete surface gradation of aggregate is important.
E. TEST ON AGGREGATE:-
1. IMPACT TEST:-
This test used to know the toughness of an aggregate and maximum impact value for wearing surfaces is 30%.
Take oven dried sample of an aggregate passing from 12.5 mm IS sieve and retained on 10 mm IS sieve (A).
After than filled the mould in three layers by tamping each layer 25 times and fixed the mould on impact testing machine by giving 25 blows.
Then sieve the sample by 2.36 mm IS sieve therefore wt. Retained on this sieve taken as B.
Impact value = 𝒘𝒕.𝒓𝒆𝒕𝒂𝒊𝒏𝒆𝒅 𝒐𝒏 𝟐.𝟑𝟔𝒎𝒎 𝒔𝒊𝒆𝒗𝒆 𝒘𝒕.𝒓𝒆𝒕𝒂𝒊𝒏𝒆𝒅 𝒐𝒏 𝟏𝟎 𝒎𝒎 𝒔𝒊𝒆𝒗𝒆 ∗ 𝟏𝟎𝟎
Wt. retained on 2.36 mm sieve =50 gm.
Wt. retained on 10 mm sieve = 415 gm.
Impact value = 50
415∗ 100
= 12.05 %
Figure.5 Impact Test
2. ABRASION TEST
:-This test is used to determine the abrasion value of an aggregate and maximum permissible value for wearing surface is 30%.The abrasive charge shall consist of cast iron spheres or steel spheres approximately 48 mm in diameter and each weight between 390 and 445 gm. The test samples consist of clean aggregate which has been dried in an oven at 1050c to
1100c.then no. of charge applied according to selected grade. The revolution per min given according to selected grade.
155 Figure 6: Abrasion value Test
Weight of gm. of saturated surface dry sample (A) = 5000gm
Weight of gm. of friction passing through 1.70 mm IS sieve (B) = 940 gm. Aggregate Abrasion Value = B/A x 100
= 940/5000 x 100
= 18.8 %
F. GRADATION OF AGGREGATE:-
The gradation of aggregate is very much essential for fixing the proper proportion of aggregate for bituminous concrete surface. The gradation of aggregate is done by trial method. Due to the proper gradation of aggregate the well graded aggregate is selected improves strength of surface course also improves resistance to absorption of water. [3]
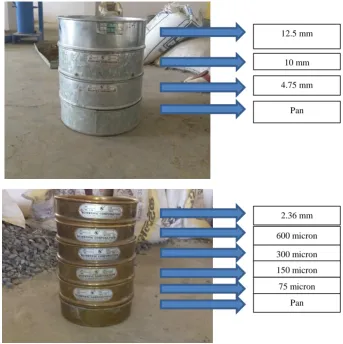
Figure7. Sieve arrangment for gradation test
Result of Gradation Test:- the gradation of aggregate is done by trial and error method.
TRIAL 1:-Table 5 Gradation of aggregate by 15% 10 mm aggregate and 85% 6mm aggregate.
2.36 mm 600 micron 300 micron 12.5 mm
10 mm
4.75 mm
Pan
150 micron 75 micron
156
TRIAL2:-Table 6 Gradation of aggregate by 18% 10 mm aggregate and 82% 6mm aggregate.
TRIAL3:- Table 7 Gradation of aggregate by 20% 10 mm aggregate and 80% 6mm aggregate.
From the above trials, the proportion of aggregate for bituminous concrete surface is found to be 20% aggregate of 10 mm and 80% aggregate of 6mm.
G. TEST ON BITUMEN:-
For the selection of proper grade of bitumen test on it is very essential to know its properties. Bitumen is available in a different grades and qualities. To know the suitability of binders various physical test have been specified by agencies like ASTM, Asphalt Institute, and ISI. For classifying bitumen and studying the performance of bituminous pavement the penetration and ductility test are essential. The penetration test determines the hardness or softness of bitumen by measuring depth of penetration in tenth of millimeter. In the flexible pavements construction where bitumen binder is used, it is important that the binders form ductile thin films around the aggregates. Binder improving the physical interlocking of aggregate bituminous mixes.
Sieve size
mm Wt. retained
Percentage of wt. retained
Cumulative % passing
Grade 1
20 - - - -
12.5 0 0 100 100
10 0.40 8 92 80-100
4.75 1.10 23.91 76.09 55-75 2.36 1.18 33.71 66.29 35-50 0.6 1.107 47.71 52.29 18-29 0.3 0.21 17.31 82.69 13-23 0.150 0.08 7.97 92.03 8-16 0.075 0.085 9.2 90.8 4-10
Sieve size
Mm Wt. retained
Percentage of wt. retained
Cumulative % passing
Grade 1
20 - - - -
12.5 0 0 100 100
10 0.45 9 91 80-100
4.75 1.15 25.27 74.73 55-75 2.36 1.29 37.94 62.06 35-50 0.6 1.209 57.29 42.71 18-29 0.3 0.51 56.60 43.40 13-23 0.150 0.1 25.57 74.43 8-16 0.075 0.095 32.64 67.36 4-10
Sieve size
Mm Wt. retained
Percentage of wt. retained
Cumulative % passing
Grade 1
20 - - - -
12.5 0 0 100 100
10 0.5 10 90 80-100
157 1. PENETRATION TEST: -
The sample of bitumen is maintained at 25oc.the bitumen is softened at sufficient softening point then poured into the
mould. The sample container is kept in water bath at 25oc for an hour. Three penetrations are made on this sample 10 mm
apart.by considering average penetration value the grade of bitumen is decided. The results of penetration test are as follows.
Table 8.Penetration test result
Penetration dial reading Test 1 Test 2 Test 3
Initial 0 0 0
Final 62 61 65
Penetration value 62 61 65
Figure 8.Penetration test apparatus
The average penetration value = (62+61+65)/3= 62.67mm =63 mm.
The average value of penetration test lies in between 60 to 70 hence the grade of bitumen is 60/70.
2. DUCTILITY TEST: -
It is test give ductility value of bitumen. The binder material which does not possess sufficient ductility would crack and thus provide pervious pavement surface. The test is believed measured the adhesive property of bitumen and its ability to stretch. The result of ductility test is as follows.
Figure 9. Briquette mould with sample.
The ductility value varies from 5 to over 100 cm for different grades of bitumen. The ISI specified minimum Ductility value of 75cm for the bitumen of grade 45 and above.
From the test, Ductility value =78 cm.
158 III. CONCLUSION
1) The less quantity of material is used for the construction of flexible pavement is saving huge quantity of money i.e. Economical.
2) The crust thickness is depending on the CBR value i.e. higher the CBR value lower is the thickness of pavement.
3) The CBR value of subgrade is improved by soil stabilization. 4) To select well graded aggregate proper gradation is important.
5) For selecting proper grade of bitumen penetration and ductility test is performed which determine physical properties of bitumen sample.
IV. REFERENCES
[1] Khanna S.K., Justo C.E.G. “Highway Engineering”, published by Nem Chand & Bros, Civil Lines, Roorkee 247667, India. Ninth Edition (2011):
[2] Khanna S.K., Justo C.E.G. “Highway Engineering”, published by Nem Chand & Bros, Civil Lines, Roorkee 247667, India. Ninth Edition (2011)
[3] Khanna S.K., Justo C.E.G. “Highway Engineering” , published by Nem Chand & Bros, Civil Lines, Roorkee 247667, India. Ninth Edition (2011)
[4] Equation (i) From IRC 37-2001 THE INDIAN ROADS CONGRESS (2001):“Guidelines for the Design of Flexible Pavements (second Revision)
[5] Khanna S.K., Justo C.E.G. “Highway Engineering” published by Nem Chand & Bros, Civil Lines, Roorkee 247667, India. Ninth Edition (2011)
[6] INDIAN ROAD CONGRESS (2012):-“Tentative Guidelines for the Design Of flexible pavements”