88 Research note
Study of Parameters Affecting Size Distribution of Beads Produced
from Electro-Spray of High Viscous Liquids
H. Moghadam, M. Samimi, A. Samimi∗ and M. Khorram
Chemical Engineering Department, University of Sistan and Baluchestan, Zahedan, Iran.
Abstract
Electro-Hydrodynamics (EHD) spray is an important process in many engineering operations such as ink-jet printing, spray drying and atomization (liquid jet in air), dispersion and emulsification (liquid jet in liquid). In this work the method of electro-spray was employed to form droplets from a high viscous sodium-alginate solution using constant DC voltage. The droplets were cured in calcium chloride solution to produce solid beads. The main objective was to extend the knowledge of EHD spray to high viscous and non-Newtonian liquids (1000-5000 mPa.s). However, the effects of electric field strength, nozzle diameter, flow rate and concentration of liquid were specifically investigated on the size of the beads. Among the parameters studied, voltage had a pronounced effect on the size of the beads as compared to the flow rate, the nozzle diameter and the concentration of alginate liquid. The size of beads was reduced to a minimum value by increasing the voltage in the range of 0-10 kV. However, within the middle part of this range, an unstable transition occurred from the dripping mode to the jet mode where the size distribution was wide. Increasing the height of fall of the droplets improved the sphericity of the beads, because of the increase of flight time for the droplets to relax before gelation.
Keywords: Electro-spray, Non-Newtonian and viscid liquids, Constant DC voltage, Alginate beads, Size distribution
∗ Corresponding author: [email protected]
1- Introduction
Electro-spray of liquids is a physical process in which the electric field is applied to the surface of a liquid capillary. The electrical force applies shear stress along with gravitational force on the liquid, leading to elongation and consequently separation of the droplet from the capillary. The idea of using an electric field between a capillary tip
ink-Iranian Journal of Chemical Engineering, Vol. 6, No. 3 89
jet printing, spray drying and atomization (liquid jet in air), dispersion and emulsification (liquid jet in liquid). The Electro-spray would reduce the size of the droplets further than the conventional mechanical atomizers in some cases, even to less than 1 μm depending on the process variables and liquid properties [2].
The number of works classifying the mechanisms of Electro-Hydro-Dynamics (EHD) spray is scanty ([3-7]), and do not include all phenomena in EHD spray. This is especially the case for highly viscous and non-Newtonian liquids, where the classical mechanisms of a cone jet or laminar jet break ups may not describe the EHD spraying process. The laminar jet break up may produce large drops for highly viscous liquids and suspensions leading to irregular jet break up and therefore wide size distribution of droplets. The break up of a liquid jet generally occurs by the propagation and growth of the waves along the jet axis inducing the formation and separation of droplets from the jet tip. In this mechanism, the wave leaving the nozzle moves down the stream along the jet whilst its amplitude grows and, as a result of which the liquid jet breaks up. For invicid liquid, Lord Rayleigh (1878/1879) presented a theory in which the instability of a laminar jet and its wavelength was related to the jet diameter. Using a linearised stability analysis, Rayleigh showed that a jet broke up when the developed wavelengths were greater than the circumference of the jet. Weber [8] extended Rayleigh’s theory to viscid liquids. He showed that the optimum wavelength for the jet break up also depended directly on viscosity, and inversely on the density and
surface tension of the liquid. When an axisymmetric disturbance of a frequency is imposed on a laminar jet, a liquid cylinder of one wavelength long may form one droplet, where the optimum frequency of droplet formation may be correlated by material properties of the surface tension, density and viscosity as well as process variables of the volumetric flow rate of liquid in the nozzle and nozzle diameter [9]. However, almost all of the above works have been concentrated on low viscosity liquids.
90 Iranian Journal of Chemical Engineering, Vol. 6, No. 3
cases the concentrations over 2 w/v% have not been used due to the viscid and non-Newtonian behavior of the alginate solution. The viscosity of alginate liquid varies in the range of 1000-5000 mPa.s, even more up to 25000 mPa.s, depending on its concentration [11]. At the higher concentrations (i.e. 3 w/v %), the jet break up may lead to spindle or oval shapes with visco-elastic characteristics. In this case, the relaxation of the droplets before curing may cause the formation of more spherical droplets [11].
The main aim of this paper is to study the parameters affecting the size and shape of beads produced from the electro-spray of high viscous and non-Newtonian alginate solutions. In this context, the effects of constant DC voltage, nozzle diameter, flow rate, and concentration of sodium alginate on the size of the cured beads are investigated under the two modes of dripping and jet. This study extends the EHD investigations to the higher range of a liquid’s viscosity where the liquid may behave differently.
2. Material and methods
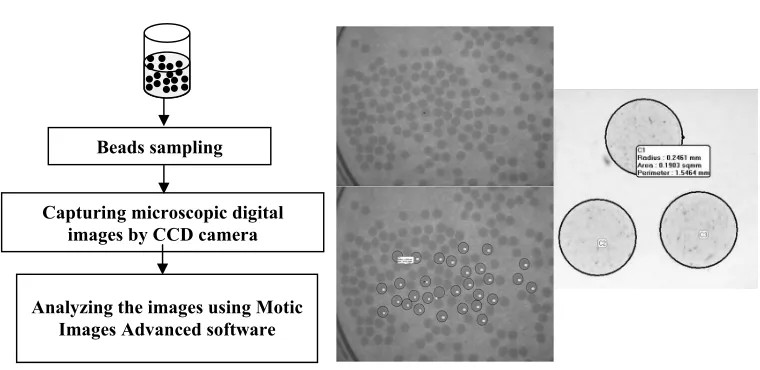
Sodium alginate from Sigma-Aldrich and calcium chloride from Merck were used to prepare 2-3 w/v % alginate and gelling agent solutions, respectively. All experiments were carried out at room temperature, about 27°C. The experimental set up is shown in Fig. 1. In the experiments the highly viscous alginate liquid was pumped into a nozzle using a syringe pump. The nozzle was charged to a high DC voltage while the counter electrode disc was earthed. The sodium alginate droplets dripped into a container of gelling agent of calcium chloride where the calcium alginate beads were
formed by gently mixing the system for about 15 minutes. To investigate the effect of the relaxation time of droplets on the sphericity of the produced beads, the distance between the nozzle’s tip and the container was adjusted by increasing the vertical height of the pump/nozzle setup. The size and shape analyses of the beads were carried out by analyzing the digital images captured by a CCD camera installed on a microscope, using Motic Images Advanced software.
Fig. 2 shows the steps of study after electro-spraying, including the images captured by microscope and CCD camera for image analysis. A large number of beads was assessed for the size analysis to obtain the mean size and its distribution using equivalent projected area diameter.
Iranian Journal of Chemical Engineering, Vol. 6, No. 3 91 Beads sampling
Analyzing the images using Motic Images Advanced software Capturing microscopic digital
images by CCD camera
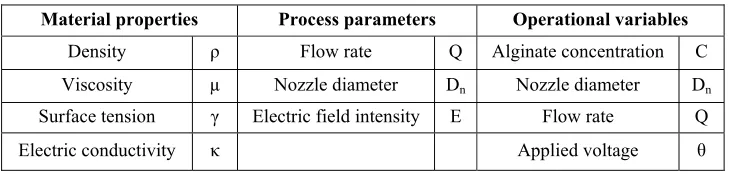
Table 1 shows the material properties, process parameters and operational variables
considered in the experiments and modeling.
Figure 1. Experimental apparatus
92 Iranian Journal of Chemical Engineering, Vol. 6, No. 3
Table 1. Nomenclature
Material properties Process parameters Operational variables
Density ρ Flow rate Q Alginate concentration C
Viscosity µ Nozzle diameter Dn Nozzle diameter Dn
Surface tension γ Electric field intensity E Flow rate Q
Electric conductivity κ Applied voltage θ
Table 2 represents the set up values for the operational variables in each test level. Each test level was carried out at 8 voltages, collecting 8 samples for the size analysis. A combination of 3 levels, 3 operational parameters of concentration, nozzle diameter and flow rate, and 8 voltages led to at least 56 experiments. Each experiment was repeated 3 times and the results were averaged to obtain reliable results, therefore, in total about 170 samples of beads were collected.
3. Result and discussion
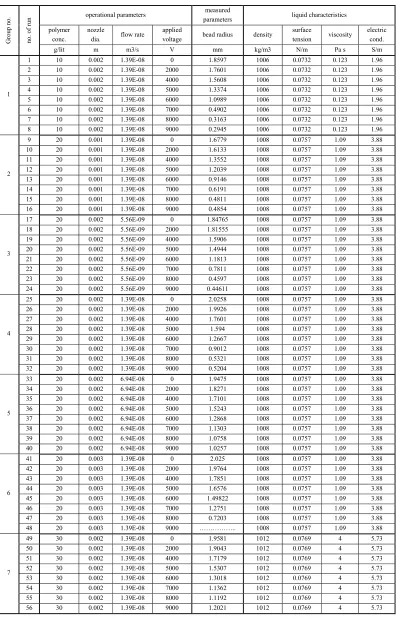
Table 3 represents all experiments showing the effects of concentration, nozzle diameter and flow rate on the measured size of the bead’s size at different voltages.
3.1- Effect of voltage on bead size
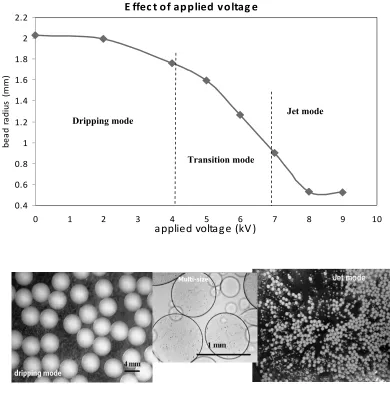
The effect of voltage on bead size was investigated, as shown in Fig. 3. The figure illustrates the representative test runs of 25-32 in Table 3. It is clear from the figure as
well as the images of particles that increasing the applied voltage leads to the reduction of the size of the beads to an almost minimum value. In the early stages of voltage increase (i.e. up to about 4 kV), where the rate of size reduction was relatively low, the dripping mode dominated. However, within a certain range of voltage (i.e. about 4-7 kV), the size reduction sped up with voltage. In this range, a transition from the dripping mode to the jet mode occurred and the frequency of the droplets formation increased faster while the size reduced. In the middle part of this range, where none of the spraying modes dominated, an unstable fluctuation between the dripping and the jet modes was observed causing a wide size distribution of beads. The voltage corresponding to the minimum size of the beads is termed as critical voltage (i.e. about 8 kV). Three regions of dripping, transition and jet modes of spraying are also shown in the figure. A similar trend was observed for the other test runs.
Table 2: Operational variables considered in the experiments
Effect of concentration Effect of nozzle diameter Effect of flow rate
C (g/lit) Dn (mm) Q
(ml/hr) C (g/lit) Dn (mm) Q
(ml/hr) C (g/lit) Dn (mm)
Q (ml/hr) 10 2 50 20 1 50 20 2 20
Iranian Journal of Chemical Engineering, Vol. 6, No. 3 93 Table 3. Results of all experiments at different levels and operational conditions.
operational parameters measured
parameters liquid characteristics polymer
conc.
nozzle
dia. flow rate
applied
voltage bead radius density
surface
tension viscosity
electric cond.
Grou
p no
.
no
. of ru
n
g/lit m m3/s V mm kg/m3 N/m Pa s S/m
1 10 0.002 1.39E-08 0 1.8597 1006 0.0732 0.123 1.96
2 10 0.002 1.39E-08 2000 1.7601 1006 0.0732 0.123 1.96
3 10 0.002 1.39E-08 4000 1.5608 1006 0.0732 0.123 1.96
4 10 0.002 1.39E-08 5000 1.3374 1006 0.0732 0.123 1.96
5 10 0.002 1.39E-08 6000 1.0989 1006 0.0732 0.123 1.96
6 10 0.002 1.39E-08 7000 0.4902 1006 0.0732 0.123 1.96
7 10 0.002 1.39E-08 8000 0.3163 1006 0.0732 0.123 1.96
1
8 10 0.002 1.39E-08 9000 0.2945 1006 0.0732 0.123 1.96
9 20 0.001 1.39E-08 0 1.6779 1008 0.0757 1.09 3.88
10 20 0.001 1.39E-08 2000 1.6133 1008 0.0757 1.09 3.88
11 20 0.001 1.39E-08 4000 1.3552 1008 0.0757 1.09 3.88
12 20 0.001 1.39E-08 5000 1.2039 1008 0.0757 1.09 3.88
13 20 0.001 1.39E-08 6000 0.9146 1008 0.0757 1.09 3.88
14 20 0.001 1.39E-08 7000 0.6191 1008 0.0757 1.09 3.88
15 20 0.001 1.39E-08 8000 0.4811 1008 0.0757 1.09 3.88
2
16 20 0.001 1.39E-08 9000 0.4854 1008 0.0757 1.09 3.88
17 20 0.002 5.56E-09 0 1.84765 1008 0.0757 1.09 3.88
18 20 0.002 5.56E-09 2000 1.81555 1008 0.0757 1.09 3.88
19 20 0.002 5.56E-09 4000 1.5906 1008 0.0757 1.09 3.88
20 20 0.002 5.56E-09 5000 1.4944 1008 0.0757 1.09 3.88
21 20 0.002 5.56E-09 6000 1.1813 1008 0.0757 1.09 3.88
22 20 0.002 5.56E-09 7000 0.7811 1008 0.0757 1.09 3.88
23 20 0.002 5.56E-09 8000 0.4597 1008 0.0757 1.09 3.88
3
24 20 0.002 5.56E-09 9000 0.44611 1008 0.0757 1.09 3.88
25 20 0.002 1.39E-08 0 2.0258 1008 0.0757 1.09 3.88
26 20 0.002 1.39E-08 2000 1.9926 1008 0.0757 1.09 3.88
27 20 0.002 1.39E-08 4000 1.7601 1008 0.0757 1.09 3.88
28 20 0.002 1.39E-08 5000 1.594 1008 0.0757 1.09 3.88
29 20 0.002 1.39E-08 6000 1.2667 1008 0.0757 1.09 3.88
30 20 0.002 1.39E-08 7000 0.9012 1008 0.0757 1.09 3.88
31 20 0.002 1.39E-08 8000 0.5321 1008 0.0757 1.09 3.88
4
32 20 0.002 1.39E-08 9000 0.5204 1008 0.0757 1.09 3.88
33 20 0.002 6.94E-08 0 1.9475 1008 0.0757 1.09 3.88
34 20 0.002 6.94E-08 2000 1.8271 1008 0.0757 1.09 3.88
35 20 0.002 6.94E-08 4000 1.7101 1008 0.0757 1.09 3.88
36 20 0.002 6.94E-08 5000 1.5243 1008 0.0757 1.09 3.88
37 20 0.002 6.94E-08 6000 1.2868 1008 0.0757 1.09 3.88
38 20 0.002 6.94E-08 7000 1.1303 1008 0.0757 1.09 3.88
39 20 0.002 6.94E-08 8000 1.0758 1008 0.0757 1.09 3.88
5
40 20 0.002 6.94E-08 9000 1.0257 1008 0.0757 1.09 3.88
41 20 0.003 1.39E-08 0 2.025 1008 0.0757 1.09 3.88
42 20 0.003 1.39E-08 2000 1.9764 1008 0.0757 1.09 3.88
43 20 0.003 1.39E-08 4000 1.7851 1008 0.0757 1.09 3.88
44 20 0.003 1.39E-08 5000 1.6576 1008 0.0757 1.09 3.88
45 20 0.003 1.39E-08 6000 1.49822 1008 0.0757 1.09 3.88
46 20 0.003 1.39E-08 7000 1.2751 1008 0.0757 1.09 3.88
47 20 0.003 1.39E-08 8000 0.7203 1008 0.0757 1.09 3.88
6
48 20 0.003 1.39E-08 9000 ……….. 1008 0.0757 1.09 3.88
49 30 0.002 1.39E-08 0 1.9581 1012 0.0769 4 5.73
50 30 0.002 1.39E-08 2000 1.9043 1012 0.0769 4 5.73
51 30 0.002 1.39E-08 4000 1.7179 1012 0.0769 4 5.73
52 30 0.002 1.39E-08 5000 1.5307 1012 0.0769 4 5.73
53 30 0.002 1.39E-08 6000 1.3018 1012 0.0769 4 5.73
54 30 0.002 1.39E-08 7000 1.1362 1012 0.0769 4 5.73
55 30 0.002 1.39E-08 8000 1.1192 1012 0.0769 4 5.73
7
94 Iranian Journal of Chemical Engineering, Vol. 6, No. 3
Figure 3. Effect of applied voltage on size of beads (the test runs of 25-32), and images of beads in three zones of dripping, transition and jet modes.
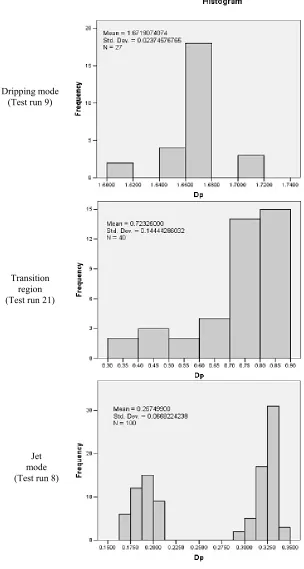
Fig. 4 represents differential size analysis as histograms of the number of beads frequency in the dripping, transition and jet modes. Considering the mean size range of standard deviation of each mode, the figure reveals an almost mono-size distribution in dripping mode (1.672+0.024 mm), wide size distribution in the transition region (0.723+
0.144 mm) and bimodal size distribution in the jet mode (0.268 + 0.067).
3.2- Effects of concentration, nozzle’s diameter and flow rate
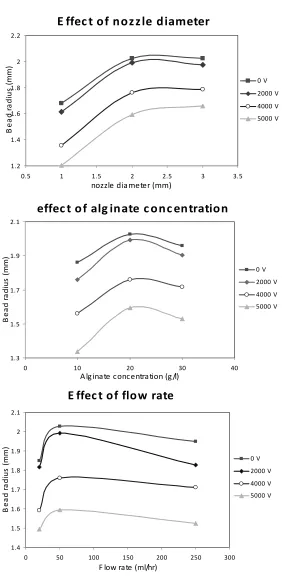
The 3 effects of the nozzle’s diameter, alginate concentration, and flow rate on bead size are shown in Fig. 5.
E ffec t of applied voltag e
0.4 0.6 0.8 1 1.2 1.4 1.6 1.8 2 2.2
0 1 2 3 4 5 6 7 8 9 10
applied voltage (kV )
be
a
d
ra
d
iu
s
(m
m
)
Dripping mode
Transition mode
Iranian Journal of Chemical Engineering, Vol. 6, No. 3 95 Figure 4. Number of beads differential size distribution in three regions of dripping, transition and jet.
Dripping mode (Test run 9)
Transition region (Test run 21)
96 Iranian Journal of Chemical Engineering, Vol. 6, No. 3
Figure 5. Three effects of nozzle’s diameter, alginate concentration and liquid flow rate on beads size, all investigated at different voltages.
E ffec t
of
noz z le
diameter
1.2 1.4 1.6 1.8 2 2.2
0.5 1 1.5 2 2.5 3 3.5
nozzle diameter (mm)
Be
a
d
ra
di
us
(mm)
0 V
2000 V
4000 V
5000 V
effec t
of
alg inate
c onc entration
1.3 1.5 1.7 1.9 2.1
0 10 20 30 40
A lginate concentration (g/l)
Be
a
d
ra
dius
(mm) 0 V
2000 V
4000 V
5000 V
E ffec t
of flow
rate
1.4 1.5 1.6 1.7 1.8 1.9 2 2.1
0 50 100 150 200 250 300
F low rate (ml/hr)
Be
a
d
ra
di
us
(mm) 0 V
2000 V
4000 V
Iranian Journal of Chemical Engineering, Vol. 6, No. 3 97
The effect of nozzle diameter on the size of the beads has been obtained by comparison of group tests of 2, 4 and 6 in Table 3. Fig. 5a represents the variations of beads average size as a function of nozzle diameter at different voltages, but at constant alginate concentration and constant flow rate of 20 gpl and 50 ml/h, respectively. As seen, increasing the nozzle diameter generally increases the beads’ average size. However, for the larger nozzles (2 and 3 mm), the inside diameter has little or no effect.
The effect of the alginate concentration is shown in Fig. 5b by plotting the group tests data of 1, 3 and 7 from Table 3. The results represent an initial increase in the bead size with concentration increase from 10 to 20 gpl and then a slight size reduction from 20 to 30 gpl. In general, increasing the concentration may lead to an increase of density, viscosity, surface tension and electric conductivity (Table 3). However, enhancement of the mentioned parameters may cause different effects on the size of the beads (i.e. density and electric conductivity have an opposite relation with size, while surface tension and viscosity behave directly). A combination of
these effects may lead to the observed trends in Fig. 5b.
The effect of flow rate could be investigated by comparison of the group test data of 3, 4 and 5 as shown in Fig. 5c. The figure illustrates an initial increase in bead size with flow rate (i.e. from 20 to 50 ml/h). However, the size is reduced when the flow rate increases five times from 50 to 250 ml/h. This could be due to two different reasons. In low flow rates the dripping mode of the spray may dominate (20 to 50 ml/h) where increasing the flow rate increases the droplets size. However, with a further increase of the flow rate a transition may occur from dripping to jet by which the frequency of the droplets increases while the size is decreased (i.e. from 50 to 250 ml/h). Furthermore, alginate solution is a shear-thinning fluid [10], in which viscosity decrease with increasing the flow rate.
3.3- Effect of relaxation time of droplets
Fig. 6 illustrates the images showing the effect of relaxation time on the beads sphericity.
Figure 6. Effect of relaxation time on sphericity of beads. Distance between nozzle tip and gelling agent container (a) 30 cm (b) 1 m (c) 2 m (d) 3 m. (applied voltage = 7 kV, nozzle diameter = 1 mm, flow rate = 50 ml/hr and sodium alginate concentration 30 gpl).
a b
98 Iranian Journal of Chemical Engineering, Vol. 6, No. 3
This was achieved by increasing the flight time of the droplets before curing in calcium chloride solution. The figure reveals that increasing the relaxation time improves the sphericity of the beads. The appropriate relaxation time was provided by increasing the vertical height between the nozzle tip and the calcium chloride container from 0.30 m to 3.00 m.
4. Conclusion
This study extended the EHD-spray investigations to the higher range of liquid viscosity, where the liquids behaved complicatedly. Sodium alginate used in this study is an appropriate model solution for EHD and drug release investigations. It shows a non-Newtonian and viscid behavior in the concentration range of 10-30 gpl. The effects of material properties (electric conductivity, density, viscosity and surface tension) and process variables (voltage, flow rate and nozzle diameter) were investigated on produced calcium alginate beads. Mono size distribution of the beads was achieved at certain ranges of voltage where a single mode of dripping dominated. In the transition zone a fluctuation between dripping and jet modes was observed, leading to a wide size distribution of droplets. Among the process variables and material properties studied, voltage was the main parameter affecting the bead size. More investigation is currently being carried out to model the EHD-spray of the process for such high viscous fluids.
References
1. Bon, K.K. and Sang, S.K. “Electrospray characteristics of highly viscous liquids” J.
Aerosol Sci., 33, 1361 (2002).
2. Jaworek, A. and Krupa, A. “Classification of the modes of EHD spraying” J. Aerosol Sci., 30(7), 873 (1999).
3. Hayati, I., Bailey, A.I., and Tardos, Th.F. “Investigation into the mechanisms of electrohydrodynamics spraying of liquids” J.
Collid Interface, 117(1), 205 (1987).
4. Cloupeau, M. and Prunet-Foch, B. “Electrospraying of liquids. Main functioning modes” J. Electrostatics, 25,165 (1990). 5. Grace, J.M. and Marijnissen, J.C.M. “A review
of liquid atomization by electrical means” J.
Aerosol Sci., 25(6), 1005 (1994).
6. Grigorev, A.I. and Shiryaeva, S.O. “The theoretical consideration of physical regularities of electrostatic dispersion of liquids as aerosols”, J. Aerosol Sci. 25(6), 1079 (1994).
7. Shiryaeva, S.O. and Grigorev, A.I. “The semiphenomenological classification of the modes of electrostatic dispersion of liquids”.
J. Electrostatic, 34(1), 51 (1995).
8. Weber, C., “Zum zerfall eines flussigkeits-strahles”, Z Angew Math Mech, (2), 136(1931).
9. Brandenberger, H. and Widmer, F., “A new multinozzle encapsulation /immobilisation system to produce uniform beads of alginate”,
J. Biotechnology, 63, 73 (1998).
10. Speranza, A. Electro-hydrodynamic spraying of highly conductive and viscous liquids, PhD thesis, University of Surrey (2002).