Research Article
Feeding practices for captive greater kudus (
Tragelaphus strepsiceros
) in
UK collections as compared to diets of free-ranging specimens
Lucy A. Taylor1,*, Christoph Schwitzer1, Norman Owen-Smith2, Michael Kreuzer3 and Marcus Clauss4 1Bristol Conservation and Science Foundation, c/o Bristol Zoo Gardens, Clifton, Bristol BS8 3HA, United Kingdom
2Centre for African Ecology, School of Animal, Plant and Environmental Sciences, University of the Witwatersrand, Wits 2050, South Africa 3Institute of Agricultural Sciences, ETH Zurich, Universitätsstrasse 2, 8092 Zurich, Switzerland
4Clinic for Zoo Animals, Exotic Pets and Wildlife, Vetsuisse Faculty, University of Zurich, Winterthurerstr. 260, 8057 Zurich, Switzerland
*Corresponding author: [email protected]
Keywords:
greater kudu, antelope, nutrition, feed-ing, lucerne hay, crude protein Article history:
Received: 23 March 2012 Accepted: 25 February 2013 Published online: 24 July 2013
Abstract
Diet-related disorders occur frequently in captive browsing ruminants. To assess current feeding practices, diets of 15 captive greater kudus (Tragelaphus strepsiceros) from three zoological collec-tions were compared to that of free-ranging conspecifics and current feeding recommendacollec-tions. Dry matter intake (DMI) varied considerably in captivity from 49.2 to 75.7 g dry matter kg BM-0.75 d-1. Roughage intake determined DMI; with a low DMI associated with low body condition scores (BCS). Compared to free-ranging kudus with diets of 11.1-14.2% crude protein (CP), only one collection had a diet with a similar CP concentration (13.0%), the other collections providing diets with CP of 15.1-16.8%. Acid detergent fibre (ADF) in the zoo diets was comparable to that in the diet of free-ranging animals (24.7-29.4%), but the latter consumed diets with less cellulose and more lignin. In addition, faecal consistency scores (FS) were positively correlated with dietary CP and faecal nitrogen, and negatively with faecal ADF, indicating that higher proportions of highly digestible feeds caused softer faeces. In total, only four of fifteen captive individuals had normal BCS 3.0 and FS 1.0. These results suggest that diets fed to captive browsing ruminants are too digestible, even in terms of fibre compo-sition. Recommendations for higher CP may be unnecessary. Providing browse and high quality lu-cerne hay may increase the proportion of roughages in the diet and overall DMI to meet require-ments and recommendations. To balance the diet and reduce digestibility, the pellets should have lower levels of CP, starch and sugar, and a higher level of fibre, particularly lignin.
OPE
N A
C
CE
SS
Introduction
Browsing ruminants are often considered challenging to main-tain in captivity and display a high prevalence of diet-related disorders and poor body condition (Clauss et al. 2003; Clauss and Dierenfeld, 2008). In the wild, browsers consume the leaves and twigs of woody plants and forbs, as well as seeds and wild fruits. Generally, browse is higher in crude protein (CP = nitrogen × 6.25) and easily fermentable pectins, and lower in overall fibre, compared to grass (Hummel et al. 2006); there-fore high CP diets of up to 21% CP were historically recom-mended for captive browsing ruminants (Fowler 1978; Lintzen-ich and Ward 1997). However, browse contains more nonpro-teinacious nitrogen bound to, or in, plant secondary metabo-lites (PSM) and lignin, which could increase the calculated CP content of browse without increasing available CP; therefore browse probably contains lower levels of available CP than would be expected from its CP concentration (Robbins et al.
1987; Hanley et al. 1992; Conklin-Brittain et al. 1999). In addi-tion, logistical difficulties with providing browse, and the low acceptance of hay in captivity, have led to the relative oversup-ply of highly digestible feeds to browsing species, such as com-mercial fruits and cereal-based pellets (Clauss et al. 2003). Such diet items are high in sugars and starch, which can cause
rumi-nal acidosis and a number of other diet-related disorders (Potter and Clauss 2005; Clauss and Dierenfeld 2008; Colville et al. 2009; Schwitzer et al. 2009) and can have serious implica-tions on captive animal health, welfare and longevity and, con-sequently, conservation strategies for endangered species (Barber 2009; Müller et al. 2011). For captive giraffes (Giraffa camelopardalis), it is now recommended to reduce the level of CP, sugars and starch, and to increase the content of fibre in the diet (Schmidt and Barbiers 2005; Hummel and Clauss 2006). There is, so far, no reason why these recommendations could not be transferred to other browsing species. Neverthe-less, data on the diet selection and nutrient intake of species in the wild is often missing; therefore dietary formulation in cap-tivity is afflicted with a degree of uncertainty (Bond 2001; Wright et al. 2011).
Greater kudus (Tragelaphus strepsiceros) are browsing ruminants found through much of eastern and southern Africa. The feeding ecology of free-ranging greater kudus has been researched extensively, including research into diet selection (Owen-Smith and Cooper 1987; Owen-Smith 1994; de Garine-Wichatitsky et al. 2004; Hooimeijer et al. 2005; Codron et al.
2007a) and estimations of nutrient and energy intake (Owen-Smith and Cooper 1989; Owen-(Owen-Smith 1997). Comparing the diet of captive greater kudus to their free-ranging counterparts
JZ
AR R
es
ea
rch
Ar
ti
cl
Taylor et al.
could highlight existing problems in captive feeding practices to help reduce the putative incidence of diet-related disorders. Therefore, the aim of this study was to assess the current feeding practices for captive greater kudus by comparing the dietary and faecal nutrient composition between captive and free-ranging greater kudus and the current feeding recommendations for captive browsing rumi-nants.
Methods
Captive greater kudus
The research was conducted following the methods described for captive tapirs (Clauss et al. 2009). Fifteen greater kudus from three zoological collections in the United Kingdom were assessed during November 2010. The body mass (BM) of each animal was estimated by keeper and researcher assessment, together with a photographic comparison to free-ranging greater kudus, and to the other greater kudus in this study. Each animal was assigned a faecal consistency score (FS) calculated from the mean score of all observed defeca-tions of the respective individual (Table 1; Figure 1), and a body condition score (BCS) (Table 2).
Food intake was measured over a consecutive 3-day period by weighing individual food items offered and subtracting the mass of the food not consumed on a daily basis. At zoo A, meadow hay was available in a mixed species exhibit; thus hay intake was estimated by observations and by weighing representative samples of hay that replicated the observed amounts of hay ingested by kudus. The animals at zoos B and C had access to grass pasture; grass ingestion could not be measured in this study. In all zoos, samples were taken of pelleted feeds, forages, browse and faeces. Pellet and hay sam-ples were stored in paper bags. Browse and faeces were stored in sealed plastic bags and frozen.
Both feed and faecal samples were dried at 60°C for 48 h and then milled in a Retsch mill with a 0.5 mm sieve (Retsch, Haan, Ger-many). Dry matter (DM) and total ash were determined with a TGA-500 furnace (Leco Corporation, St. Joseph, MI, USA; AOAC, 1997, no. 942.05) heated at steps of 105°C and 550°C, respectively. The con-tent of CP was determined as nitrogen × 6.25 on a C/N analyzer (Leco-Analysator Typ FP-2000, Leco Instrumente GmbH, Kirchheim, Germany) (AOAC no. 977.02). Neutral detergent fibre (NDF, with addition of α-amylase and without sodium sulfite), acid detergent fibre (ADF) and acid detergent lignin (ADL) were determined follow-ing Van Soest et al. (1991) by using the Fibertec apparatus (Fibertec System M, Tecator, 1020 Hot Extraction, Flawil, Switzerland). All fibre values are expressed without residual ash. As in Clauss et al.
(2009), fat content was estimated, on a DM basis, as 4% in browse, 2% in hay, and, for manufactured feeds, the fat value was obtained from the feed packaging. Nutrient contents of fruits and vegetables were obtained from ZOOTRITION™ software (version 2.6, Saint Louis Zoo, MO, USA).
Cellulose was calculated as ADF-ADL, non-ADF-carbohydrates (NadfC% DM) were calculated as 100-CP-fat-ash-ADF; and non-fibre carbohydrates (NFC% DM), where fibre is equal to NDF, were calcu-lated as 100-CP-fat-ash-NDF. The metaboliable energy (ME) content of the diet was estimated from the nutrient composition using calcu-lations by Pellew (1984) for estimating the energy intake of free-ranging giraffe as follows:
Gross energy (GE MJ/kg DM) = 0.0226 CP (g/kg DM) + 0.0407 fat (g/kg DM) + 0.0192 ADF (g/kg DM) + 0.0177 NadfC (g/kg DM)
Metabolizable energy (ME MJ/kg DM) = 0.447 × GE. FS Description
1.0 Firm, individual pellets; cylindrical in shape with a point at one end (~15-20mm long)
1.5 Softer rounder pellets
2.0 Soft pellets, larger in size and beginning to stick together 3.0 Firm faecal mass. All pellets clumped together, with a range of
pellet sizes.
4.0 Soft faecal mass, with little form. 5.0 Fluid
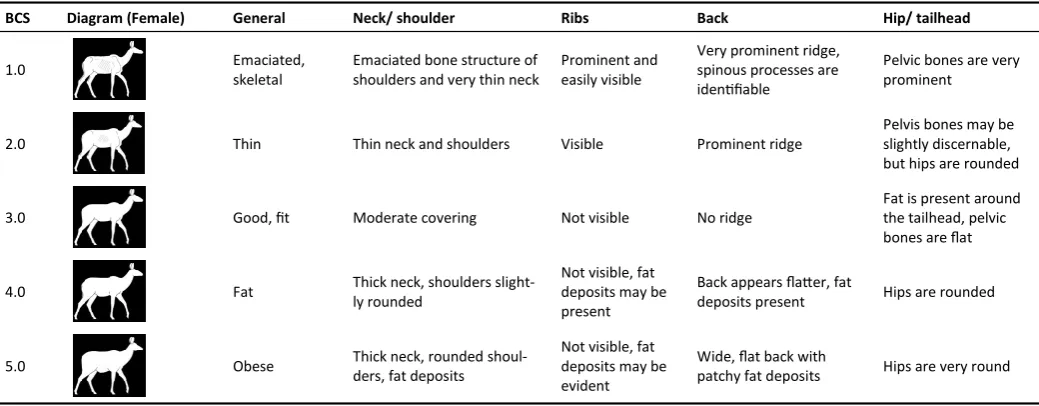
BCS Diagram (Female) General Neck/ shoulder Ribs Back Hip/ tailhead
1.0 Emaciated,
skeletal
Emaciated bone structure of shoulders and very thin neck
Prominent and easily visible
Very prominent ridge, spinous processes are identifiable
Pelvic bones are very prominent
2.0 Thin Thin neck and shoulders Visible Prominent ridge
Pelvis bones may be slightly discernable, but hips are rounded
3.0 Good, fit Moderate covering Not visible No ridge
Fat is present around the tailhead, pelvic bones are flat
4.0 Fat Thick neck, shoulders
slight-ly rounded
Not visible, fat deposits may be present
Back appears flatter, fat
deposits present Hips are rounded
5.0 Obese Thick neck, rounded
shoul-ders, fat deposits
Not visible, fat deposits may be evident
Wide, flat back with
patchy fat deposits Hips are very round
Table 2. Body condition score (BCS) chart for captive greater kudu developed for this study, with the aid of Riney (1960), Clauss et al. (2009) and Disney’s Animal Kingdom (2005).
Normal BCS is 3.0.
FS 1.0 FS 1.5
FS 2.0 FS 3.0 FS 4.0
Figure 1. Examples of faecal consistency scores for captive greater kudu.
Table 1. Faecal consistency score (FS) chart for captive greater kudu developed for this
The proportional consumption of food, nutrients and ME by each individual in the group was presented on the basis of the calcu-lated metabolic body mass (BM, kg0.75).
Free-ranging greater kudus
The BSC and FS of free-ranging greater kudus were assumed to be normal for this species at 3.0 and 1.0, respectively. Dietary nutrient concentrations were estimated from data collected by Owen-Smith and Cooper (1989), who followed four free-ranging subadult greater kudus for one year and recorded the food intake of three different individuals, from dawn to dusk, on three days each month. For each plant consumed, the time spent foraging was multiplied by the eating rate (g DM per minute, from the product of bite size and biting rate) to estimate the DM intake of each plant. The dietary concentrations of CP, cellulose and ADL in DM were then calculated from the chemical composition of each plant species. The results were split into a mean for the dry season, using the data from June until September, and the wet season from November until April, according to the seasonal notes presented in Owen-Smith and Cooper (1989). For faecal N, ADF and ADL, the data from Codron et al. (2007b) was used as comparison. Cellulose was calculated as described above.
Zoo diet evaluation
The zoo diets were evaluated by comparing the dietary and faecal nutrient concentrations to those of free-ranging greater kudus, and to the feeding recommendations of Lintzenich and Ward (1997; recalculated to a DM basis), for medium to large browsers, and Schmidt and Barbiers (2005) and Hummel and Clauss (2006), for captive giraffes. Lucerne hay quality was assessed according to the quality standards of the American Forage and Grassland Council, from high “prime quality” hay, followed by “quality 1” hay down to low “quality 4” hay, using CP and NDF proportions in the DM of the lucerne hay (Baylor and Rohweder 1979). The ME intake of the cap-tive greater kudus was compared to the estimated maintenance ME requirements of captive mammals, calculated using the allometric equation for the basal metabolic rate of 0.293 MJ kg BM-0.75 day-1, multiplied by factors of 1.5 and 2.0, to give a maintenance require-ment of 0.44-0.59 MJ ME kg BM-0.75 d-1 (Kirkwood 1996). Spearman’s rank correlation coefficient was used to test for a correlation be-tween the dietary and faecal nutrient concentrations, and bebe-tween BCS or FS and the dietary and/or faecal nutrients, using IBM® SPSS® Statistics 19 software (SPSS Inc. Chicago, IL). Associations between
BCS and the intake of nutrients (g kg BM-0.75 day-1) were tested by correlation analysis, because overall intake affects BCS; similarly, associations between FS and the concentrations of nutrients in DM were tested for, because diet composition affects FS. The signifi-cance level was set to p<0.05.
Results
The mean BCS at zoo A was 3.0±0.0 (mean ± standard deviation), at zoo B 2.7±0.4 and at zoo C 3.3±0.3. Eight of 15 animals scored nor-mal BCS 3.0, with three aninor-mals at zoo B below, and four aninor-mals at zoo C above, this value (Table 3). The mean FS at zoo A was 1.04±0.06, at zoo B 2.0±1.1 and at zoo C 2.5±1.1. One animal could not be assessed for FS at zoo B. Only one of 14 individuals assessed for FS achieved a mean FS of 1.0. Four individuals, including both animals at zoo A and two non-lactating females at zoo B, scored BCS 3.0 and had a mean FS lower than 1.5.
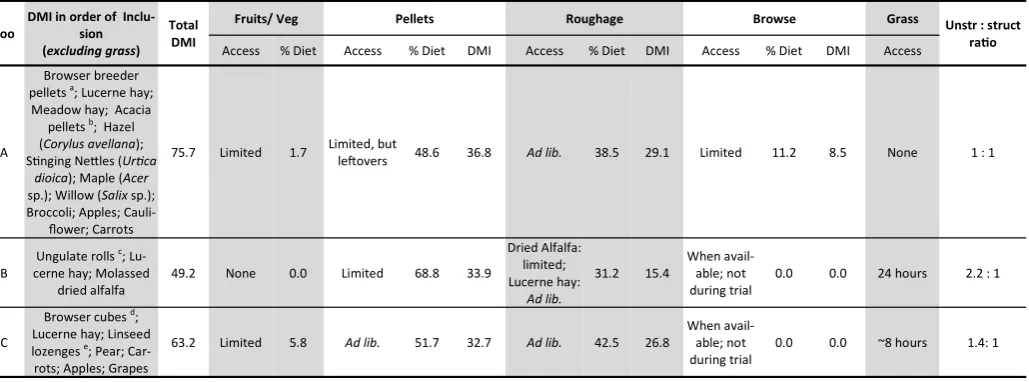
Dry matter intake (DMI), excluding grass, ranged from 49.2 g DM kg BM-0.75 d-1 at zoo B to 75.7 g DM kg BM-0.75 d-1 at zoo A (Table 4). All collections provided pelleted feed and lucerne hay at ad libitum
access. The DMI from pellets was relatively consistent across all collections. When two types of pellets were offered, the pellets were mixed in a pre-defined ratio. No selection bias was observed between pellets during this study.
Zoo Animal Type BM (kg) BCS FS
A 1 2 Adult female Adult female 180 3.0 1.08 170 3.0 1.00
B
1 Adult female 170 3.0 1.25 2 Adult female 150 2.5 2.67
3 Adult female 150 3.0 -*
4 Adult female 150 3.0 1.25 5 Lactating female 160 2.0 4.00 6 Subadult male 100 3.0 1.50
7 Juvenile 40 2.5 1.50
C
1 Adult male 230 3.0 2.50
2 Adult female 190 3.5 1.75 3 Lactating female 190 3.0 4.25 4 Lactating female 180 3.5 3.25
5 Juvenile 60 3.5 1.25
6 Juvenile 50 3.5 1.75
Zoo
DMI in order of Inclu-sion (excluding grass)
Total DMI
Fruits/ Veg Pellets Roughage Browse Grass Unstr : struct
ratio
Access % Diet Access % Diet DMI Access % Diet DMI Access % Diet DMI Access
A
Browser breeder pellets a; Lucerne hay; Meadow hay; Acacia
pellets b; Hazel (Corylus avellana); Stinging Nettles (Urtica
dioica); Maple (Acer
sp.); Willow (Salix sp.); Broccoli; Apples;
Cauli-flower; Carrots
75.7 Limited 1.7 Limited, but
leftovers 48.6 36.8 Ad lib. 38.5 29.1 Limited 11.2 8.5 None 1 : 1
B
Ungulate rolls c; Lu-cerne hay; Molassed
dried alfalfa
49.2 None 0.0 Limited 68.8 33.9
Dried Alfalfa: limited; Lucerne hay:
Ad lib.
31.2 15.4
When avail-able; not during trial
0.0 0.0 24 hours 2.2 : 1
C
Browser cubes d; Lucerne hay; Linseed lozenges e; Pear; Car-rots; Apples; Grapes
63.2 Limited 5.8 Ad lib. 51.7 32.7 Ad lib. 42.5 26.8
When avail-able; not during trial
0.0 0.0 ~8 hours 1.4: 1
Main ingredients in order of inclusion:
a. Browser breeder pellets: Oat hulls and bran, soya bean hulls, dehulled extracted toasted soya, lucerne meal, molasses, wheat, dextrose monohydrate;
b. Acacia pellets: Acacia sp., Hominy chop, molasses meal, yellow maize, lucerne, soya oilcake, cotton oilcake, sunflower oilcake;
c. Ungulate rolls: Barley, wheatfeed, wheat, molaferm 20 mollases bulk, calcium cabonate, oat pellets, sunflower ext, blended vegetable oil;
d. Browser cubes: Grass, unmolassed sugar beet, wheat, dehulled soya bean meal, soya hulls, oatfeed, full fat linseed;
e. Linseed lozenges: Linseed expeller, glucose syrup.
Table 4. Dietary composition, excluding grass, of the captive greater kudus at each collection in terms of dry matter intake (DMI = g DM kg BM-0.75 d-1). Unstructured food includes
fruit/ vegetables and pellets and structured food includes roughage and browse.
*Faeces could not be accurately identified, but appeared to be FS 1.5
Table 3. Group composition at each zoological collection, including body mass (BM),
None of the collections applied a ratio of 30-40% pellets to 60-70% roughage and browse, as recommended by Lintzenich and Ward (1997), but zoo A just attained the recommendations of Hum-mel and Clauss (2006), of a maximum of 50% unstructured food (fruit/veg and pellets), at 50.4%. The DMI of lucerne hay increased as hay quality increased, but none of the collections fed “prime qual-ity” lucerne hay as recommended by Lintzenich and Ward (1997) (Figure 2). The intake of meadow hay at zoo A, which was in a day-time mixed species exhibit, was affected by the dominance of the other species in the exhibit. With the inclusion of meadow hay and medium quality lucerne hay, the animals at zoo A had a higher
roughage intake than the animals at zoo C with high quality lucerne hay (29.1 compared to 26.8 g DM kg BM-0.75 d-1). In addition, zoo A
was the only collection that provided seasonal browse on a daily basis, which increased the total DMI and meant zoo A had an overall roughage and browse intake of 37.6 g compared to the lowest roughage intake of 15.4 g DM kg BM-0.75 d-1 at zoo B. Commercial fruits and vegetables were fed on a daily basis to the animals at zoo C; at zoo A, apples and carrots were only fed as part of the twice-weekly training program, and broccoli and cauliflower were fed as enrichment 2-3 times a week, alternating with stinging nettles (Urtica dioica); no fruits or vegetables were fed at zoo B. The animals
with access to grass pasture at zoos B and C were observed grazing, but grass consumption could not be quantified.
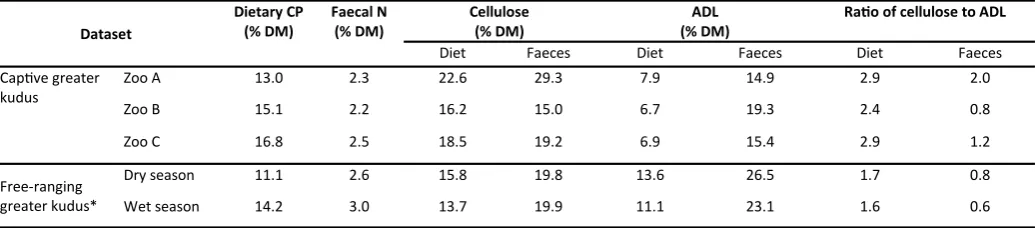
Dietary CP concentration at zoo A was comparable to both the free-ranging greater kudus and the recommendations of Schmidt and Barbiers (2005) of 10-14% CP (Table 5). Zoo C was within the range of the higher recommendations of Lintzenich and Ward (1997) of 16.7-21.1% CP. The lowest intake of CP was at zoo B, despite a dietary CP concentration of 15.1%, due to the low total DMI. The dietary ADF concentrations at zoos A and C and of the free-ranging greater kudus (24.7-29.4%) were comparable to the levels recom-mended for captive giraffes by Schmidt and Barbiers (2005) of 25-30% ADF. However, free-ranging greater kudus consumed a ratio of cellulose to ADL of 1.6-1.7, whereas captive greater kudus consumed more cellulose and less ADL in a ratio of 2.4 at zoo B and 2.9 at both zoos A and C (Table 6). In terms of lucerne hay, the ratio of cellulose to ADL ranged from 3.8 in medium-low quality lucerne hay to 3.0 in high “quality 1” lucerne hay, which was still high compared to 0.3-1.9 in the browse at zoo A. The highest percentage of NFC (% DM) in the diet was at zoo B, due to high levels in the pelleted feed (49.7%). In the faecal analysis, free-ranging greater kudus had higher faecal N and ADL concentrations than captive greater kudus.
In terms of ME intake, zoo C was the only collection within the estimated maintenance ME requirements of 0.44-0.59MJ kg BM-0.75 d-1. Zoo A provided over (105-140%), and zoo B provided under
(67-90%), the estimated ME requirement, respectively.
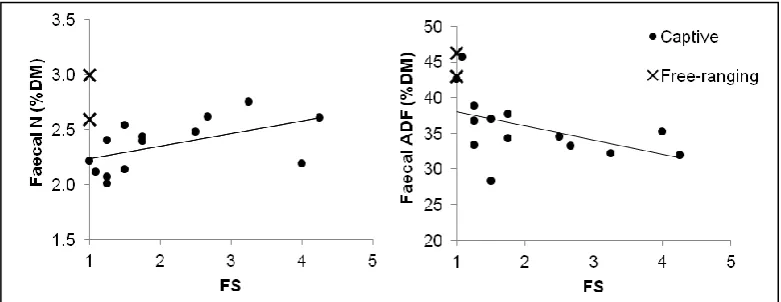
There were significant, positive correlations between dietary CP and faecal N (rs = 0.55; p = 0.044), and dietary and faecal NDF (rs = 0.83, p<0.001) and cellulose (rs = 0.55, p = 0.029) concentration, but there was a negative correlation between dietary and faecal ADL concentration (rs = -0.61, p = 0.020). BCS was significantly positively correlated with DMI (g DM kg BM-0.75 d-1) (rs = 0.54, p = 0.038). How-ever, BCS only showed a tendency to correlate with energy intake (rs = 0.49, p = 0.061) and was not associated with FS (rs = -0.13, p = 0.650). The FS significantly increased with dietary CP concentration (% DM) (rs = 0.58, p = 0.030), but was not significantly correlated with other dietary nutrients. In the faecal analysis, there was a high-ly significant, negative correlation between FS and faecal DM con-tent (rs = -0.82, p <0.001), suggesting that firmer faeces were also less moist. FS was also positively correlated with faecal N concentra-tion (% DM) (rs = 0.65, p = 0.013) and negatively correlated with faecal ADF concentration (rs = -0.64, p = 0.014) (Figure 3).
Zoo Mean BCS
Mean FS
Crude protein NDF (% DM)
ADF (% DM)
ADL (% DM)
NFC (% DM)
Metabolizable energy
% DM g kg BM-0.75 d-1 MJ/kg DM MJ kg BM-0.75 d-1
A 3.0 1.0 13.0 9.8 44.3 30.5 7.9 32.3 8.14 0.62
B 2.7 2.0 15.1 7.4 33.1 22.9 6.7 40.5 7.99 0.39
C 3.3 2.5 16.8 10.6 35.7 25.4 6.9 33.8 8.07 0.51
Table 5. The body condition score (BCS), faecal score (FS) and dietary nutrient concentration (% DM) and intake (g kg BM-0.75 d-1) (neutral detergent fibre – NDF, acid detergent fibre –
ADF, acid detergent lignin – ADL; non-fibre carbohydrates - NFC) of the captive greater kudus in this study. Normal BCS is 3.0 and normal FS is 1.0 and metabolizable energy is esti-mated.
Figure 3. Relationship between the mean faecal consistency score (FS) and (a) faecal nitrogen (N) and (b) faecal acid detergent fibre
(ADF) of captive and free-ranging greater kudus. Normal FS is 1.0.
Figure 2. Relationship between lucerne hay dry matter intake (DMI = g DM kg BM-0.75 d1)
Discussion
The results of the present study suggest that captive greater kudus were less likely to achieve a normal BCS, and tended towards softer faeces, than their free-ranging counterparts, which suggests that the diets in captivity differed in nutrient composition from the diet in the wild. Some of the limitations of the study must be stated. This study was on a small scale involving 15 animals on three different diets. The body mass of each individual was estimated and no ad-justments were made for the requirements of lactating or growing individuals; thus the maintenance levels presented represent a mini-mum group requirement. The dietary and faecal nutrient concentra-tions were measured over three days and do not encompass long-term consequences or seasonal variations. For logistical reasons, the intake of grass and the individual feed intake of each animal could not be measured. The dietary and faecal nutrient concentrations in free-ranging greater kudus were obtained from two different sources (c.f. Owen-Smith and Cooper 1989; Codron et al. 2007b). Nevertheless, the findings facilitate the identification of major differ-ences between diets consumed in captivity and in the wild.
The BCS was rather low in three animals of zoo B, which sug-gests a deficient intake of energy or specific nutrients or both. The positive correlation between DMI and BCS, and an ME intake below the estimated minimal requirements, suggests that the animals at zoo B did not consume enough food to meet requirements. Assum-ing an ME content of 8 MJ/kg DM, a non-reproducAssum-ing adult would have to consume 55-74 g DM kg BM-0.75 d-1 to meet the estimated ME requirements of 0.44-0.59 MJ kg BM-0.75 d-1. A DMI below these
estimations, like at zoo B at 49.2 g DM kg BM-0.75 d-1, suggests the presence of either an energy deficit, or a nutrient-dense ration that could, in turn, lead to diet-related disorders, such as acidosis. How-ever, there is also an inverse relationship between both DMI and ME intake and access to grass. This correlation could suggest that ani-mals with greater grass access, such as the aniani-mals at zoo B, ate more grass, to the extent that grass DMI depressed DMI (excluding grass). However, grass is generally high in cellulose and abrasive silica. Browsers, with 'moose-type anatomy', achieve lower fibre digestive coefficients than grazers (Pérez-Barberìa et al. 2004) and may not be adapted to comminute grass effectively (Hummel et al.
2008). This is reflected in the diet of free-ranging greater kudus, which only consists of approximately 4% tropical grass (Codron et al.
2007a). Although four animals at zoo B did achieve a normal BCS, three animals, including a lactating female, had a lower BCS, which suggests that the animals may not have been able to extract suffi-cient nutrients from the grass to maintain an animal with additional requirements. Therefore, pasture grass should not be considered a major component in the diet of captive greater kudus, and access to pasture should not imply that a lower provision of roughages, such as lucerne hay or browse, is required. The animals at zoo A were consuming more than the estimated maximum maintenance ME requirements, but given that both animals scored BCS 3.0, the long term balance and digestion of nutrients appears to have met
re-quirements. However, it should be noted that ME was only estimat-ed in this study. The DMI from the pellets was relatively consistent across all collections, despite differences in the type and availability of pelleted feed. Instead, DMI was affected by the intake of roughages and browse, which varied considerably. Therefore, to increase the DMI (for example at zoo B), the intake of roughages must be increased.
Roughage intake is important for the stimulation of rumination and normal feeding behaviour. Yet, there are numerous reports documenting the low acceptance of hay by captive browsing rumi-nants (c.f. Clauss et al. 2003). Miller et al. (2010) reported a low intake of timothy hay by captive greater kudus, with a pellet to timo-thy hay ratio of 5.0:1.0. By comparison, the animals at zoo C had an unstructured to structured food ratio of 1.4:1.0, using high “quality 1” lucerne hay. Lucerne hay DMI appeared to be directly related to quality as, even with a limited quantity of alternative feeds and the prospect of energy deficiency, the animals at zoo B, on low “quality 4” lucerne hay, consumed much less lucerne hay than the other animals in this study with ad libitum access to pellets. High-quality lucerne hay has also been reported to increase roughage intake in captive giraffes and okapis (Okapi johnstoni) (Hummel et al. 2003), and high-quality forage is generally associated with higher food in-take in herbivores (Meyer et al. 2010). However, prime quality lu-cerne hay can be difficult to source in Europe (Clauss and Dierenfeld 2008). Wright et al. (2011) reported significant variation in the quali-ty of lucerne hay fed to eastern bongos (Tragelaphus eurycerus isaaci) in UK collections. The provision of browse, as shown in the present study and by Hatt et al. (2005) in captive giraffe, can in-crease DMI and should be offered as much as possible. However, obtaining browse in large quantities can be logistically difficult, and expensive. Ideally, zoos that keep browsing ungulates should main-tain browse plantations (Höllerl et al. 2006; Schlegel et al. 2006). By providing browse, and both lucerne and grass hay, zoo A attained the highest roughage intake, with an unstructured to structured food ratio of 1.0:1.0. A diverse diet has been shown to increase DMI in several domestic species (Rolls et al. 1983; DiBattista and Sitzer 1994; Villalba et al. 2011). Therefore, providing a greater variety of roughages, including grass hay, may increase roughage and total DM intake. Increasing the number of different roughages offered could also positively impact on animal welfare because a monotonous diet might cause satiety, which might limit food intake and could be stressful for the animal (Villalba et al. 2010). Low-quality lucerne hay of grades 3-4 (c.f. Ullrey 1997) should be avoided due to the low intake by the captive greater kudus.
In this study, FS was positively correlated to both dietary CP and faecal N concentration (% DM). Nijboer et al. (2006) also reported a positive correlation between dietary and faecal CP concentration and FS in captive colobine monkeys (Subfamily: Colobinae), where the proportion of CP ingested by captive individuals was higher than the CP consumed by their free-ranging counterparts. Indeed, com-pared to the free-ranging greater kudus, the diets of the captive greater kudus with a higher FS had a much higher proportion of CP.
Dataset
Dietary CP (% DM)
Faecal N (% DM)
Cellulose (% DM)
ADL (% DM)
Ratio of cellulose to ADL
Diet Faeces Diet Faeces Diet Faeces
Captive greater kudus
Zoo A 13.0 2.3 22.6 29.3 7.9 14.9 2.9 2.0
Zoo B 15.1 2.2 16.2 15.0 6.7 19.3 2.4 0.8
Zoo C 16.8 2.5 18.5 19.2 6.9 15.4 2.9 1.2
Free-ranging greater kudus*
Dry season 11.1 2.6 15.8 19.8 13.6 26.5 1.7 0.8
Wet season 14.2 3.0 13.7 19.9 11.1 23.1 1.6 0.6
* From the dataset of Owen-Smith and Cooper (1989) and the data of Codron et al. (2007)
In cattle (Bos primigenius), a high CP concentration can cause softer FS, but FS is also affected by CP digestibility (Ireland-Perry and Stallings 1993). Whether it is really the high CP concentration (and digestibility) as such, or whether CP is only a general proxy in these cases for overall diet quality, remains to be elucidated.
The higher faecal N in captive animals, with a higher FS, is an indirect indication of a highly digestible diet (Hodgman et al. 1996). Low fibre diets are also associated with softer FS in a number of different species (Ireland-Perry and Stallings 1993; Nijboer et al.
2006). In the present study, there was a negative correlation be-tween dietary and faecal indigestible ADL concentration across the three collections, which confirms that diets lower in ADL, or fibre as a whole, also had a higher digestibility. Diets that were lower in fibre and roughages contained a higher proportion of pelleted feed and either a cereal-based pellet or commercial fruits, which are known to be highly digestible (Clauss and Dierenfeld 2008). Corresponding-ly, there was a negative correlation between FS and faecal ADF con-centration, which suggests that a higher content of highly digestible feeds, with a lower content of fibre, contributed to, or caused, the high FSs in the present study. Therefore, the present results support the notion that highly digestible feeds should not be fed in large amounts to captive browsing ruminants, and that the content of CP, sugars and starch should be reduced by increasing the content of fibre, ideally by the proportion of roughages, in the diet of captive browsing ruminants.
The recommendations of Lintzenich and Ward (1997), of 16.7-21.1% CP, exceed the CP concentration of the diet actually sumed by free-ranging subadult greater kudus. These diets con-tained 11.1% CP in the dry season and 14.2% CP in the wet season. This could be an indication that current protein recommendations are unnecessarily high. McCusker et al. (2011) found that growing mule deer (Odocoileus hemionus) were able to meet both energy and protein requirements on a low-starch high-fibre pellet with 14.8% CP. In addition, the higher faecal N concentration of free-ranging greater kudus, with a normal FS, could be the result of a higher content of indigestible N bound to, or in, plant secondary metabolites or lignin, which could be an indication of different N to CP conversion factors (Robbins et al. 1987; Hanley et al. 1992; Conklin-Brittain et al. 1999). Therefore, the actual dietary CP availa-ble for digestion to the free-ranging greater kudus may be compara-tively lower than that in captive animals consuming a diet with the same nominal CP concentration. In the present study, the non-reproducing greater kudus at zoo A were maintained with a FS lower than 1.5, and at a BCS of 3.0, with a dietary CP concentration of 13.0%, which suggests that the reduced protein recommendations for captive giraffes by Schmidt and Barbiers (2005) of 10-14% CP could be applied to captive greater kudus as well. Further research is required into CP digestibility, and into N conversion factors for wild and zoo diets.
The proportion of unstructured feeds at two collections was above the maximum of 50% as recommended by Hummel and Clauss (2006). Apart from contributing to, or causing, softer FSs, more seriously, diets high in sugars and starch and low in fibre and roughages can cause ruminal acidosis, oral stereotypies and other diet-related disorders (Schochat et al. 1997; Schaub et al. 2004; Potter and Clauss 2005; Clauss and Dierenfeld 2008; Colville et al.
2009). Therefore, cereal-based pellets and commercial fruits should be removed from the diet, or restricted to behavioural training, and the proportion of fibre and roughages in the diet should be in-creased. The proportion of ADF in the diet of free-ranging greater kudus was comparable to the recommendations for giraffe of Schmidt and Barbiers (2005) of 25-30%, which again suggests that these recommendations could be implemented for captive greater kudus. However, free-ranging greater kudus had a higher proportion of indigestible ADL in the diet, which suggests that the current diets fed to captive browsing ruminants are too digestible, even in terms of fibre composition. High-quality lucerne hay contains a lower pro-portion of cellulose, and has a lower cellulose to ADL ratio, than
low-quality lucerne hay, but still has a relatively high cellulose to ADL ratio (3.0) compared to the diet of free-ranging greater kudus (1.6-1.7). Feeding of lucerne hay is recommended not for its protein con-tent, but because it is a readily available roughage that will ensure fibre intake. Providing browse, high-quality lucerne hay and a pellet-ed fepellet-ed with a high fibre content and a low cellulose to ADL ratio appear to be the best available recommendations for the feeding of captive greater kudu based on the present findings.
Conclusions
1. In a study of the current feeding practices for captive greater kudus, only eight of 15 individuals had a normal body condition score and five individuals had a normal faecal consistency score, which suggests that the amount and the composition of the diets fed to captive greater kudus were different from that ingested by their free-ranging counterparts.
2. A low body condition score was correlated with a low intake of total dry matter, confirming the usefulness of condition scoring to monitor nutritional status and dietary adequacy.
3. Faecal consistency was positively correlated with dietary CP and faecal N and negatively correlated with faecal ADF, which sug-gests that a higher content of highly digestible feeds may have contributed, or caused, softer faeces and should therefore not be fed to captive greater kudus.
4. Compared to free-ranging greater kudus, captive greater kudus consumed diets with a much higher concentration of CP, which appears to be unnecessary, and with a lower cellulose to ADL ratio, indicating that the fibre composition in diets in captivity deviates from conditions in the wild.
5. Roughage intake had the greatest effect on DMI in captivity. However, lucerne hay intake increased as hay quality increased. Hence, rather than trying to meet energy and nutrient require-ments by offering a nutrient dense diet with some roughage, the findings of this study suggest that feeding browse, high-quality low fibre roughage and high fibre, low CP, starch and sugar, pel-lets, is a better strategy.
6. It should be further tested whether the feeding recommenda-tions for captive giraffes, of 10-14% CP and 25-30% ADF by Schmidt and Barbiers (2005), could also be implemented for captive greater kudus.
Acknowledgements
We thank the BIAZA Research Committee for their support with this research project and the zoological collections and their keepers for their help with this study. We also thank Dr Stephen Waite, Ailison Kelland and Rebecca Sealy at Hartpury College for providing equipment and storing samples. LT would also like to thank the Hardy Family and Zoo Zürich for their hospitality during data collection and analysis, respectively, and John and Fiona Taylor for help with sample storage and transportation.
References
AOAC (1997) Official methods of analysis. Association of official analytical chemists, Arlington, VA, USA.
Barber J.C. (2009) Programmatic approaches to assessing and improving animal welfare in zoos and aquariums. Zoo Biology 28:519-530. Baylor J.E., Rohweder D.E. (1979) Implementation of new hay standards in
the U.S. --- Where are we? Report from the AFGC Hay Marget Task Force. Proc Ann AFGC pp. 47-57. Littlerock, AK.
Bond A. (2001) Practical problems with data collection for nutritional analy-sis: a study of animal diets at Bristol Zoo Gardens. In: Fidgett A.L., Clauss M., Eulenberger K., Hatt J.-M., Hume I., Janssens G., Nijboer J., editors.
Zoo Animal Nutrition. vol III. Fürth, Germany: Filander Verlag.
Clauss M., Kienzle E., Hatt J.-M. (2003) Feeding practice in captive wild rumi-nants: peculiarities in the nutrition of browsers/ concentrate selectors and intermediate feeders. A review. In: Fidgett A.L., Clauss M., Gansloßer U., Hatt J.-M., Nijboer J., editors. Zoo Animal Nutrition. vol II. Fürth, Ger-many: Filander Verlag. p 27-52.
Clauss M., Wilkins T., Hartley A., Hatt J.-M. (2009) Diet composition, food intake, body condition, and fecal consistency in captive tapirs (Tapirus
spp.) in UK collections. Zoo Biology 28:279-291.
Codron D., Codron J., Lee-Thorp J.A., Sponheimer M., de Ruiter D., Sealy J., Grant R., Fourie N. (2007a) Diets of savanna ungulates from stable car-bon isotope composition of faeces. Journal of Zoology 273:21-29. Codron D., Lee-Thorp J.A., Sponheimer M., Codron J., De Ruiter D., Brink J.S.
(2007b) Significance of diet type and diet quality for ecological diversity of African ungulates. The Journal of Animal Ecology 76:526-537. Colville K., Bouts T., Hartley A., Clauss M., Routh A. (2009) Frothy bloat and
serous fat atrophy associated with insufficient fibre intake in a giraffe (Giraffa camelopardalis). In: Clauss M., Fidgett A.L., Hatt J.-M., Huisman T., Hummel J., Janssen G., Nijboer J., Plowman A., editors. Zoo Animal Nutrition. Fürth, Germany: Filander Verlag. p 219-229.
Conklin-Brittain N.L., Dierenfeld E.S., Wrangham R.W., Norconk M., Silver S.C. (1999) Chemical protein analysis: A comparison of Kjeldahl crude protein and total ninhydrin protein from wild, tropical vegetation. Journal of Chemical Ecology 25:2601-2622.
de Garine-Wichatitsky M., Fritz H., Gordon I.J., Illius A.W. (2004) Bush selec-tion along foraging pathways by sympatric impala and greater kudu.
Oecologia 141:66-75.
DiBattista D., Sitzer C.A. (1994) Dietary variety enhances meal size in golden hamsters. Physiology & Behavior 55:381-383.
Disney’s Animal Kingdom (2005) Nyala body condition scores. Lake Buena Vista, Florida, USA: Disney's Animal Kingdom.
Fowler M.E. (1978) Peracute mortality in captive giraffe. Journal of the Ameri-can Veterinary Medical Association 173:1088-1093.
Greeff J.C., Karlsson L.J.E. (1997) Genetic relationships between faecal worm egg count and scouring in merino sheep in a mediterranean environ-ment. Proceedings of the Association of the Advancement Animal Breed-ing and Genetics 12:333-337.
Hanley T.A., Robbins C.T., Hagerman A.E., McArthur C. (1992) Predicting digestible protein and digestible dry matter in tannin-containing forages consumed by ruminants. Ecology 73:537-541.
Hatt J.-M., Schaub D., Wanner M., Wettstein H.R., Flach E.J., Tack C., Hässig M., Ortmann S., Hummel J., Clauss M. (2005) Energy and fibre intake in a group of captive giraffe (Giraffa camelopardalis) offered increasing amounts of browse. Journal of Veterinary Medicine 52:485-490. Hodgman T.P., Davitt B.B., Nelson J.R. (1996) Monitoring mule deer diet
quality and intake with fecal indices. Journal of Range Management
49:215-222.
Höllerl S., Stimm B., Hummel J., Clauss M. (2006) Browse provision for cap-tive herbivores: design and management of a browse plantation. In: Fidgett A.L., Clauss M., Eulenberger K., Hatt J.-M., Hume I., Janssens G., Nijboer J., editors. Zoo Animal Nutrition. vol III. Fürth, Germany: Filander Verlag.
Hooimeijer J.F., Jansen F.A., de Boer W.F., Wessels D., van der Waal C., de Jong C.B., Otto N.D., Knoop L. (2005) The diet of kudus in a mopane dom-inated area, South Africa. Koedoe 48:93-102.
Hummel J., Clauss M. (2006) Feeding. In: Barta Z., Clauss M., Culik L., Damen M., Hummel J., Schleussner G., Tomasova K., Zimmermann W., editors.
EAZA husbandry and management guidelines for Giraffa camelaoparda-lis. Arnhem: Burger's Zoo. p 26-61.
Hummel J., Fritz J., Kienzle E., Medici E.P., Lang S., Zimmermann W., Streich W.J., Clauss M. (2008) Differences in fecal particle size between free-ranging and captive individuals of two browser species. Zoo Biology
27:70-77.
Hummel J., Hoerhager A., Nawrocki D. (2003) Selective browsers - adequate nutrition of giraffes and okapis in zoos. Z Kölner Zoo 46:67-80.
Hummel J., Südekum K.-H., Streich W.J., Clauss M. (2006) Forage fermenta-tion patterns and their implicafermenta-tions for herbivore ingesta retenfermenta-tion times.
Functional Ecology 20:989-1002.
Ireland-Perry R.L., Stallings C.C. (1993) Fecal consistency as related to dietary composition in lactating holstein cows. Journal of Dairy Science 76:1074-1082.
Kirkwood J.K. (1996) Nutrition of captive and free-living wild animals. In: Kelly N., Wills J., editors. BSAVA Mannual of Small Animal Nutrition. London: The British Veterinary Association. p 235-243.
Lintzenich B.A., Ward A.M. (1997) Hay and pellet ratios: considerations in feeding ungulates. Nutrition Advisory Group Handbook Fact Sheet 006.
McCusker S., Shipley L.A., Tollefson T.N., Griffin M., Koutsos E.A. (2011) Effects of starch and fibre in pelleted diets on nutritional status of mule
deer (Odocoileus hemionus) fawns. Journal of Animal Physiology and Animal Nutrition 95:489-498.
Meyer K., Hummel J., Clauss M. (2010) The relationship between forage cell wall content and voluntary food intake in mammalian herbivores. Mam-mal Review 40:221-245.
Miller M., Weber M., Valdes E.V., Neiffer D., Fontenot D., Fleming G., Setter M. (2010) Changes in serum calcium, phosphorus, and magnesium levels in captive ruminants affected by diet manipulation. Journal of Zoo and Wildlife Medicine 41:404-408.
Müller D.W.H., Bingaman Lackey L., Streich W.J., Fickel J., Hatt J.-M., Clauss M. (2011) Mating system, feeding type and ex situ conservation effort determine life expectancy in captive ruminants. Proceedings of the Royal Society B 278:2076-2080.
Nijboer J., Clauss M., Everts H., Beynen A. (2006) Effect of dietary fibre on the faeces score in colobine monkeys in Dutch zoos. In: Fidgett A., Clauss M., Eulenberger K., Hatt J.-M., Hume I., Janssens G., Nijboer J., editors. Zoo Animal Nutrition. vol III. Fürth: Filander Verlag. p 145-155.
Owen-Smith N. (1994) Foraging responses of kudus to seasonal changes in food resources: elasticity in constraints. Ecology 75:1050-1062.
Owen-Smith N. (1997) Control of energy balance by a wild ungulate, the kudu (Tragelaphus strepsiceros), through adaptive foraging behaviour. Pro-ceedings of the Nutritional Society 56:15-24.
Owen-Smith N., Cooper S.M. (1987) Palatability of woody plants to browsing ruminants in a South African savanna. Ecology 68:319-331.
Owen-Smith N., Cooper S.M. (1989) Nutritional ecology of a browsing rumi-nant, the kudu (Tragelaphus strepsiceros), through the seasonal cycle.
Journal of Zoology 219:29-43.
Pellew R.A. (1984) The feeding ecology of a selective browser, the giraffe (Giraffa camelopardalis). Journal of Zoology 202:57-81.
Pérez-Barberìa F.J., Elston D.A., Gordon I.J., Illius A.W. (2004) The evolution of phylogenetic differences in the efficiency of digestion in ruminants.
Proceedings of the Royal Society B 271:1081-1090
Potter J.S., Clauss M. (2005) Mortality of captive giraffe (Giraffa camelopar-dalis) associated with serous fat atrophy - a review of 5 cases at Auckland zoo. Journal of Zoo and Wildlife Medicine 36:301-307.
Riney T. (1960) A field technique for assessing physical condition of some ungulates. Journal of Wildlife Management 24:92-94.
Robbins C.T., Hanley T.A., Hagerman A.E., Hjeljord O., Baker D.L., Schwartz C.C., Mautz W.W. (1987) Role of tannins in defending plants against ruminants: reduction in protein availability. Ecology 68:98-107.
Rolls B.J., Van Duivenvoorde P.M., Rowe E.A. (1983) Variety in the diet en-hances intake in a meal and contributes to the development of obesity in the rat. Physiology & Behavior 31:21-27.
Schaub D., Clauss M., Flach E.J., Wettstein H.R., Tack C., Hatt J.-M. (2004) Influence of physical and chemical composition of diet on oral stereo-typies in captive giraffes (Giraffa camelopardalis). Proceedings of the European Association of Zoo and Wildlife Veterinarians (EAZWV). Ebel-toft, Denmark. p 27-28.
Schlegel M.L., Renjifo A., Valdes E.V. (2006) Nutrient content of Carolina willow (Salix caroliniana) browse components fed to exotic ruminants. In: Fidgett A., Clauss M., Eulenberger K., Hatt J.-M., Hume I., Janssens G., Nijboer J., editors. Zoo Animal Nutrition. vol III. Fürth, Germany: Filander Verlag. p 213-224.
Schmidt D.A., Barbiers R. The giraffe nutrition workshop proceedings; 2005; Lincoln Park Zoo, Chicago, Illinois.
Schochat E., Robbins C.T., Parish S.M., Young P.B., Stephenson T.R., Tamayo A. (1997) Nutritional investigations and management of captive moose.
Zoo Biology 16:479-494.
Schwitzer C., Polowinsky S.Y., Solman C. (2009) Fruit as foods - common misconceptions about frugivory. In: Clauss M., Fidgett A., Hatt J.-M., Huisman T., Hummel J., Janssen G., Nijboer J., Plowman A., editors. Zoo Animal Nutrition. vol IV. Fürth, Germany: Filander Verlag.
Stuart C., Stuart T. (2000) A field guide to the tracks and signs of southern and East African wildlife. 3rd ed. Cape Town: Struik Publishers.
Ullrey D.E. (1997) Hay quality evaluation. Nutrition Advisory Group Handbook Fact Sheet 001.
Van Soest P.J., Robertson J.B., Lewis B.A. (1991) Methods for dietary fiber, neutral detergent fiber, and nonstarch polysaccharides in relation to animal nutrition. Journal of Dairy Science 74:3583-3597.
Villalba J.J., Bach A., Ipharraguerre I.R. (2011) Feeding behavior and perfor-mance of lambs are influenced by flavor diversity. Journal of Animal
Science 89:2571-2581.
Villalba J.J., Provenza F.D., Manteca X. (2010) Links between ruminants’ food preference and their welfare. Animal 4:1240-1247.