I
I
n
n
t
t
e
e
r
r
n
n
a
a
t
t
i
i
o
o
n
n
a
a
l
l
J
J
o
o
u
u
r
r
n
n
a
a
l
l
o
o
f
f
P
P
h
h
a
a
r
r
m
m
a
a
S
S
c
c
i
i
e
e
n
n
c
c
e
e
s
s
Vol. 6, No. 1 (2016): 1381-1386Research Article Open Access
I
ISSSSNN::22332200--66881100
Development and Validation of RP-HPLC method for
quantitative estimation of Ketorolac in bulk drug
L. Samba Siva Rao
1,*, Dr. P.Madhavan
2and Dr. K.Vanitha Prakash
31
Global API quality head, Cipla Ltd., R&D centre, Vikhroli (west), Mumbai, Maharashtra, India.
2
CPS, Dr.Reddys Laboratories Ltd, Miyapur, Hyderabad, Telangana, India.
3
SSJ College of Pharmacy, Hyderabad, Telangana, India.
* Corresponding author: L. Samba Siva Rao, e-mail: [email protected]
ABSTRACT
A new simple, rapid, selective, precise and accurate isocratic reverse phase high performance liquid chromatography has been developed and validated for the estimation of Ketorolac in bulk drugs. The chromatographic separations were achieved using a High performance liquid chromatography (Zorbax XDB C8, 150 mm, 4.6 mm,5µm) employing 0.1% orthophosphoric acid and acetonitrile in the ratio of 300:700 %v/v as mobile phase with a 1.0 mL/min flow rate was chosen. Ketorolac was eluted (RT at 2.2) within 10 minutes of run time. The column temperature was maintained at 25oC and a detector wavelength of 313 nm was employed.
Ketorolac was exposed to thermal, photolytic, hydrolytic, basic and oxidative stress conditions. The stressed samples were analyzed by the proposed method. Slight degradation of the analyte was observed when it was subjected to oxidative, thermal, hydrolytic, basic and in photolytic conditions. Ketorolac was found to be the major degradant. Peak homogeneity data of the Ketorolac obtained by photodiode array (PDA) detection demonstrated the specificity of the method in the presence of degradants. The method was validated with respect to linearity, precision, accuracy, ruggedness, robustness, limit of detection and limit of quantification.
Keywords: Ketorolac, RP HPLC, ICH Guide lines, Degradation, Method Validation.
1. INTRODUCTION
Ketorolac is chemically 5-Benzoyl-2,3-dihydro-1H-pyrrolizine-1carboxylic acid ,is a nonsteroidal anti-inflammatory drug (NSAID) with analgesic efficacy similar to that of the opioids. Only limited in house methods have been available for estimation of ketorolac in active pharmaceutical ingredients such as assay by potentiometry, to the best of our knowledge no reports were found for the validation of ketorolac in Active pharmaceutical ingredients. Literature survey reveals there is no pharmacopoeial method available in any pharmacopeia i.e. Indian pharmacopeia, United States Pharmacopoeia, British Pharmacopoeia and European pharmacopeia. Present study involves development of a convenient, rapid, and cost efficient and user friendly reversed-phase (RP)-HPLC method with a simple and easily available mobile phase for quantitative estimation of Ketorolac in bulk drug within 10 minutes of run time. The optimized method was
developed and validated as per International Conference on Harmonisation (ICH) guidelines.
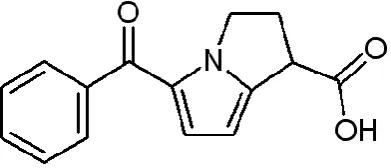
Chemical Name: 5-Benzoyl-2,3-dihydro-1H-pyrrolizine-1carboxylic acid.
Molecular formula: C15H13NO3
Molecular Weight : 255.27
Figure 1: Structure of Ketorolac.
2. MATERIALS AND METHODS
2.1 Chemicals and Reagents
The reference samples of Ketorolac were provided as gift samples from Dr.Reddys Laboratories Limited, Hyderabad. The 2-D structure of Ketorolac is given in Figure 1. HPLC grade acetonitrile and all other chemicals were obtained from Merck chemical division, Mumbai. HPLC grade water obtained from Milli-Q water purification system was used throughout the study.
2.2 Instrument and chromatographic conditions The HPLC system used for the method development and validation consisted of gradient pumps from Agilent 1260 Technologies, Ultra violet detector from Agilent Technologies. USA, with auto sampler and auto injector. The HPLC system was equipped with data acquisition and processing software “EZ Chrome” Agilent Technologies. USA. The column used for separation of analytes is Zorbax XDB C8, 150 mm, 4.6 mm, 5µm column. Mobile phase consisting of 0.1% orthophosphoric acid and acetonitrile in the ratio of 300:700 %v/v with a flow rate of 1mL/min. It was filtered through 0.45μm nylon filter and sonicated for 15 min in ultrasonic bath. Sample analyzed at 313 nm at an injection volume of 20 μL. (Figure-2).
2.3 Preparation of Buffer
Accurately taken 1 ml of Orthophosphoric acid in a 1000mL of milli-Q water and degas to sonicate for 15 minutes. It was filtered through 0.45μm nylon filter.
2.4Preparation of Mobile phase
Take accurately 300 ml of above buffer and add 700 ml acetonitrile and sonicate to degas for 15mnts.
2.5 Diluent: Milli Q Water and Acetonitrile in the ratio
of 500: 500 % v/v and degas to sonicate for 15 minutes.
2.6 Preparation of Standard and sample:
(100μg/mL): Weight accurately 10mg of Ketorolac standard/sample into a 100ml volumetric flask, add 50mL of diluent, then sonicated for 10min and make up the volume with diluent.
2.7 Preparation of stock solution:
Weigh accurately (1000μg/mL) 100mg of Ketorolac sample into a 100ml of volumetric flask, add 50mL of diluent, then sonicated for 10min and make up the volume with diluent.
2.8 METHOD VALIDATION
The validation of the method was carried out as per ICH Guidelines. The parameters assessed were specificity, linearity, precision, accuracy, stability, LOD and LOQ.
2.8.1 Specificity
Specificity is the ability of the analytical method to measure the analyte response in the presence of interferences including degradation products. The specificity of the developed HPLC method for Ketorolac
was carried out. Stress studies were performed for Ketorolac bulk drug to provide an indication of the stability indicating property and specificity of the proposed method. Intentional degradation was attempted to stress conditions of UV light (254nm), heat (80°C), acid (0.5N HCl), base (0.5N NaOH), and Oxidation (3.0 % H2O2) to evaluate the ability of the
proposed method to separate Ketorolac from its degradation products. For all degradation studies, period was 24 hours. Assay carried out for stress samples against qualified Ketorolac reference standard.
2.8.2 Accuracy
The accuracy of the assay method was evaluated in triplicate at three concentration levels 50%, 100% and 150 % of test concentration (0.1 mg/mL). The percentages of recoveries were calculated from the slope and Y- Intercept of the calibration curve.
2.8.3 Precision
The precision of the assay method was evaluated by carrying out six independent assays of Ketorolac test samples against a qualified reference standard and calculate the %RSD of assay. The intermediate precision of the method was also evaluated using different analyst and different instrument in the same laboratory.
2.8.4 Linearity
The purpose of the test for linearity is to demonstrate that the entire analytical system (including detector and data acquisition) exhibits a linear response and is directly proportional over the relevant concentration range for the target concentration of the analyte. The linear regression data for the calibration plot is indicative of a good linear relationship between peak area and concentration over a wide range. The correlation coefficient was indicative of high significance.
2.8.5 Robustness
Robustness of the method was investigated under a variety of conditions including changes of composition of buffer in the mobile phase, flow rate and temperature. This deliberate change in the method has no effect on the peak tailing, peak area and theoretical plates and finally the method was found to be robust.
2.8.6 Limit of Detection & Limit of Quantitation
The LOD can be defined as the smallest level of analyte that gives a measurable response and LOQ was determined as the lowest amount of analyte that was reproducibly quantified. These two parameters were calculated using the formula based on the standard deviation of the response and the slope. LOD and LOQ were calculated by using equations, LOD=3.3×SD/S and LOQ=10×SD/S, where SD = standard deviation, S= slope of the calibration curve.
2.8.7 Solution stability and Mobile phase stability:
sample and reference standard in tightly capped volumetric flasks at room temperature for 24 hrs. The same sample solutions were assayed for 6 hrs. interval up to the study period. The mobile phase stability was also carried out by assaying the freshly prepared sample solution against freshly prepared reference standard solution for 6 hrs interval up to 48 hrs. Mobile phase prepared was kept constant during the study
period. The % RSD for the assay of Ketorolac was calculated during mobile phase and solution stability experiment.
The solution stability of Ketorolac method was carried out by leaving standard and sample solution in the tightly capped volumetric flasks at room temperature for 24 hrs.
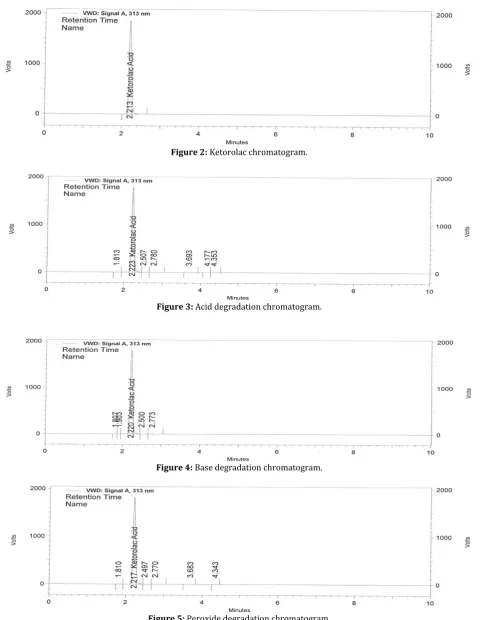
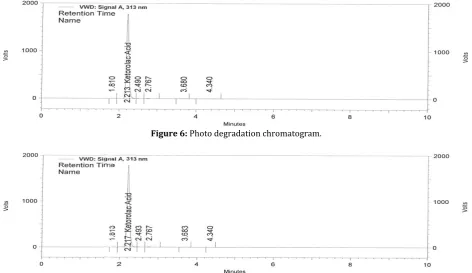
Figure 2: Ketorolac chromatogram.
Figure 3: Acid degradation chromatogram.
Figure 4: Base degradation chromatogram.
Figure 6: Photo degradation chromatogram.
Figure 7: Thermal degradation chromatogram.
2.9 Forced Degradation studies
Stress studies were performed according to ICH guidelines under conditions of hydrolysis (acidic and alkaline), photolysis, oxidation, and thermal studies.
2.9.1 Oxidation:
To 5 mL of stock solution of Ketorolac, 5 mL of 3% hydrogen peroxide (H2O2) was added separately. The
solutions were kept for 30 min at 60°C, for 24 hours at 25°C.For HPLC study, the resultant solution was diluted to obtain 100μg/mL solution then injected 20 μL into the system and the chromatograms were recorded to assess the stability of sample (Figure-5).
2.9.2 Acid Degradation Studies:
To 5 ml of stock solution of Ketorolac, 5ml of 0.5N Hydrochloric acid was added and refluxed for 30mins at 60°C, after kept 24 hours at 25°C the resultant solution was diluted to obtain 100μg/mL solution then injected 20 μL into the system and the chromatograms were recorded to assess the stability of sample (Figure-3).
2.9.3 Alkali Degradation Studies:
To 5 mL of stock solution of Ketorolac, 5ml of 0.5N sodium hydroxide was added and refluxed for 30mins
at 60°C, after kept 24 hours at 25oC. The resultant
solution was diluted to obtain 100μg/mL solution then injected 20 μL into the system and the chromatograms were recorded to assess the stability of sample (Figure-4).
2.9.4 Dry Heat Degradation Studies:
The Ketorolac drug solution was placed in oven at 80°C for 24 h to study dry heat degradation. For HPLC study, the resultant solution was diluted to 100μg/mL solution then injected 20µL into the system and the chromatograms were recorded to assess the stability of the sample(Figure-7).
2.9.5 Photo Stability studies:
The photochemical stability of the drug was also studied by exposing the 100μg/mL solution to UV Light by keeping the beaker in UV Chamber for 24 hours in photo stability chamber. For HPLC study, the resultant solution was diluted to obtain 100μg/mL solution then injected 20 μL into the system and the chromatograms were recorded to assess the stability of sample (Figure-6).
Table 1: Optimized Chromatographic conditions.
Parameter Condition
Mobile phase 0.1% orthophosphoric acid buffer : Acetonitrile(300:700 % v/v)
Column Zorbax XDB C8 150 mm, 4.6 mm,5µm
Wavelength 313nm
Flow Rate 1.0mL/min
Injection volume
Run time 20 µL 10 min
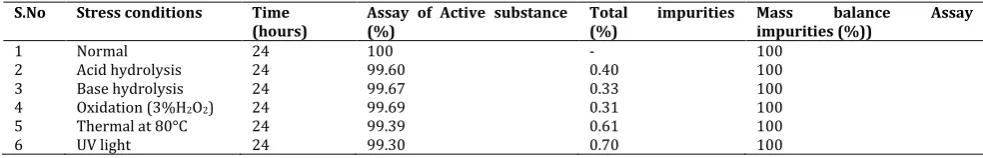
Table 2: Forced degradation studies.
S.No Stress conditions Time
(hours) Assay of Active substance (%) Total (%) impurities Mass impurities (%)) balance Assay
1 Normal 24 100 - 100
2 Acid hydrolysis 24 99.60 0.40 100
3 Base hydrolysis 24 99.67 0.33 100
4 Oxidation (3%H2O2) 24 99.69 0.31 100
5 Thermal at 80°C 24 99.39 0.61 100
6 UV light 24 99.30 0.70 100
Table 3: Limit of Detection and Limit of Quantification (%).
Table 4: Linearity data.
Table 5: Accuracy data.
Name Ketorolac
Accuracy %Recovery 99.10-99.65
3. RESULTS AND DISCUSSION
To establish and validate an efficient method for analysis of the drug in bulk preliminary tests were performed. Different chromatographic conditions were employed for the analysis of the Ketorolac in active pharmaceutical ingredients. Finally the analysis was performed by using 0.1% orthophosphoric acid and Acetonitrile in the ratio of 300:700 % v/v at a flow rate 1.0 mL/min. Samples were analyzed at 313nm at an injection volume of 20 μL and separation was carried by using Zorbax XDB C8 (150 x 4.6 mm, 5µm) column. The proposed method was optimized to give very sharp peak and meeting as per ICH guideline (theoretical plate count more than 2000 and asymmetry less than 2.0). The optimized conditions were given in Table 1.
Forced degradation studies were performed to establish the stability indicating property and specificity of the proposed method. Degradation studies were carried out at 24 hours under conditions of acid hydrolysis, base hydrolysis, dry heat, oxidation, UV light. Oxidative degradation conditions were performed by the drug sample with 3% H2O2 at 25oC.
Acid and base hydrolysis was performed by exposing the drug substances with 0.5N HCl and 0.5N NaOH at 25oC for 24 hours. Slight degradation observed in
photolytic condition and very slight degradation observe in all other conditions. The results of forced degradation studies were given in Table 2.
Precision was evaluated by a known concentration of Ketorolac was injected six times and corresponding peaks were recorded and % RSD was calculated and
found within the limits. The low % RSD value was indicated that the method was precise and reproducible.
Accuracy of the method was proved by performing recovery studies on the commercial bulk for Assay at 50%, 100% 150%, and level. Recoveries of Ketorolac from 99.1% to 99.65% in proposed method and the results were shown in the (Table 5).
Linearity was established by analyzing different concentrations for assay (25%, 50%, 100% 150%, 200% and 250%) level. The calibration curve was plotted with the area obtained versus concentration Ketorolac acid. In the present study six concentrations were chosen ranging between 25-250 μg/mL of Ketorolac acid. The linear regression data for the calibration plot is indicative of a good linear relationship between peak area and concentration over a wide range. The correlation coefficient was indicative of high significance and the results were shown in the (Table 4).
Robustness of the method is the ability of the method to remain unaffected by small deliberate changes in parameters like flow rate, mobile phase composition and column temperature. To study the effect of flow rate of the mobile phase it was changed to 0.1 units from 1.0 mL to 0.9 mL and 1.1 mL. The effect of column temperature also checked by changing temperature to ± 5oC. This deliberate change in the above parameters
has no significant effect on chromatographic behaviour of the samples. LOD and LOQ of Ketorolac were
Name Ketorolac
LOD 2.35
LOQ 7.11
Name Ketorolac
Linearity (n=3)
Intercept 2794849.69
Slope 138076563.21
evaluated based on relative standard deviation of the response and slope of the calibration curve. The detection limits were found to be 25 μg/mL of Ketorolac. The quantitation limit were found to be 250μg/mL for Ketorolac. The results were given in the (Table 3).
4. CONCLUSION
A new stability- indicating RP-HPLC method has been developed for estimation of Ketorolac in active pharmaceutical ingredients. There is no reported method available in any pharmacopeia. The developed method was validated and it was found to be simple, sensitive, precise, and robust and it can be used for the routine and stability sample analysis of Ketorolac in active pharmaceutical ingredients. The forced degradation studies were carried out in accordance with ICH guidelines and the results revealed suitability of the method to study stability of Ketorolac under various degradation conditions like acid, base, oxidative, thermal, UV and photolytic degradations. Finally it was concluded that the method is simple, sensitive and has the ability to separate degradants the drug from degradation products found in active pharmaceutical ingredients.
5. REFERENCES
1. B. Raja and A. Lakshmana Rao (2013), Analytical method
development and validation for simultaneous estimation of Febuxostat and ketorolac in Tablet dosage forms by RP HPLC. International journal of pharmaceutical chemical and biological sciences, 2013, 3(3), 571-576
2. Shahana Begum, K. Divya Bharathi et al (2014), A validated
RP-HPLC method for simultaneous estimation of moxifloxacin hydrochloride and ketorolac tromethamine in ophthalmic dosage form. Der Pharmacia Lettre, 2014, 6 (6):335-341
3. Tapas Majumder, Sarbojit Kundu et al (2014),Development
and validation of a HPLC-UV method for simultaneous determination of moxifloxacin HCl and Ketorolac tromethamine in ocular formulation. International journal of pharmaceutical sciences and research, 2014; Vol. 5(7): 2902-2907
4. Kumaraswamy Gandla1, JMR Kumar et al (2012), A validated
RP-HPLC method for simultaneous estimation of Febuxostat and ketorolac in pharmaceuitical formulations. Journal of Drug Delivery & Therapeutics; 2012, 2(3): 173-176
5. Venkata Raj Kumar Prava, Ganapaty Seru et al (2014),
Development and validation of RP-HPLC method for simultaneous determination of Phenylephrine and Ketorolac in pharmaceutical dosage forms. International journal of research in Pharmacy and chemistry 2014, 4(4), 1104-111.
6. ICH Q2 (R1), Validation of Analytial procedures, Text and
Methodology, International Conference on Harmonization. Geneva. 2005. p. 1-17.
7. O’ Connor N., Geary M., Wharton M.et al (2012), Development
and validation of a rapid liquid chromatographic method for the analysis of Ketorolac Tromethamine and its related production Impurities. Journal of Applied Pharmaceutical Science 2012, 02 (05), 15-21
8. Priyadarshani S Bansode1, Chetan Singh Chauhan et al
(2015), Method development and validation of quantitative analytical method for Moxifloxacin and Ketorolac combination in pharmaceuitical dosage form by RP-HPLC. 2015, 4 (03), 1402-1408.
9. C. Hazarathaiah Yadav (2015).The estimation of Ketorolac
drug in Ketorolac Tromethamine eye drops by RP-HPLC. Journal of Chemical and Pharmaceutical Research, 2015, 7(6):562-567
10.Selvadurai Muralidharan, Kalaimani Jayaraja kumar et al
(2013), Simple and sensitive method for the analysis of ketorolac in human plasma sing high-performance liquid chromatography. Journal of Young Pharmaceuticals, 2013, 5(3), 98–101.
*****