Modelling the Single Chamber Solid Oxide
Fuel Cell by Artificial Neural Network
Tuan-Anh Nguyen
1,*, Hoc-Tran Nguyen
1, Minh-Vien Le
11
Faculty of Chemical Engineering, Ho Chi Minh City University of Technology–VNUHCM, Vietnam
ABSTRACT: The fuel cell is currently considered as one of the most promising technologies for future energy demand. Solid oxide fuel cells (SOFCs) have several advantages including flexibility of fuel used and relatively inexpensive materials due to high temperature operation. SOFCs operate easily in the single-chamber mode due to the simplified, compact, sealing-free cell structure. An artificial neural network (ANN) can be used as a black-box tool to simulate systems without solving the physical equations merely by utilizing available experimental data. In this study, the ANN is used for modelling a singular cell behavior. The error backpropagation algorithm was used for an ANN training procedure. Experiments of a planar button solid oxide fuel cell were used to train and verify the networks. The fuel cell system is fed by methane and oxygen. The cathode is LSCF6482, the anode is GDC-Ni, the electrolyte is LDM and the operating pressure is 1 atm. The ANN based SOFC model has the following input parameters: current density, temperature; and the cell voltage is predicted by the model. Obtained results show that the ANN can be successfully used for modelling the single chamber solid oxide fuel cell without knowledge of numerous physical, chemical, and electrochemical factors.
KEYWORDS -Artificial Neural Network, Modeling, Single Chamber, Solid Oxide Fuel Cell
I. INTRODUCTION
As a clean and efficient energy conversion device, the fuel cell is currently considered as one of the most promising technologies for future energy demand. Solid oxide fuel cells (SOFCs) have several advantages over other types of fuel cells, including flexibility of fuel used and relatively inexpensive materials due to high temperature operation ([1]). Solid oxide fuel cell operated in the single-chamber mode, in which the fuel and oxidant are allowed to mix and anode and cathode reactions take place within the same physical chamber, have attracted recent attention. Since no separation between fuel and air is required, single chamber solid oxide fuel cells (SC-SOFCs) greatly simplify the system design and enhances the thermal and mechanical shock resistance ([1]). Modeling and simulation of SOFCs are effective tools in understanding and investigating effects of various design and operation parameters on SOFC performances, as well as helping in SOFC developments. The modeling and simulation results can be used to optimize and control the fuel cell behavior, increase the efficiency and performance, and design the system ([2]). Therefore, a great number of researches had investigated in SOFC modelling and the internal process simulation based on physical principles. These models range from zero-dimensional (0-D) to three-zero-dimensional (3-D) with
different features and point to different research objectives. However, the mathematical models are generally derived from multi-physical, chemical, and electrochemical equations, which require knowledge about many parameters and properties of the component materials, the exact processes and the numerical solutions, making the problem too complicated to be suitable for engineering applications.
Motivated by this need, another approach using statistical data-driven approach for fuel cell models has attracted increasing attention [3]. Among them, an ANN can be used as a black-box tool to simulate systems data obtained from experimental measurements or physical models. The main advantages of ANN include nonlinearity, allowing better fit to the data and does not require any specific analytical equations and system descriptions.
II. MATERIALS AND METHODS
2.1. Experimental
The detail of experimental set up could be found in our study [4]. The brief summary of the cell is explained as follows. The anode-supported cell was a porous support of nickel oxide and 10 mol% Gd-doped CeO2 (NiO+GDC). The
electrolyte was La1.8Dy0.2Mo2O9 (LDM). There was
a single interlayer of 0.5 wt% Fe2O3-doped
Gd0.1Ce0.9O1.95 (Fe-GDC), which functioned as a
diffusion barrier to prevent reaction between the LAMOX and the cathode. The cathode layer was La0.6Sr0.4Co0.8Fe0.2O3 (LSCF). The configuration of
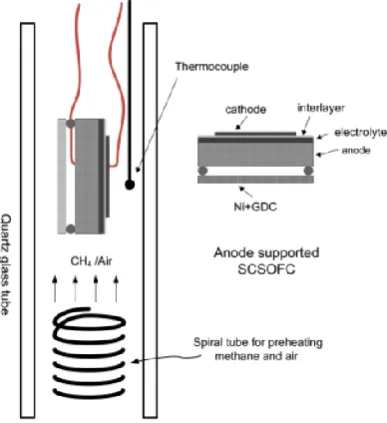
the fuel cell system of Ni+GDC/ LAMOX/Fe-GDC/LSCF was shown in Fig. 1. The single cell was suspended on two gold wires for current collecting. The cell was positioned above a coil, which prolongs the heating time for the inflow. Both the cell and the coil were housed in a quartz tube, equipped with a neighboring thermocouple to monitor the cell temperature. An extra Ni+GDC disk was adhered above the anode to activate the anode on-site. The geometry dimension of the system was summarized in Table 1.
Figure 1. Configurations of single-chamber solid oxide fuel cells (SOFC) and the anode-supported cell based on LDM electrolyte [4]
Table 1. Geometry dimensions
Dimensions Values (mm) Tube length
Tube diameter
Extra disk, anode, electrolyte diameter Extra disk, anode thickness
Cathode diameter Cathode thickness
Extra disk to anode distance Electrolyte thickness
45 15 13.5 0.55 9 0.027 0.15 0.06
The collection data is the cell voltage, the temperature of the furnace and the current density. The data sets were divided into training, validation and test subsets, each of which contains 70 %, 20%, 10% samples, respectively. The validation and test sets, for the evaluation of the validation and modeling power of the networks, were randomly selected from the experimental data.
2.2 Neural network modeling Artificial neural networks (ANNs) consist of an input layer, one or more hidden layers and an output layer [5]. The number of neurons in the input and output layers is equal to the number of inputs and outputs in the system to be modelled. The number of neurons in the hidden layer is determined by trial and error and is different from case to case. Each neuron is connected to all neurons in the next layer by means of weighted connections. Input to a neuron is determined as the weighted sum of its inputs. Output from a neuron is determined by transforming its input using a suitable transfer function. Once an output is calculated, it will be transmitted equally to all the neurons in the next layer. Input neurons do not transform their inputs; they just distribute them to all the neurons in the first hidden layer. Fig. 2 shows a feed forwardartificial neural network (2-5-1) structure with input of temperature and voltage.
Transfer functions can take any form and may be linear or non-linear. The most commonly used non-linear transfer function, which is also used in the present study, is the logistic sigmoid. The general form of the function is given as
( ) 1/ (1
x)
Figure 2Artificial neural network (2-5-1) structure In order to increase the efficiency of the network, all of the supplied input - output data were normalized between 0 and 1. Data (xi) are
converted to normalized value (xnorm) as follows
min
norm
max min
0.8
x
x
0.1
x
x
x
(1)where xmax and xmin are the maximum and
minimum actual experimental data, respectively. The performance of ANN was determined based on the values of mean squared error (MSE) and coefficient of determination (R2). They were respectively calculated as follows
2
1
1
(
)
n
i i i
MSE
t
a
n
(2)
2
i i
1 2
2 2
i i
1 1
n
i
n n
i i
t
t
a
a
R
t
t
a
a
(3)where n is the number of data points, ti is
the predicted value from the networks, ai is the
experimental response,
t
anda
are the average of predicted value and actual value, respectively.In our study, the network was trained using backpropagation algorithm. The maximum number of epochs, and minimum performance gradient are set to 400, and 10-5, respectively. Training stops when the maximum number of epochs is reached or when either the MSE or performance gradient is minimized to arrive at the pre-determined goal. Through a trial-and-error method, the optimal network structure for the current simulation is determined. The parameters of
the model from neural network were stored and used to optimize the power density using genetic algorithm in the next session.
2.3 Genetic algorithm
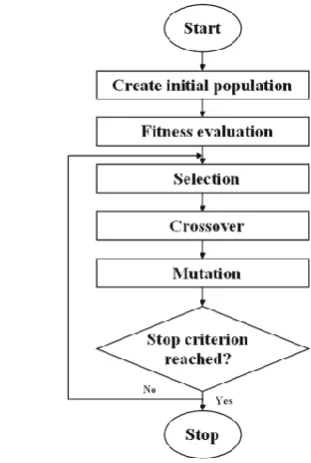
The genetic algorithms (GA), a member of evolutionary algorithms (EA), are adaptive heuristic search algorithms based on the evolutionary ideas of natural selection and genetics. The genetic algorithms start with randomly chosen parent chromosomes from the search space to create a population. The fitness of each chromosome was evaluated by objective function. The algorithms repeatedly modify a population of individual solutions similar to processes occurring in the nature − selection, recombination and mutation. The population “evolves” toward an optimal solution by the principles of "survival of the fittest". More details of the genetic algorithm can be found elsewhere [6]. A brief pseudo-code description of the GA approach is shown in Fig. 3.
Figure 3. Flow chart of genetic algorithm procedure
In this study, the objective function is the power density, which is determined as P=I × V.
selection was chosen as roulette wheel selection with elitism. The number of generations was set to be 500.
III. RESULTS AND DISCUSSIONS
3.1 Artificial neural network modeling
An artificial neural network was used for modeling the current density of the fuel cell. Experimental data obtained under different operating conditions were used to train and test the neural network model. The number of hidden neurons is crucial in ANN modeling, because too many neurons will result in over-fitting, however, too small number of neurons may not capture the information adequately [7]. After trial and error, the sufficient number of neuron in hidden layer was 5. Therefore, a 2-5-1 feed forward ANN structure was proposed in this study.
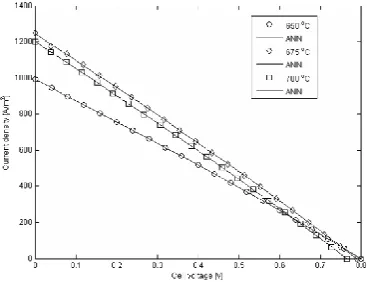
Figure 4. Comparison of V-I curve by ANN model and experimental results
The results of the ANN modeling are depicted as current versus cell voltage plots (or V–I curves) and are compared with experimental data as shown in Fig. 4. The comparison between the power density curve of ANN prediction and experimental results was also presented in Fig. 5. The estimation by ANN at the temperature of 660
o
C was also shown. From the comparison figures, it can be obtained that the results of the ANN modeling agree well with the experimental data and the tendency of the prediction is also reasonable. The correlation coefficient (R2) is nearly 1. The MSE values for two subsets (training and testing) were 4 10-7 and 4 10-4, respectively. These results confirm that the neural network model is able to adequately predict the SOFC behavior under different operating temperature.
Figure 5. Power density curve of ANN estimation and experimental data
3.2 Optimization by genetic algorithm
From the artificial neural network modeling results, genetic algorithm was employed to find the optimum condition for the power density. The decision parameters were temperature of the furnace and the cell voltage. The boundary constraint for the temperature and the cell voltage were [650,700] and [0,0.8], respectively.
From the results of optimization, the maximum fuel cell power density of 381.54 A/m2 could be achieved at the temperature of 687 oC and cell voltage of 0.44 V.
IV. CONCLUSIONS
In this study, an artificial neural network was successfully applied to model the behavior of a single planar button solid oxide fuel cell. The ANN model can adequately predict the SOFC performance and is validated with actual experimental data. The developed network has a simple architecture with a small number of neurons. The GA optimization technique was adopted to determine the optimal cell parameters such as operating temperature and cell voltage. The maximum power density is 381.54 A/m2 which is achieved at temperature of 687 oC and cell voltage of 0.44 V.
other parameters and can be utilized to control and monitor SOFC systems.
V. Acknowledgements
This research is funded by Ho Chi Minh City University of Technology – VNU-HCM under grant number T-KTHH-2016-39.
REFERENCES
[1] M. Yano, A. Tomita, M. Sano, and T. Hibino, Recent advances in single-chamber solid oxide fuel cells: A review,Solid State Ionics, 177(39–40),2007, 3351-3359. [2] S. Kakaç, A. Pramuanjaroenkij, and X.Y.
Zhou, A review of numerical modeling of solid oxide fuel cells,International Journal of Hydrogen Energy, 32(7), 2007, 761-786. [3] K. Wang, D. Hissel, M.C. Péra, N. Steiner,
D. Marra, M. Sorrentino, C. Pianese, M.
Monteverde, P. Cardone, and J. Saarinen, A Review on solid oxide fuel cell models,International Journal of Hydrogen Energy, 36(12), 2011, 7212-7228.
[4] J.-C. Lo, D.-S. Tsai, Y.-C. Chen, M.-V. Le, W.-H. Chung, and F.-J. Liu, La2Mo2O9
-Based Electrolyte: Ion Conductivity and Anode-Supported Cell under Single Chamber Conditions,Journal of the American Ceramic Society, 94(3), 2011, 806-811.
[5] J. Milewski and K. Świrski, Modelling the SOFC behaviours by artificial neural network,International Journal of Hydrogen Energy, 34(13), 2009, 5546-5553.
[6] R.L. Haupt and S.E. Haupt,Practical Genetic Algorithms(Wiley, 2004).