Vol. 5, No. 3 (2015): 1042-1049 Research Article
Open Access
I
ISSSSNN:: 22332200--66881100
Method Development and Validation of Cycloserine
in Human Plasma by Liquid Chromatography –
Tandem Mass Spectrometry
R V Valli Kumari* and P. Venkateswar Rao
Malla Reddy Institute of Pharmaceutical Sciences, Department of Pharmaceutical Analysis and Quality Assurance, Secunderabad,Telangana, India.
* Corresponding author: R V Valli Kumari; e-mail: [email protected]
ABSTRACT
A simple, precise and accurate high performance liquid chromatographic method with tandem mass spectroscopy method was developed for determination of cycloserine in human plasma by using cycloserine d4 as internal standard (IS). The analyte and internal standard were separated from human plasma by using liquid liquid extraction method. Chromatographic separation was carried on Hypurity advance C18 (4.6×100mm,5µm) column using 20mM ammonium acetate in 0.1% formic acid buffer and methanol in the ratio of 10:90%v/v. The run time for analysis was 3min. The analyte and internal standard were detected by mass spectrometry operating in positive ion and multiple reaction monitoring mode. The parent and product ion transitions monitored for cycloserine and internal standard were at m/z 409.24→237.97 and 413.28→237.97 respectively. The developed method was validated for selectivity, specificity, carry over effect, linearity, precision, accuracy, matrix effect and stability studies. The method was linear over the concentration range of 0.1-19.9ng/ml with correlation coefficient of 0.999. The inter batch and intra batch precision (%CV) across six quality control samples was less than 5%. The percent recovery of cycloserine and internal standard from matrix samples was found to be 76.41 and 73.28% respectively. The developed method was successfully applied for the determination of cycloserine in marketed formulation.
Keywords:
LC-MS/MS, cycloserine, cycloserine d4, validation.1. INTRODUCTION
Cycloserine is a broad spectrum of antibiotic that is produced by a strain of Streptomyces orchidaceae. It may be bactericidal or bacteriostatic, depending on its concentration at the site of infection and the susceptibility of the organism. Chemically it is (R)-4-amino, 1, 2-oxazolidin 3-one (Figure.1) [1-2]. It has an empirical formula of C3H6N2O2 and a molecular weight
of 102.092g/mol. It works as an antibiotic by inhibiting cell wall biosynthesis in bacteria. Cycloserine is an analog of the amino acid D-alanine, acts against two crucial enzymes, L-alanine racemase and D-alanylalanine synthetase important in the cytosolic stages of peptidoglycan and cell wall synthesis. It is used in the treatment of pulmonary and extra pulmonary tuberculosis, UTI’s caused by susceptible bacteria and gaucher disease [2, 3].
Cycloserine is readily absorbed after oral dosing from the gastrointestinal tract with peak plasma levels occurring in 4-8 hrs and bioavailability of 70-90%. Blood levels of 25-30µg/ml can be generally maintained with the usual dose of 250mg. the elimination half-life is 10hrs. 60-70% of unchanged drug is excreted through urine by GFR with in 72hrs [3].
Literature survey [3-4] reveals that very few methods were developed for the quantification of cycloserine in pharmaceutical and biological fluids. However, LC-MS/MS has played an important role for the quantitative estimation of drugs in biological matrices including plasma, serum and urine. The aim of proposed method is to develop the simplest, sensitive, high recovery and selective method with proper internal standard usage.
Figure 1: Structure of Cycloserine
2. MATERIALS AND METHODS
2.1 Instrumentation:
an Agilent 1200 series LC system equipped with degasser (G1322A), binary pump(G1311A), autosampler(G1329A) was used to inject 20µl of the samples on a Hypurity advance C18 column
(4.6×100mm, 5µm) which was kept at ambient temperature of 40ºC. The ion source was heated nebulizer operating in positive ion mode. A mixture of buffer and methanol in the ratio of 10:90%v/v was degassed ultrasonically for 5min. The flow rate of mobile phase was 0.85ml/min.
2.2 Mass spectrometry operating conditions:
The common mass parameters, detection of ions were performed by using scan type of multiple reaction monitoring (MRM) operating in positive mode. The MRM transitions for cycloserine and internal standard were observed at m/z 409.24→237.97 and 413.28→237.97 respectively.
The analytical data were processed by using LC solutions software. The quadrouple mass analyzer, Q1
was set at low resolution and Q3 was at unit resolution.
The compound dependent parameters like curtain gas, DE clustering potential, collision cell exit potential and entrance potential were 25psi, 35v, 13v and 10v respectively.
2.3 Preparation of standard stock and plasma samples:
The cycloserine standard stock solution of 9994.5ng/ml was prepared by dissolving required quantity in methanol. This was further diluted with methanol to get a concentration of 999.5ng/ml. the spiked calibration curve standards (CC) and quality control samples (QC) were prepared by using standard stock and intermediate stock solution in 60% methanol in water. The internal standard (IS) stock solution was prepared by dissolving 2.573mg in methanol. This was further diluted with methanol to get a concentration of 25ng/ml. all the solutions were stored at -20ºC. The CC standards and QC samples were prepared by spiking human plasma with respective working solutions. CC standards were prepared at 0.1, 0.2, 0.5, 1.9, 4.997, 9.995, 14.992 and 19.989n/ml for cycloserine. QC maples were prepared at 0.1ng/ml (LLOQ QC), 0.3ng/ml (LQC), 7.998ng/ml (MQC) and 15.996ng/ml (HQC) concentrations as shown in the table.1&2. All the spiked samples were stored at -20ºC for sample analysis and validation.
Table 1: Calibration curve standards
Stock Conc.
(ng/mL) Volume of Stock(mL) Volume of Plasma(mL) Final Volume (mL) Final Conc. (ng/mL) Label
999.453 0.060 2.940 3.000 19.989 CC8
749.590 0.060 2.940 3.000 14.992 CC7
499.727 0.060 2.940 3.000 9.995 CC6
249.863 0.060 2.940 3.000 4.997 CC5
99.945 0.060 2.940 3.000 1.999 CC4
24.986 0.060 2.940 3.000 0.500 CC3
9.995 0.060 2.940 3.000 0.200 CC2
4.997 0.060 2.940 3.000 0.100 CC1
Table 2: Quality control samples
Stock Conc.
(ng/mL) Volume of Stock(mL) Volume of Plasma(mL) Final Volume (mL) Final Conc. (ng/mL) Label
799.792 0.500 24.500 25.000 15.996 HQC
399.896 0.200 9.800 10.000 7.998 MQC
74.981 0.200 9.800 10.000 1.500 GMQC
14.996 0.500 24.500 25.000 0.300 LQC
4.999 0.100 4.900 5.000 0.100 LLOQ
2.4 Sample preparation:
Prior to analysis, blank, calibration standards and QC samples were withdrawn from the deep freezer and thawed. The samples were vortexes to ensure complete mixing of contents. 20µl of 60% methanol in water was added to a ria vial which is labeled as blank. 20µl of IS (25ng/ml) was added to the pre labeled ria vials (except plasma blank), then transferred 0.25ml of plasma to all the above samples from the respective samples. 0.25ml of 0.5% ammonia solution was added to all the above samples and vortexed again. 2.5ml of
shaker for 15min. Centrifugation of above vials was done for 10min at 4000rpm at 20ºC. Transferred 2ml of the supernatant into another prelabelled ria vial. Evaporated under a stream of nitrogen gas at 40ºC. Reconstituted the residue with 0.2ml of mobile phase and inject 20µl of solution into LC-MS/MS system.
2.5 Validation Procedures:
method validation. The carryover effect of the autosampler was performed by injecting a sequence of injections consisting of standard, reconstituted solution, standard blank and extracted standard equivalent to highest standard in the CC alternatively to check there is any carryover in the bank sample. The selectivity of the method was established by checking the blank K2EDTA human plasma, K2EDTA lipemic
plasma and K2EDTAhaemolytic plasma obtained from 8
different donors. Also spiked six samples at LLOQ concentration of cycloserine and IS in plasma of one donor from above plasmas (except hemolytic and lipemic plasmas). Compare the response of analyte and IS in blanks with the mean response of injected LLOQ. The matrix effect for the intended method was assessed by using chromatographically screened human plasma concentrations equivalent to LQC and HQC prepared with six different lots. The linearity of the method was determined by using a 1/x2 weighted least square
regression analysis of standard plots associated with a 8 point standard curve. The intra and inter day accuracy and precision were determined by analyzing 6 replicates of LQC, GMQC, MQC and HQC in a single day and between two consecutive days respectively. The precision (%CV) at each concentration level should not be more than 15% except for LLOQ QC where it should be 20%. The accuracy (%) must be within +15%of their nominal value except for LLOQ QC where it should be within +20%. The percentage mean recoveries were determined by measuring the concentrations of the extracted plasma QC samples at HQC, GMQC, MQC and LQC against unextracted QC samples. Reinjection reproducibility was performed by analyzing 6 replicates of LQC and HQC samples. Stability results were assessed by measuring the area response of stability samples against freshly prepared LQC and HQC samples. Freeze thaw stability was estimated after 3 cycles of freezing and thawing of samples at -20ºC. In-
injector stability was determined by keeping the samples in the autosampler at 15ºC and analyzed after 29hrs under a fresh calibration curve. Wet extract and dry extract stability were evaluated by reconstituting and evaporating the samples kept on the bench at ambient temperature and analyzed after 18hrs. Dilution integrity was determined by using 1/5 dilution of ULOQ (CC8) against calibration curve standards [5, 6].
3. RESULTS AND DISCUSSION
3.1 Optimization of liquid chromatography and mass spectrometry conditions:
For complete chromatographic resolution of cycloserine and IS, several solvents such as acetonitrile, methanol, different buffers and mixture of solvents were tried along with different flow rates. Finally the resolution of peaks was achieved with 20mM ammonium acetate in 0.1% formic acid buffer: methanol in the ratio of 10:90%v/v using HyPurity advance C18 column (4.6×100mm, 5µm). The flow rate
was 0.85ml/min. Following mass spectrometric conditions, precursor ion to the parent ion transitions for cycloserine and IS were at m/z 409.24→237.97 and
413.28→237.97 respectively was used for
quantification purpose.
3.2 METHOD VALIDATION PARAMETERS: 3.2.1 System suitability:
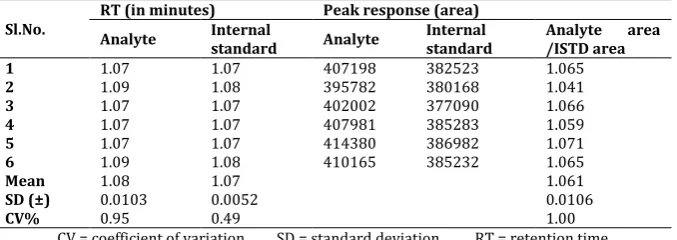
System suitability experiment was carried out by injecting 6 consecutive samples of aqueous mixture of drug and IS. The %CV of system suitability was observed in the range of 0.95 and 0.49 for drug and IS respectively which is not more than 5% as per the acceptance criteria. The results were shown in the following table 3.
Table 3: Results of system suitability
(Column ID: Hypurity advance 4.6×100mm, 5µm, column number: VLS-BA/CL/001)
Sl.No. RT (in minutes) Analyte Internal Peak response (area)
standard Analyte Internal standard Analyte area /ISTD area
1 1.07 1.07 407198 382523 1.065
2 1.09 1.08 395782 380168 1.041
3 1.07 1.07 402002 377090 1.066
4 1.07 1.07 407981 385283 1.059
5 1.07 1.07 414380 386982 1.071
6 1.09 1.08 410165 385232 1.065
Mean 1.08 1.07
1.061
SD (±) 0.0103 0.0052 0.0106
CV% 0.95 0.49 1.00
CV = coefficient of variation SD = standard deviation RT = retention time
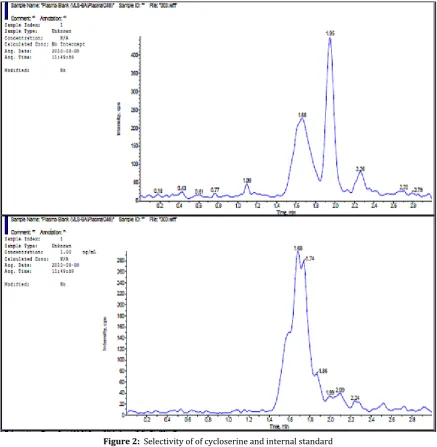
3.2.2 Selectivity and specificity:
The selectivity of the present method was established by checking any interfering compounds that elute along with cycloserine. The response of analyte and IS in blanks was compared with the mean response of injected LLOQ. Hence there were no interfering peaks formed at cycloserine retention time and IS retention time in the plasma blanks. Figure: 2 shows
representative chromatograms of K2 EDTA blank
human plasma samples.
Figure 2: Selectivity of of cycloserine and internal standard
Table 4: Specificity of cycloserine and internal standard
Sample ID Cycloserine Peak area ISTD Peak area % interference at RT of Cycloserine % interference at RT of ISTD
Blank + ISTD-01 Cycloserine d4) 0 64846 0.00 NA
Blank + ISTD-02 0 63264 0.00 NA
Blank + ISTD-03 0 71609 0.00 NA
Blank + ISTD-04 0 62141 0.00 NA
Blank + ISTD-05 0 68026 0.00 NA
Blank + ISTD-06 0 64872 0.00 NA
Sp.MQC- 1(Cycloserine) 238066 0 NA 0.00
Sp.MQC- 02 237926 0 NA 0.00
Sp.MQC- 03 236058 0 NA 0.00
Sp.MQC- 04 230085 0 NA 0.00
Sp.MQC- 05 339959 0 NA 0.00
Sp.MQC- 06 246007 0 NA 0.00
3.2.3 Carry over effect:
The sequence of injections containing two blank samples and two samples of ULOQ concentration were analyzed alternately to check if there is any carry over affecting the blank sample. There was no carryover effect observed in the present method.
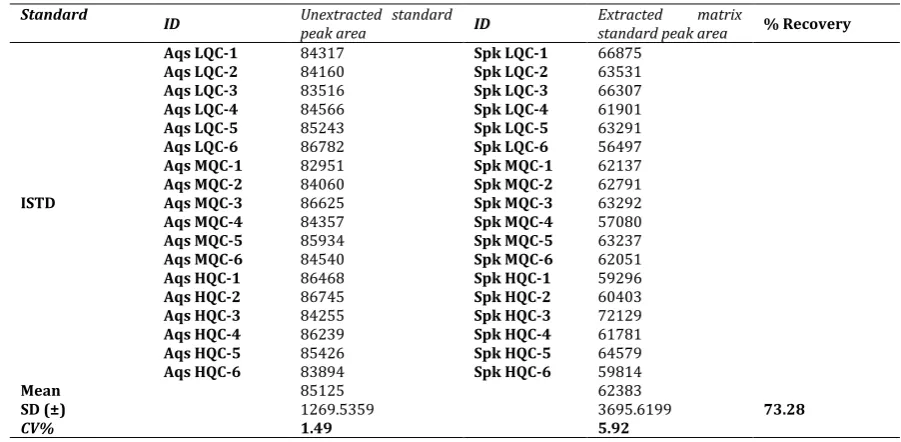
3.2.4 Recovery:
Table 5: Recovery of cycloserine from matrix samples
Standard ID Unextracted standard peak area ID Extracted matrix standard
peak area % Recovery
LQC
Aqs LQC-1 11864 Sp. LQC-1 9927
Aqs LQC-2 12175 Sp. LQC-2 10161
Aqs LQC-3 12161 Sp. LQC-3 9635
Aqs LQC-4 11624 Sp. LQC-4 9621
Aqs LQC-5 12271 Sp. LQC-5 9282
Aqs LQC-6 12067 Sp. LQC-6 8656
Mean 12027 9547
79.38
SD (±) 240.8211 528.9087
CV% 2.00 5.54
MQC
Aqs MQC-1 325789 Sp. MQC-1 238246
Aqs MQC-2 319761 Sp. MQC-2 239919
Aqs MQC-3 330287 Sp. MQC-3 238717
Aqs MQC-4 325119 Sp. MQC-4 237767
Aqs MQC-5 322714 Sp. MQC-5 257750
Aqs MQC-6 317479 Sp. MQC-6 238087
Mean 323525 241748
74.72
SD (±) 4577.5694 7875.4237
CV% 1.41 3.26
HQC
Aqs HQC-1 681208 Sp. HQC-1 475249
Aqs HQC-2 650176 Sp. HQC-2 479535
Aqs HQC-3 664010 Sp. HQC-3 565939
Aqs HQC-4 670455 Sp. HQC-4 482760
Aqs HQC-5 648064 Sp. HQC-5 519693
Aqs HQC-6 661662 Sp. HQC-6 463157
Mean 662596 497722
75.12
SD (±) 12461.7623 38446.5533
CV% 1.88 7.72
Mean (Avg. of 3 means) 76.41
Table 6: Recovery of IS from matrix samples.
Standard ID Unextracted standard
peak area ID Extracted matrix standard peak area % Recovery
ISTD
Aqs LQC-1 84317 Spk LQC-1 66875
Aqs LQC-2 84160 Spk LQC-2 63531
Aqs LQC-3 83516 Spk LQC-3 66307
Aqs LQC-4 84566 Spk LQC-4 61901
Aqs LQC-5 85243 Spk LQC-5 63291
Aqs LQC-6 86782 Spk LQC-6 56497
Aqs MQC-1 82951 Spk MQC-1 62137
Aqs MQC-2 84060 Spk MQC-2 62791
Aqs MQC-3 86625 Spk MQC-3 63292
Aqs MQC-4 84357 Spk MQC-4 57080
Aqs MQC-5 85934 Spk MQC-5 63237
Aqs MQC-6 84540 Spk MQC-6 62051
Aqs HQC-1 86468 Spk HQC-1 59296
Aqs HQC-2 86745 Spk HQC-2 60403
Aqs HQC-3 84255 Spk HQC-3 72129
Aqs HQC-4 86239 Spk HQC-4 61781
Aqs HQC-5 85426 Spk HQC-5 64579
Aqs HQC-6 83894 Spk HQC-6 59814
Mean 85125 62383
73.28
SD (±) 1269.5359 3695.6199
CV% 1.49 5.92
3.2.5 Linearity, accuracy and precision:
The calibration curve was constructed using 8 calibration standards ranging from 0.1ng/ml to 19.989ng/ml. a straight line fit was made through the data points by 1/x2 weighing method. The correlation
coefficient was found to be ≥0.999. the lower limit of quantification (LLOQ) was found to be 0.1ng/ml. The sensitivity results were shown in following table.7. the
Figure 4: Precision and accuracy of LQC Figure 4: Precision and accuracy of GMQC
Figure 6: Precision and accuracy of MQC Figure 7: Precision and accuracy of HQC
Table 7: Precision and accuracy for LOQ (sensitivity).
ID LOQ (ng/mL) % Accuracy
LLOQ-01 0.098 97.83
LLOQ-02 0.085 84.88
LLOQ-03 0.091 91.23
LLOQ-04 0.090 89.58
LLOQ-05 0.087 87.30
LLOQ-06 0.092 92.07
Mean 0.091
SD (±) 0.0045
CV% 4.95
% Accuracy 91.00
Table 8: Inter batch precision and accuracy (global statistics for three P&A batches).
Batch ID LQC (ng/mL) GMQC (ng/mL) MQC (ng/mL) HQC (ng/mL)
I
P&A-01 0.299 1.391 7.771 14.558
P&A-02 0.309 1.381 7.513 15.185
P&A-03 0.299 1.386 7.548 15.386
P&A-04 0.291 1.364 7.962 14.439
P&A-05 0.308 1.393 7.406 14.854
P&A-06 0.300 1.394 7.443 15.768
II
P&A-07 0.290 1.488 8.099 16.514
P&A-08 0.295 1.502 7.869 15.743
P&A-09 0.296 1.480 7.870 16.033
P&A-10 0.301 1.479 8.008 16.273
P&A-11 0.308 1.519 8.024 15.483
P&A-12 0.297 1.482 8.325 16.232
III
P&A-13 0.303 1.536 7.730 15.933
P&A-14 0.293 1.453 7.890 16.432
P&A-15 0.300 1.488 7.817 16.182
P&A-16 0.291 1.466 8.002 15.929
P&A-17 0.305 1.463 7.996 16.378
P&A-18 0.304 1.509 7.653 16.210
Mean 0.299 1.454 7.829 15.752
SD (±) 0.0060 0.0544 0.2453 0.6398
CV% 2.01 3.74 3.13 4.06
% Accuracy 99.67 96.93 97.89 98.47
Actual Conc. (ng/mL) 0.300 1.500 7.998 15.996
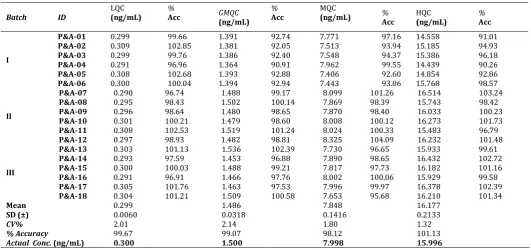
Table 9: Intra batch precision and accuracy (global statistics for three P&A batches).
Table 10: Stability data of quality control samples in human plasma
Nominal
concentration(ng/ml) stability Mean±SD (n=6)
(ng/ml)
Accuracy (%) Precision(%CV)
LQC
(0.3ng/ml) 3
rd freeze thaw
18h bench top 29h in-injector 24h dry extract 24h wet extract Re-injection reproducibility 0.304±0.0048 0.307±0.0094 0.309±0.0079 0.305±0.0057 0.311±0.0127 0.305±0.0080 101.33 102.33 103 101.67 103.67 101.67 1.58 3.06 2.56 1.87 4.08 2.62 HQC
(19.989ng/ml) 3
rd freeze thaw
18h bench top 29h in-injector 24h dry extract 24h wet extract Re-injection reproducibility 16.556±0.3035 16.299±0.1884 16.321±0.2964 16.363±0.2820 16.425±0.1650 16.594±0.2830 103.50 101.89 102.03 102.29 102.68 103.74 1.83 1.16 1.82 1.72 1.00 1.71
Batch ID LQC (ng/mL) % Acc GMQC (ng/mL) Acc % MQC (ng/mL) % Acc HQC (ng/mL) % Acc
I
P&A-01 0.299 99.66 1.391 92.74 7.771 97.16 14.558 91.01
P&A-02 0.309 102.85 1.381 92.05 7.513 93.94 15.185 94.93
P&A-03 0.299 99.76 1.386 92.40 7.548 94.37 15.386 96.18
P&A-04 0.291 96.96 1.364 90.91 7.962 99.55 14.439 90.26
P&A-05 0.308 102.68 1.393 92.88 7.406 92.60 14.854 92.86
P&A-06 0.300 100.04 1.394 92.94 7.443 93.06 15.768 98.57
II
P&A-07 0.290 96.74 1.488 99.17 8.099 101.26 16.514 103.24
P&A-08 0.295 98.43 1.502 100.14 7.869 98.39 15.743 98.42
P&A-09 0.296 98.64 1.480 98.65 7.870 98.40 16.033 100.23
P&A-10 0.301 100.21 1.479 98.60 8.008 100.12 16.273 101.73
P&A-11 0.308 102.53 1.519 101.24 8.024 100.33 15.483 96.79
P&A-12 0.297 98.93 1.482 98.81 8.325 104.09 16.232 101.48
III
P&A-13 0.303 101.13 1.536 102.39 7.730 96.65 15.933 99.61
P&A-14 0.293 97.59 1.453 96.88 7.890 98.65 16.432 102.72
P&A-15 0.300 100.03 1.488 99.21 7.817 97.73 16.182 101.16
P&A-16 0.291 96.91 1.466 97.76 8.002 100.06 15.929 99.58
P&A-17 0.305 101.76 1.463 97.53 7.996 99.97 16.378 102.39
P&A-18 0.304 101.21 1.509 100.58 7.653 95.68 16.210 101.34
Mean 0.299 1.486 7.848 16.177
SD (±) 0.0060 0.0318 0.1416 0.2133
CV% 2.01 2.14 1.80 1.32
% Accuracy 99.67 99.07 98.12 101.13
3.2.6 Stability:
The predicted concentrations for cycloserine at LQC and HQC samples deviated with in ±15% of nominal concentration in stability tests i.e. in - injector stability (29hrs), bench top (18hrs), repeated three freeze thaw cycles, 24hrs of wet extract and dry extract stability.
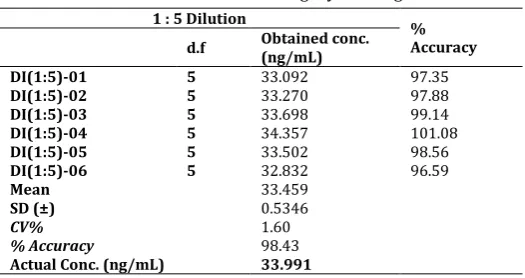
The results were found to be within the acceptance limits during the entire process (Table 10). Dilution integrity was performed by taking 1/5 dilution of ULOQ concentration (33.991ng/ml). The percentage accuracy and %CV were found to be within the acceptance criteria (Table 11).
Table 11: Dilution integrity for drug
1 : 5 Dilution %
Accuracy d.f Obtained conc. (ng/mL)
DI(1:5)-01 5 33.092 97.35
DI(1:5)-02 5 33.270 97.88
DI(1:5)-03 5 33.698 99.14
DI(1:5)-04 5 34.357 101.08
DI(1:5)-05 5 33.502 98.56
DI(1:5)-06 5 32.832 96.59
Mean 33.459
SD (±) 0.5346
CV% 1.60
% Accuracy 98.43
Actual Conc. (ng/mL) 33.991
4. CONCLUSION
A LC-MS/MS method was developed for the determination of cycloserine in human plasma by using simple liquid - liquid extraction method. The method is simple, rapid, selective, specific and shows good accuracy and precision. The present method is very sensitive with an LLOQ of 0.1ng/ml when compared with the published methods. This method can be used for routine analysis of determination of cycloserine in human plasma by using LC-MS/MS method.
5. REFERENCES
1. The drugs and cosmetics act and rules, 1940
2. Cycloserine drug profile –
http://www.drugbank.ca/drugs/DB0543
3. Dinesh S Patel, Naveen Sharma and Mukesh Patel: development and validation of selective and sensitive LC-MS/MS method for determination of cycloserine in human plasma – Application to Bioequivalence study, Journal of Chromatography B, volume 879, Issue 23, pages: 2265-2273.
4. Yaroshanko, Dmitry, Alexander: Development and validation of LC-MS/MS method for d-cycloserine determination in human plasma for bioequivalence study, Analytical and Bio analytical Chemistry, volume 406, Issue 3, P 923.
5. US DHHS, FDA, CDER. Guidance for industry: Bio analytical Method Validation.
6. http://en.wikipedia.org/wiki/cycloserine.
7. Braggio S., Barnaby R.J., Grosi P., Cugola M., A strategy for validation of bio analytical methods, Journal of Pharmaceutical and Biomedical Analysis 1996,14,375-388. 8. Causon Roger, Validation of Chromatographic methods in
Biomedical analysis view point & Discussion, Journal of Chromatography B, 689(1997) 175-180.
9. FDA submitting Documentation for the stability of human drugs and biologics, CDER, Feb 1987.
*****