ICT Infrastructure Sharing Framework for Developing
Countries: Case of Mobile Operators in Kenya
(
Charles B. Malungu
)(
School of Computing and Informatics)
(
University of Nairobi) (Box 30197- 00100, Nairobi, Kenya)
(
Christopher A. Moturi
)(School of Computing and Informatics)
(
University of Nairobi) (Box 30197- 00100, Nairobi, Kenya)
ABSTRACT
(The lack of infrastructure in Africa especially south of the
Sahara is widely recognized as one of the continent’s greatest impediments to sustainable development )[(1)]. Even with this
challenge, ICT operators in Kenya prefer to invest in own infrastructure despite the availability of underutilized ICT resources from other operators and players. This has led to wastage of scarce resources, high cost of services, poor quality services, environmental degradation and low investment in rural areas among others. The research sought to propose an adoption framework for ICT infrastructure sharing for mobile operators in Kenya after establishing the levels, drivers and challenges of infrastructure sharing. Data was collected from ICT staff of the four mobile operators Safaricom, Airtel, Essar and Telkom Kenya Orangeacross the country using a questionnaire. To supplement and increase reliability, data was also collected from other ICT stakeholders such CAK, ICTA, submarine operators, ICT vendors, KBC and non ICT related firms Equity, Barclays and Kenya Power Company. The research found out that the level of ICT infrastructure sharing among mobile operators was low at 20.4%. The five key drivers were identified as new market entrants, cost optimization, environmental conservation, operators focus on core business and network deployment to underserved and un served areas. The five main challenges were lack of regulatory framework, high capital, complexity of the sharing process, high charges by infrastructure owners and operators unwillingness to share. The TOE framework can be adopted for ICT infrastructure sharing with organizational factors having a greater influence than technology and external factors. Operator controlled infrastructure rollout had worked previously but due to changes in local and global market, there was need to change the way ICT resources were utilized. To achieve quick wins, operators had to partner with competitors by leasing and undertaking joint ventures. Infrastructure sharing was beneficial hence strategies to promote the same by use of incentives license fee and tax concessions, having a legal framework, government investment in backbone infrastructure and attracting independent firms will ensure competitiveness and a knowledge economy status
General Terms
Mobile communications, ICT infrastructure
Keywords
ICT infrastructure sharing framework, Mobile operators cost optimization, TOE framework
1.
INTRODUCTION
Information and communication technologies are fundamental and essential infrastructure for poverty reduction, high productivity, economic growth, improved accountability and governance [2]. The lack of infrastructure in Africa especially South of the Sahara is widely recognized, one of the continent’s greatest impediments to sustainable development [1]. Even with this challenge, ICT operators in Kenya still prefer to invest in their own infrastructure despite the availability of underutilized ICT resources from other operators and other players such as utility companies. ICT infrastructure sharing is defined as having two or more operators coming together to share various parts of their network infrastructure for the purposes of their service provisioning [3] [4] [5] [6]. The main objective of infrastructure sharing is to optimize the scarce resources, maximize on economic returns on investments and the development of business models that focus on affordable and accessible ICT services [3] [7] [8]. ICT operators have been sharing infrastructure especially for international telecommunication traffic satellite and submarine fiber cables. In Canada infrastructure sharing began in the 1950s, when cable operators began deploying cable television networks. In the USA, national infrastructure open access was mandated in 1970s to fast track cable television industry growth. The emergence of the mobile virtual network operators MVNO a form of active sharing, began in 1999 by the establishment of the first MVNO, Virgin Mobile, in United Kingdom targeting companies with established brand name [9]. Earlier successful infrastructure sharing initiatives among African countries include the Pan African Telecommunications Network PANAFTEL interconnecting 28 African countries using shared bandwidth on microwave transmission spanning 20,000km and the Regional African Satellite Communications System RASCOM whose objective was to foster the socioeconomic development of African countries by having a dedicated African satellite system that could lower communication costs by routing African traffic via Africa instead of Europe. Another initiative to launch shared African submarine cable under Africa one project failed to materialize [10] [11] [12].
framework. Communication Commission of Kenya strategic plan 2013 – 2018 is also committed to promoting environmental sustainability through development of guidelines for infrastructure sharing, co-location, green ICT and mainstream environmental sustainability within the ICT sector. The Kenya national broadband strategy 2013-2017 vision is to transform Kenya to a knowledge-based society and recognizes the need for optimization of ICT infrastructure through sharing and the development of policy framework for open access by all to the national backbone networks [14] [37] [38]. Successive infrastructure sharing examples in Kenya are Pesapoint and Kenswitch where participating financial institutions share payment infrastructure, a government funded fiber project NOFBI, Kenya power fiber network, Kenya internet exchange point. Globally infrastructure sharing has been successfully implemented in USA, Pakistan and India [16] [17].
2.
STATEMENT OF PROBLEM
The lack of infrastructure in Africa especially south of the Sahara is widely recognized as one of the continent’s greatest impediments to sustainable development [1]. As a result,ICT operators have been investing heavily in own infrastructure even where there was availability of resources from other operators, utility companies and municipalities. They have also focused mostly in urban areas. This had led to underutilization of scarce resources, inaccessible of ICT services to a section of the population, incidences of network vandalism and sabotage as operators compete to attract more customers, environmental degradation power generators, trenches, radiation, health hazard, proximity of towers close to each other and unaffordable services due to high cost of network deployment and long payback periods of 10 to 15 years [18] [19] [25].
2.1 Research objectives
i. Determine the extent of infrastructure sharing among mobile operators in Kenya.
ii. Determine drivers of infrastructure sharing among mobile operators in Kenya.
iii. Establish main challenges of infrastructure sharing among mobile operators in Kenya.
iv. Assess if the TOE framework can be adopted for ICT infrastructure sharing.
3.
RELATED WORK
3.1 Levels of infrastructure sharing
Mobile communication infrastructure sharing levels differ globally with high levels more evident in Europe, USA and India. In Austria about 50% of sites had been shared by the end of 2009 while in Sweden 70% of the sites had been shared by end of 2011. In India it was estimated that out of the total 300, 000 sites, 60% had been shared with an average tenancy of 1.5. Operators such as Indus had a tenancy ratio of 1.71x, Bharti Infratel 1.62x and WTTIL Quippo 1.84x. The USA had an average tenancy ratio of 2.5x [17]. Amongst mobile operators in Pakistan, Waridi had the highest tenancy ratio of 1.44 followed by Ufone 1.3 [16]. Europe, Australia and North America had seen growth in the mobile virtual network operators MVNOs, with more than 760 MVNOs active globally. The growth for the MVNO model in the Middle East and Africa MEA region was still low and at infancy stage with the two regions having 8 and 4 active MVNO
2014 with major players being IHS Africa with 20,000 sites, American towers with 5136, Helios TA with over 7800, Eaton with over 5070 and Swap technologies with 1459 sites managed and owned. Ghana had the highest concentration of independent tower firms [22].
3.2 Drivers of infrastructure sharing
The main drivers of infrastructure sharing among mobile operators were capital cost capex and operational expenditure opex savings, the rise in demand for mobile broadband services offered on 3G/4G -LTE technologies and their licensing constraints, the need for new market entrants to quickly increase coverage and to lower the cost of deploying ICT so as to achieve widespread affordable access to broadband services [23]. Infrastructure sharing generated extra revenue estimated at 10% of the total annual revenue, reduced infrastructure costs by 40-60%, offered better use of scarce spectrum resource, enabled easy market entry by new players hence increasing competition in the industry, improved innovation and better customer service hence addressing a decline in ARPU, achieved universal service goals by expanding network to underserved or rural areas to meet policy and regulator targets, minimized environmental degradation due to reduced network build up, resulted in higher uptime due to diversity routes, led to cost and energy efficiencies due to reduced emissions and diesel consumption hence improved green concept [3] [19] [20] [24] [25]. Infrastructure sharing can also be used to bridge the digital divide, meet regulatory requirements and help governments to achieve ICT services universal access goals [4]. Infrastructure deployment came with multiple risks and by sharing infrastructure the risks were reduced among cooperating operators. Sharing encourages scarce national resources optimization such as rights of way and spectrum hence availing the freed resources for strategic use [5] [26]. The rationale for infrastructure sharing differed between markets. For mature markets, sharing provided an additional source of revenue, minimized operating costs, added capacity in congested areas with limited space and towers. For developing markets, infrastructure sharing expanded network coverage and fast tracked on marketing strategies. ICT operators sharing infrastructure from the start of network rollout especially 3G/4G had an opportunity to reduce capital and operational expenditure [9] [27]. Capital and operational expenditure capex and opex analysis show a difference between developed and emerging markets. In some emerging markets, fuel was a key cost component since sites were either not connected to a power grid or the power grid was unreliable hence requiring diesel generators. The valuation of tower build up capex varied significantly across markets with costs ranging from 150,000 USD to 173,000 USD per tower. This could explain why the developed countries shared sites to reduce opex [20] [28]. Financial management consultants, KPGM and BOOZ & CO estimated revenue generated at 15% of total revenue, savings of 30 to 40%. The total amount of capex savings achieved from tower sharing in the Middle East and Africa regions was estimated to be USD 8 billion [29] [30].
investments and retain monopoly in certain areas, lack of network capacity, use of different vendors and poor quality of service [18] [24] [26]. Increased inter dependency especially for active sharing could also limit competition. In emerging markets there were hurdles of obtaining clearance from multitude of governmental bodies [29].
Network sharing had some risks such as projects implementation, third-party interests, and confidentiality risks which required to be managed to achieve success [3] [8]. Active sharing required close commercial cooperation between operators which could impede competition. Mobile virtual network operator concept was still at infancy stage in Africa due to regulatory issues, low ARPU and high interconnection charges by incumbent operators [18] [30] [31] [35]. Lack of regulatory framework to guide operators and ensure fair competition was also another barrier. The Kenya Information and Communications law of 2009 CAP. 411A section 85A recognizes infrastructure sharing but was not specific on the implementation guidelines as compared to Tanzania and Botswana which had a comprehensive infrastructure sharing law.
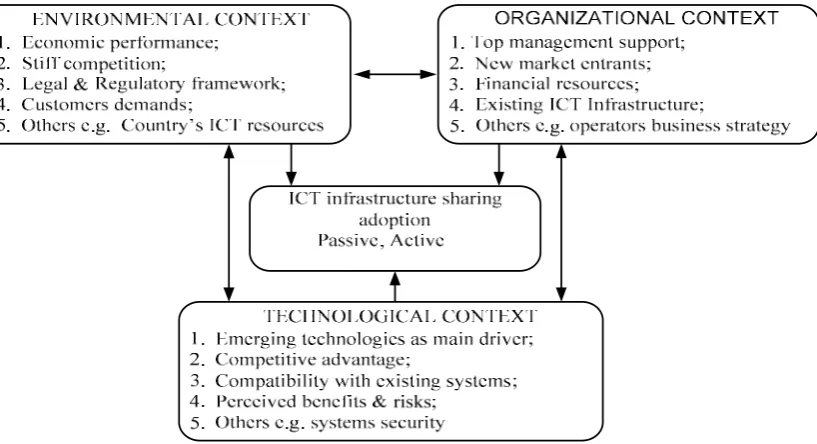
3.4 TOE framework
Technology, Organization, and Environment TOE framework Tornatzky and Fleischer 1990 identifies three aspects contexts that describe the organizational components that affect the firm’s adoption decisions: Technological context, Organizational context and Environmental context. Technological context describes both the internal and external technologies relevant to the firm the existing technologies in use and new technologies available to the organization. Organizational context refers to descriptive measures about the organization such as scope, size, and managerial structure while the environmental context is the arena in which a firm conducts its business and its industry, competitors, and dealings with the government [32]. Borgman et al., used TOE Framework to focus on factors influencing cloud computing adoption and how IT governance processes and structures moderate those factors. The study found out that cloud computing was a convenient means to address capital and operating expenditures with technology and organization context factors influencing organizations decision to adopt cloud computing. A high perceived relative advantage of cloud computing, a high level of top management support and a high competition intensitymeasured as a short lifecycle of products/services in the industry were the three factors positively linked to the decision to adopt cloud computing [33]. The TOE framework has a solid theoretical Diffusion of innovations Rogers 1995, basis and specific constructs within the three contexts that may vary or can be modified across different studies such as open systems, internet, e-commerce, ERP and e-business [32]. Cloud computing and ERP operate on the principle of shared resource and cost optimization same concept is applicable to ICT infrastructure sharing among mobile operators. ICT Infrastructure is a scarce resource that requires to be optimized by operators in order to deliver value. The mobile service providers operates in a dynamic environment technology changes e.g. 3G/4G-LTE, high obsoleteness, market saturation, regulatory issues, stiff competition and as such, they have to innovate to remain competitive lower cost of service to attract more customers, increase coverage/capacity by utilizing excess bandwidth from competitors.
4.
RESEARCH METHODOLOGY
The study employed quantitative study design using questionnaires to collect data from ICT staff of the four mobile operators and other stakeholders. A total of 19 organizations with a sample size of 170 were targeted with 125 17 organizations responding. Sample distribution was based on mobile operators’ market share. 76% of the data was collected from the four mobile operators. Both hardcopy and soft copies were used. A five level likert scale with weights ranging from 1-5 was used to evaluate the level of agreement or disagreement. Percentages were used to find the level of agreement sum of respondents for strongly agree and agree. Data was analyzed using SAS and excel.
Table 1: Sample distribution
Organization Market share Sample size
Safaricom 66.5 45
Airtel 17.6 30
Essar 8.8 25
Telkom Kenya 7.1 25
Others stakeholders NA 45
Total 170
Source: Researcher & CAK, 2014
5.
FINDINGS
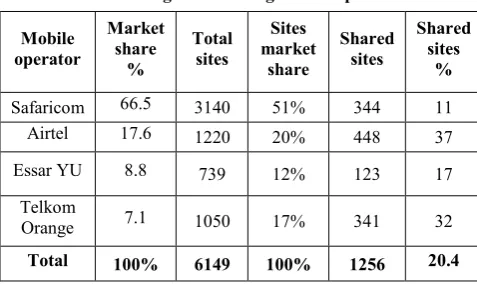
Theresearch established that operators mostly shared passive infrastructure sites and optic fiber. Optic fiber lead capacity and dark fiber were used to provide services and in some cases to improve network reliability through redundancy routes. The common shared infrastructure was found to be compounds, equipment rooms, security, towers, power commercial, generator, batteries, air conditioners, ducts, trenches and fiber cores and wavelengths. The findings also indicate that ICT Infrastructure sharing awareness levels were high with site sharing being the most popular at 86%, followed by fiber sharing at 84%, radio access network at 77%, mobile roaming at 67% and cloud computing at 65%.
Table 2: Sharing levels among mobile operators
Mobile operator
Market share
%
Total sites
Sites market
share
Shared sites
Shared sites
%
Safaricom 66.5 3140 51% 344 11
Airtel 17.6 1220 20% 448 37
Essar YU 8.8 739 12% 123 17
Telkom
Orange 7.1 1050 17% 341 32
Total 100% 6149 100% 1256 20.4
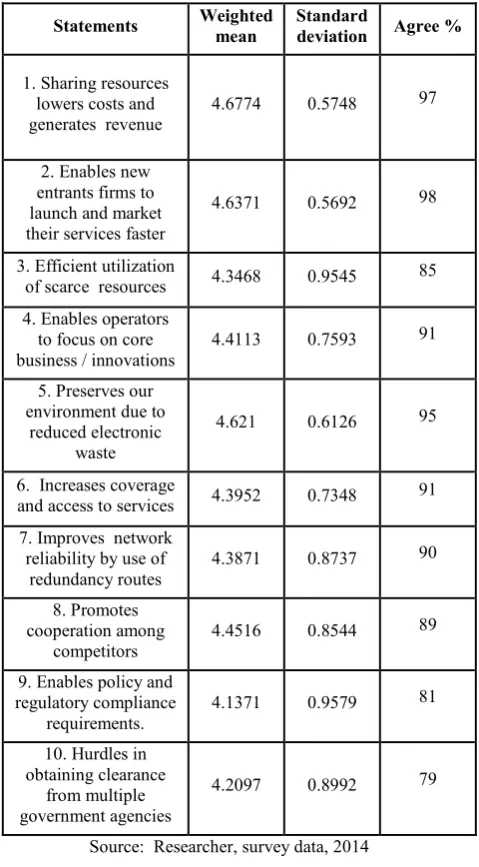
Table 3: Drivers of infrastructure sharing
Statements Weighted
mean
Standard
deviation Agree %
1. Sharing resources lowers costs and generates revenue
4.6774 0.5748 97
2. Enables new entrants firms to launch and market their services faster
4.6371 0.5692 98
3. Efficient utilization
of scarce resources 4.3468 0.9545 85
4. Enables operators to focus on core business / innovations
4.4113 0.7593 91
5. Preserves our environment due to
reduced electronic waste
4.621 0.6126 95
6. Increases coverage
and access to services 4.3952 0.7348 91
7. Improves network reliability by use of
redundancy routes
4.3871 0.8737 90
8. Promotes cooperation among
competitors
4.4516 0.8544 89
9. Enables policy and regulatory compliance
requirements.
4.1371 0.9579 81
10. Hurdles in obtaining clearance
from multiple government agencies
4.2097 0.8992 79
Source: Researcher, survey data, 2014
Table 4: Challenges of infrastructure sharing
Statements Weighted
Mean
Standard
deviation Agree %
1. May hinder competition due to reduced control and
interdependence
3.0645 1.2536 43
2. Exposure to risks e.g. market share loss
& security threats 3.4032 1.2745
56
3. Sharing process
complexities 3.75 1.2025 72
4. Unwillingness to share due to limited
or lack of capacity
3.5484 1.2356 61
5. Incompatibility of 58
6. High charges by
infrastructure owners 3.8226 1.0728 66
7. Lack of regulatory
& policy framework 3.9597 1.2263 75
8. High capital
requirements 3.879 1.086 73
9. High contractual exit costs arising from
breach of contract
3.5403 1.2026 59
10. Dominant operators fear of market share loss
3.6855 0.9768 58
Source: Researcher, survey data, 2014
Table 5: Using the TOE framework for infrastructure sharing adoption
Statements Weighted
Mean
Standard
deviation Agree %
A: Technological context
1. New technologies reduces capital and
operational expenses 3.8226 1.0728 69.6
2. Invest in new technologies as a competitive advantage
4.3306 0.8808 88
3. The higher the compatibility the higher the adoption
4.3226 0.8021 88
4. Perceived benefits and risks from new
technologies
3.8952 0.9788 72
B: Organizational context
1. Top level management support
increases adoption
4.371 0.8233 91.2
2. New market entrants are more likely to adopt sharing
4.6774 0.6155 96
3. A strong financial base & ICT resources
influences sharing.
3.9274 1.2041 72
4. Current ICT infrastructure influences
sharing
4.0887 1.003 80
C: Environmental context
1. A decline in economic performance increases
sharing adoption
4.2742 0.875 88
2. Stiff competition forces operators to adopt
infrastructure sharing
4 1.0626 77.6
3. Having a legal framework & policy
4. Customers demand for new ICT products influences sharing
adoption
3.5968 1.2404 61.6
Source: Researcher, survey data, 2014
6.
DISCUSSIONS
ICT infrastructure sharing is a resource optimization strategy that deals with how available scarce resources are used to deliver value to the stakeholders. Changing ICT market warrants corresponding changes in the way operators utilize available ICT resources. Stiff competition, along with high capital and operational expenses in the ever changing ICT environment, had been putting pressure on operators to seek new ways of optimizing the costs and maintaining the profit margins. Infrastructure sharing allows competing entities to cooperate and shift focus to service innovations.
On awareness, a study carried out in Kenya in 2013 found that 72% of the respondents had a clear understanding of site sharing [3] while in our study, 86% of respondents had a clear understanding of awareness indicating increased awareness. Cloud computing awareness was lower as compared to sites and fiber. Studies carried out Kenya on the same found out that cloud computing adoption was fairly new, with most organizations having adopted it either in 2010 or 2011 hence its impact was limited [34].
The research findings showed that mobile infrastructure in Kenya was 100% operator controlled. This could explain why the level of sharing was low at 20.4 %. When compared globally with USA where a site had at least 2 operators, India and Pakistan with more than one operator per site, the levels in Kenya were low [16] [17]. This could be attributed to lack of a regulatory framework, lack incentives to promote sharing among operators especially those who had invested heavily, lack of information on available excess capacity and only one independent firm Eaton Towers in the market without owned or managed infrastructure. The late market entrants Essar and Telkom had opted for sharing and had leased 41% and 32% of their sites mainly from Airtel and Safaricom respectively. The findings confirms previous findings where it was found that new market entrants preferred to lease capacity from existing operators so as to save on capex, opex and to launch their products faster in the market [7] [8]. There could also be a relationship of Essar’s high leasing levels at 41% and Airtels higher sharing levels at 37% due to the fact that their ownership was affiliated to Bharti and Essar groups whose origin was India where sharing had been implemented successfully [19]. The findings imply that if Airtel, Telkom Kenya and other new market entrants were to adopt infrastructure sharing strategy to expand their network coverage across Kenya so as to leverage with Safaricom, they would have to partner with Safaricom due to its extensive network coverage. In addition Essar infrastructure has been taken over by Safaricom following the exit of Essar in the Kenyan market. This also implies that for infrastructure sharing to be more successful in Kenya, Communication
Authority of Kenya CAK has to encourage Safaricom to share more including offering incentives to safeguard against their heavy investments.
The low levels of sharing can be improved if operators engage each other as business partners and CAK encourages or mandates sharing through a regulatory framework. There is need to attract more independent tower companies through attractive policies and incentives since research had shown that countries that had embraced independent companies like USA and India had shown rising levels of sharing.
Framework for ICT infrastructure sharing
Based on the flexibility of the TOE framework, the study tested 12 constructs for the three contexts. Decisions to adopt technology innovations by organizations were mainly driven by what existed. If the firm’s current ICT infrastructure could not support corporate strategy, the firm was forced to explore other options such as upgrading or renting the infrastructure from other operators so as to remain competitive. ICT infrastructure sharing had challenges such inability to integrate systems, technologies and policies. Through long term strategic vision and budget commitments, the top level management could influence organization’s infrastructure sharing adoption. New operators were more likely to adopt sharing to rollout their network and market their services fast hence saving on capital and operational expenses. A decline in economic performance affected the profit margins of operators hence reduced capital investment. Consumption of ICT services were likely to reduce due to weak purchasing power of the customers. This could force operators to explore cost cutting options such as adoption of infrastructure sharing. The stiff competition gave customers opportunity to switch between operators. To maintain and attract more customers, operators had to differentiate themselves by focusing more on product innovations and exploring new revenue streams such as infrastructure sharing.
The overall findings of the TOE framework showed that organizational context had the greatest influence on ICT infrastructure sharing adoption as compared to technology and external factors. Out of the 12 constructs tested the ones with higher influence were found to be new market entrants and top level management support. This compares to 2013 study by Borgman et al., where a high perceived relative advantage of cloud computing, a high level of top management support and a high competition intensity were the three factors positively linked to the decision to adopt cloud computing [33]. The high acceptance level for organizational context could be attributed to the extent to which individual organization had full control over the internal factors hence it could easily manipulate the factors depending on circumstances to drive its business strategy. Organizations had limited or no control over technology and external factors. Operators have to pursue winning strategies to mitigate the risks of high capital requirements for infrastructure deployment in order to minimize the negative effects associated with factors which the firms have no control over.
Fig 1: TOE framework Tornatzky and Fleischer 1990
Fig 2: Proposed ICT infrastructure sharing framework
7.
CONCLUSIONS
Infrastructure sharing levels in Kenya were low hence strategies to promote increased levels should be explored by the ICT stakeholders especially by CAK and ICT Authority. Safaricom’s higher infrastructure and market share is attributed to heavy capital investment over the years Safaricom, 2014. This implies that for Kenya to increase sharing levels, other operators and government will have to engage Safaricom to open up more while at the same time protecting their business interests. One strategy is to give incentives such as concessions on tax and license fee to independent firms and operators so as to encourage sharing. Operator controlled infrastructure deployment as a competitive advantage had worked previously for Kenya but as Africa’s ICT industry evolves with increasing number independent firms investing in infrastructure, stiff competition, rising demand for infrastructure and services, high capital requirements and long payback periods, bank
there is insufficient infrastructure and high demand/growth of ICT services.
8.
ACKNOWLEDGMENTS
We wish to acknowledge with much gratitude and appreciation all the firms and that participated in the study especially Safaricom, Airtel, Telkom Kenya, Essar and Communications Authority of Kenya CAK. We also acknowledge the contribution of the following faculty members at the School of Computing and informatics, University of Nairobi: Dr. Elisha Abade, Joseph Ogutu, Dr. Elisha Opiyo, and Evans Miriti
9.
REFERENCES
[1] Commonwealth Business Council, 2013. Africa Infrastructure Investment report by Commonwealth
Business Council.
http://www.infomercatiesteri.it/public/images/paesi/34/fil es/The_. Retrieved on 3rd July, 2014.
[2] World Bank Group, 2013. World Bank Group ICT
strategy 2012-2015. http://www.worldbank.org Retrieved on 2nd February, 2014.
[3] Namisiko, P. & Sakwa, M. 2013. Open information communication technology infrastructure sharing framework. Site sharing and its challenges to mobile service providers in Kenya. International Journal of Advanced Research in Computer and Communication engineering vol. 2, issue 7, pp. 2738 – 2744.
[4] Nepal Telecommunication Authority, 2010. Consultation
paper on infrastructure sharing.
http://www.nta.gov.np/en/2012-06-05-09-03-41/cp-2010. Retrieved on 30th January, 2014.
[5] International Telecommunication Union, 2008. ITU trends in Telecommunication reform. Challenges from an economic and practical point of view – Six degrees of sharing. http://www.itu.int/ITU-D/treg/publications /Trends08. Retrieved on 2nd February, 2014.
[6] Bangladesh Telecommunication Regulatory Commission, 2008. Guidelines for infrastructure sharing; http://www.ictregulationtoolkit.org Retrieved on 20th August, 2014.
[7] Venmani, D. P.,Yvon, G., Djamal, Z. 2012. Infrastructure Sharing: A Cost Effective Alternative for Resiliency in 4G-LTE Mobile Networks. International Journal on New Computer Architectures and their applications IJNCAA 21: 113-126.
[8] Allen & Overy, 2012. Passive infrastructure sharing. http://www.allenovery.com/SiteCollectionDocuments/Pa ssive% 20Infrastructure%20Sharing. pdf. Retrieved on 30th January, 2014.
[9] Kimiloglu, H., Ozturan, H., Kutlu, B. 2011. Market Analysis for Mobile Virtual Network Operators MVNOs: The Case of Turkey. International Journal of Business and Management Vol. 6, No. 6.
[10]Canadian International Development Agency, 1999. Evaluation study of the Panaftel project in Central African countries Senegal, Mali, Burkina Faso, Niger
and Benin.
http://www.acdicida.gc.ca/inet/images.nsf/vLUImages/ Performancereview4/ $file/Panaftel English.pdf. Retrieved on 30th January, 2014.
[11]Mukasa, S. 1992. Towards Pan-African Cooperation in Satellite Communication: An analysis of the RASCOM Project; African Council for Communication Education, Africa Media Review Vol.6 No.21992.
[12]Aloo, C. 1988. Development of Telecommunications Infrastructure in Africa: Network Evolution, Present Status and Future Development; Africa Media Review Vol.2 No.31988.
[13]Equity bank, 2014. Equity MVNO Strategy. http://www.equitybankgroup.com. Retrieved on 28th May, 2014.
[14]ICT Authority Kenya, 2014. The Kenya National ICT Master plan. Towards a digital Kenya 2013/14 – 2017/18. http://www.icta.go.ke/national-ict-masterplan. Retrieved on 13th June, 2014
[15]Communications Authority Kenya, 2014. Sector statistics report Quarter 2_ 2014. http://ca.go.ke/index.php/statistics. Retrieved on 13th June, 2014.
[16]Pakistan Telecommunication Authority, 2013. Annual Report. www.pta.gov.pk/annual-reports/annreport 2013_1.pdf. Retrieved on 13th June, 2014.
[17]Telecom Regulatory Authority India, 2013. Infrastructure Sharing and Open Access to Cable Landing stations. http://www.trai.gov/. Retrieved on 10th June, 2014.
[18]Idachaba, E.F. 2010. Telecommunication Cost Reduction in Nigeria through Infrastructure Sharing between Operators. Pacific Journal of Science and Technology. Pp. 272-276
[19]Shruti, B. 2011. Infrastructure sharing in telecom industry: Growth of new business models& their prospective trends. Symbiosis institute of telecom management, Pune, India volume-2, issue 1pp. 2319– 5479.
[20]Djamal, E.M., Tinku, R. & Yvon, G. 2010. On the role of Infrastructure sharing for mobile network operators in emerging markets. France Telecom-Orange R&D & CREATE-NET Research Center, Trento, Italy.
[21]Virgin Mobile, 2013. Is the region opening up? MVNO world congress, Rome. http://www.mvnodynamics.com. Retrieved on 13th June, 2014.
[22]Tower exchange, 2014. Africa Tower exchange. Journal of the telecom tower industry in Africa, CALA and Asia, ISSUE 10, 2014. http://www.towerxchange.com. Retrieved on 2nd November, 2014.
[23]Bhutan Information Communication and Media Authority, 2009. Consultation paper on ICT
infrastructure sharing.
http://www.bicma.gov.bt/paper/ict.pdf. Retrieved on 24th August, 2013.
[24]Bogere, J.A., Otim, J.S., Sseguyu, R. 2011. The Feasibility of National Roaming in Highly Competitive Mobile Markets: A Case Study of Uganda. School of Computing and Information Technology Department of Networks Makerere University.
P_The_Mobile_Economy_2013.pdf/1d78cea9-9e18-40ec-98d5-783dfbd86620. Retrieved on 12th June, 2014.
[26]International Telecommunication Union, 2013. Trends in telecommunication reform. http://www.itu.int/. Retrieved on 13th June, 2014.
[27]Singh, N.P. 2010. Growth Strategies of Mobile Virtual Network Operators in Oman. Asian Journal of Business Management, 24: 94-109, 2010 ISSN: 2041-8752.
[28]Analysys Mason, 2012. Broadcasting and mobile towers: Key factors affecting investment opportunities, 21454-482.
http://www.analysysmason.com/PageFiles/22112/Analys ys_Mason_Broadcasting_and_Mobile_Towers_Jan12.pd f. Retrieved on 25th July, 2014.
[29]KPMG, 2010. Cutting through complexity; Passive infrastructure sharing in telecommunications. Tower company landscape changes in Africa and the Middle East.
http://www.kpmg.com/BE/en/IssuesAndInsights/Articles Publications/Documents/Passive-Infrastructure-Sharing-in-Telecommunications.pdf. Retrieved on 22nd January, 2014.
[30]Booz, 2007. Telecom infrastructure sharing; Regulatory
enablers and economic benefits.
http://www.strategyand.pwc.com/media/uploads/Teleco m-Infrastructure-Sharing.pdf. Retrieved on 30th January, 2014.
[31]Ericsson, 2010. Infrastructure sharing Trends for Mobile e – Broadband Networks. http://aitec.usp.net. Retrieved on 11th March, 2014.
[32]Oliveira, T. & Martins, M.F. 2011. Literature Review of Information Technology Adoption Models at Firm Level. The Electronic Journal Information Systems Evaluation Volume 14 Issue 1, pp.110-121.
[33]Borgman, H.P., Bahli, B., Heier, H., Schewski, F. 2013. Cloudrise: Exploring cloud computing adoption and governance with the TOE. Paper presented at 2013 46th Hawaii International Conference on System Sciences.
[34]Omwansa, K.T., Waema, M.T., Omwenga, B. 2014. Cloud Computing in Kenya. Baseline survey. University of Nairobi School of Computing and Informatics SCI & Computing for Development Lab C4DLab.
[35]Botswana Telecommunication Authority, 2011. Regulation and guidelines on sharing passive
communications infrastructure.
http://www.bocra.org.bw/guidelines-sharing-passive-communications-infrastructure. Retrieved on 12th June, 2014.
[36]Safaricom Ltd, 2014. Annual financial report 2014. http://www.safaricom.co.ke. Retrieved on 10th September, 2014.
[37]Communication Commission of Kenya 2013. Strategic plan 2013 – 2018, pp.6 - 16, 31 – 34. http://www.cck.go.ke. Retrieved on January 25, 2014
[38]The Kenya national broadband strategy 2013-2017, pp. 3
– 7,16,43-45.