Vol.9 (2019) No. 3
ISSN: 2088-5334
Analysis of Attribute Selection and Classification Algorithm Applied
to Hepatitis Patients
Sherylaidah Samsuddin
#1, Zuraini Ali Shah
#2, RD Rohmat Saedudin
*, Shahreen Kasim
+, Choon Sen Seah
+ #Faculty of Computing, Universiti Teknologi Malaysia, Johor, Malaysia E-mail: [email protected]; [email protected]
*
School of Industrial Engineering, Telkom University, 40257 Bandung, West Java, Indonesia
+
Faculty of Computer Sciences and Information Technology, Universiti Tun Hussein Onn Malaysia, Batu Pahat, Malaysia
Abstract— Data mining techniques are widely used in classification, attribute selection and prediction in the field of bioinformatics
because it helps to discover meaningful new correlations, patterns and trends by sifting through large volume of data, using pattern recognition technologies as well as statistical and mathematical techniques. Hepatitis is one of the most important health problem in the world. Many studies have been performed in the diagnosis of hepatitis disease but medical diagnosis is quite difficult and visual task which is mostly done by doctors. Therefore, this research is conducted to analyse the attribute selection and classification algorithm that applied to hepatitis patients. In order to achieve goals, WEKA tool is used to conduct the experiment with different attribute selector and classification algorithm . Hepatitis dataset that are used is taken from UC Irvine repository. This research deals with various attribute selector namely CfsSubsetEval, WrapperSubsetEval, GainRatioSubsetEval and CorrelationAttributeEval. The classification algorithm that used in this research are NaiveBayesUpdatable, SMO, KStar, RandomTree and SimpleLogistic. The results of the classification model are time and accuracy. Finally, it concludes that the best attribute selector is CfsSubsetEval while the best classifier is given to SMO because SMO performance is better than other classification techniques for hepatitis patients.
Keywords— data mining; attribute selection; classification; hepatitis; WEKA
I. INTRODUCTION
The term “data mining” is used to describe the process of extracting value from a database. Data mining is the process of discovering meaningful new patterns, correlation, and trends by sifting through large volumes of data, using pattern recognition technologies, as well as mathematical and statistical techniques to extract the useful information [1]. Data mining also can be defined as “The nontrivial extraction of implicit, previously unknown, and potentially useful information from data” [2].
Data mining has been useful to extract useful information from raw data, thus help researchers decide its result [3]. One of the popular data mining techniques is Support vector machines (SVMs), which is useful to extract high dimensional data [4]. For this research, Waikato Environment for Knowledge Analysis (WEKA) tool is used with several algorithms [5].
II. MATERIAL AND METHOD
A. Hepatitis Dataset
Hepatitis disease has become widespread in the world for decades. The hepatitis is an inflammation of the liver without pinpointing a specific cause [6]. Three viruses cause hepatitis disease, which are hepatitis A, hepatitis B, and hepatitis C viruses. In this research, the hepatitis dataset patients are taken from UCI machine learning data repository. This dataset contains 19 fields with one class attribute, and the dataset includes both numeric and nominal attributes. There are 155 samples with 19 features. From these samples, there is 32 samples class as dies because of hepatitis.
B. Attribute selection
C. Classification Algorithm
Classification of data is a very typical task in data mining. There are large numbers of classifiers that are used to classify the data such as significant directed random walk [12], Bayes classifier [13], Multi-Layer Perceptron [14], Sequential Minimal Optimization [15], etc. Classification also is the process of finding a set of models that describe and differentiate data classes and concepts, to be able to use the model to predict the class whose label is unknown [12]. The goal of classification is to correctly predict the value of a designated discrete class variable, given a vector of predictors or attributes. For this research, the research methodology can be divided into three phases. Each phase consists of different processes and steps that helped to complete the research systematically and effectively. The detailed of all processes that are carried out in each phase are presented in Figure 1.
Fig.1 Research workflow
1) Phase 1: Data Pre-processing: the initial phase can be
defined as an essential task in knowledge discovery, the collected data will be processed, make sure it is entirely usable and the results that will be accurate. The decisions made in this phase are critical to the performance of the network. The steps of pre-processing data include; data
cleaning, data integration, data transformation (normalization, data conversion), and data reduction.
2) Phase 2: Attribute Selection Methods: the main aim of
feature selection techniques is to remove irrelevant or redundant features from the dataset [16]. The attribute selection is the process of removing the redundant attributes that are deemed irrelevant to the data-mining task. Feature selection is classified as a wrapper method and filter method. The wrapper evaluates and selects attributes based on accuracy estimates by the target-learning algorithm. The wrapper evaluates and selects attributes based on accuracy estimates by the target-learning algorithm. A filter usually works alone with statistical correlation to determine the importance of features data with low complexity [17].
3) Phase 3: Classification Algorithm: Classification of
data is a very typical task in data mining. Classification, also is known as the process of finding a set of models that describe and differentiate the data classes and concepts to use the model to predict the class whose label is unknown. The goal of classification is to correctly predict the value of a designated discrete class variable, given a vector of predictors or attributes [14].
III.RESULTS AND DISCUSSION
The processes in conducting the experiment, which can be divided into two parts. First of all, is an attribute or feature selection that applied to hepatitis patients. Second is classification on hepatitis patients.
A. Hepatitis Dataset
The data sets that being used in attribute selection and classification is hepatitis dataset. Table 1 illustrates the information of hepatitis dataset.
TABLEI
INFORMATION OF HEPATITIS DATASET
No. Variable Values
1 Age 7, 78, 41.2, 12.566 2 Sex Male, Female 3 Steroid No, Yes 4 Antivirals No, Yes 5 Fatigue No, Yes 6 Malaise No, Yes 7 Anorexia No, Yes 8 Liver big No, Yes 9 Liver firm No, Yes 10 Spleen palpable No, Yes 11 Spiders No, Yes 12 Ascites No, Yes 13 Varices No, Yes
14 Bilirubin 0.3, 8, 1.428, 1.212 15 Alk phosphate 26, 295, 105.325, 51.508 16 Sgot 14, 658, 85.894, 89.651 17 Albumin 2.1, 6.4, 3.817, 0.952 18 Protime 0, 100, 61.852, 22.875 19 Histology No, Yes
20 Class Live, Die
B. Attribute Selection
Feature selection methods are used to find the significant features in the hepatitis dataset. The feature selection methods that applied in this research are CfsSubsetEval, Medical Institute
Database
Data Pre-processing
Feature Selection
BayesNet
SMO
KStar
Simple Logistic
Random Tree
Accuracy Comparison and Statistical Results
Research Conclusion
WrapperSubsetEval, GainRatioSubsetEval and CorrelationAttributeEval.
TABLEII
ANALYSIS OF ATTRIBUTE SELECTION THAT APPLIED TO THE HEPATITIS DATA
Classifier NaiveBaves Updatable
SMO KStar Random Tree Simple Logistic
No attribute Selection 83% 85% 81% 76% 83%
With attribute selection (using AttributeSelected Classifier)
CfsSubsetEval 81% 81% 84% 80% 84%
WrapperSubsetEval 79% 79% 79% 79% 21%
GainRatioAttributeEval 78% 83% 78% 74% 83%
CorrelationAttributeEval 81% 84% 83% 78% 81%
Table 2 shows that the classification accuracy of SMO is higher than the other four classifiers when there is no attribute selection. After applied attribute selection, KStar and SimpleLogistic show the highest accuracy, which is 84%. We also found that the mean absolute error for SMO is less compared to the other four classifiers.
For this research, five classier are chosen to predict hepatitis data. The classifier is NaiveBayesUpdatable, SMO, KStar, RandomTree, and SimpleLogistic. The analysis is done by looking at the mean absolute error, root mean. From the table above, we can observe that the classification accuracy of SMO is higher than other four classifiers except for the kappa statistic where the highest accuracy is given to NaiveBayesUpdatable. We also found that the mean absolute error for SMO is less compared to the other four classifiers.
TABLEIII
CLASSIFIER STATISTICAL RESULT
Classifier Mean Absolute Error Root Mean Square Error Kappa Statistic
NaiveBavesUpdatable 0.1661 0.3638 0.5483
SMO 0.1484 0.3852 0.5309
KStar 0.1916 0.3821 0.4076 RandomTree 0.2249 0.4504 0.1985 SimpleLogistic 0.2032 0.3431 0.4776
From Table 3, we can see that RandomTree has higher classification result with mean absolute error and root mean square error. While for the kappa statistic, the higher accuracy is NaiveBeavesUpdatable.
TABLEIV
SIMULATION RESULT OF BAND DATASET
Algorithm Correctly Classified Instances, % (Value) Incorrectly Classified Instances, % (Value) Time Taken, n (seconds ) Kappa statistics NaiveBavesUpd atable
84 16 0.02 0.5483
SMO 85 15 0.05 0.5309
KStar 82 18 0 0.4076
RandomTree 77 23 0.02 0.1985 SimpleLogistic 83 17 0.06 0.4776
Table 4 showed the simulation results of band dataset. Here, correctly and incorrectly classified instances are presented in time and Kappa accuracy. We can see that the
highest classified instances value is given to SMO, which are 85% and the lowest, only 15%, also SMO. The lesser time taken to build the model is KStar, which only takes 0 second and the highest kappa statistic given to NaiveBayesUpdatable.
TABLEV
TRAINING AND SIMULATION RESULTS OF BANDS DATASET
Algorithm Mean Absolute Error Root Mean Square Error Relative Absolute Error (%) Root Relative Squared Error (%) NaiveBaves Updatable
0.1661 0.3638 50 90
SMO 0.1484 0.3852 45 95 KStar 0.1916 0.3821 58 94 RandomTree 0.2249 0.4504 68 111 SimpleLogistic 0.2032 0.3431 62 85
Based on table 5, we noted that the differences of errors resulting from the training of the five selected algorithms. The highest error is found in RandomTree Classifier. Therefore, we could conclude that NaiveBaves, SMO, KStar, and SimpleLogistic are better classification algorithm compared with RandomTree. In this research, a few limitations have been faced during completing the research. The limitations are listed below:
• All of the datasets have to be pre-processed before undergoing feature selection and classification. • It considers only small traits to detect the virus. • Complex terminology is required to predict the result
more accuracy
For future research, we suggest extending the research by using different clustering techniques and association rule mining for a large number of patients. Moreover, it is necessary to apply fuzzy learning models for the further enhanced forecasting of hepatitis virus.
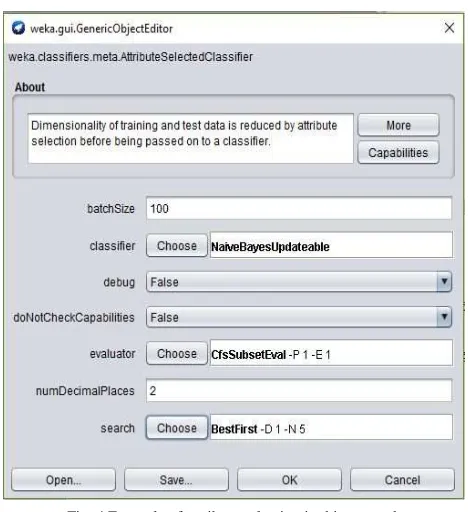
CfsSubsetEval and WrapperSubsetEval the search method used is Best-Fit whereas for GainRatioSubsetEval and CorrelationAttributeEval used search method ranker.
Fig. 4Example of attribute selection in this research
Furthermore, classification was applied to the dataset that has been undergoing an attribute selection process in previous step. By using WEKA, the classification can be done by choosing any classifier that we want to tested and set 10-fold cross-validation. Figure 5 shows the classifier output after classification have been made.
Fig.5 Classifier output for NaiveBayesUpdateable
After attribute selection have been implemented and the table have been generated, then we evaluate the classifier output by evaluating the performance of classification algorithm. This research applied five classifier in order to get
the best performance in accuracy. The classifier that being used to be tested in this research are NaïveBayesUpdateable, SMO, KStar, RandomTree, and SimpleLogistic.
After the experiment is done, SMO shows the highest performance of the classification algorithm. SMO has many advantages. Several of them are SMO is the most widely used in bioinformatics since it minimizes the expected error rate rather than reducing the classification error rate. SMO algorithm predicts well even if the testing data is entirely different from training data. SMO attempts to determine a plane that will have the smallest generalization error, among the infinite number of planes. SMO chooses the plane that maximizes the margin separating two classes. Wider is the gap smaller is the generalization error.
IV.CONCLUSION
This research experiment is conducted to analyze the attribute selection and their classification accuracies and calculate the time to build the model for hepatitis dataset. The results of the experiment proved that the best attribute selection is using CfsSubsetEval and the best classifier is SMO because it gives high performance in accuracy in hepatitis patients’ datasets using WEKA tool. For enhancement, clustering and more classification algorithms will be applied to analyze this type of dataset.
ACKNOWLEDGMENT
Universiti Teknologi Malaysia sponsors this work. We would also like to thank the Universiti Tun Hussein Onn for supporting this research under the Contract Grant Vot number W004.
REFERENCES
[1] Varun Kumar.M, Vijaya Sharathi.V And Gayathri Devi.B.R (2012). Hepatitis prediction model based on data mining algorithm and optimal feature selection to improve predictive accuracy. International journal of computer applications 51(19):13-16 [2] Seah, C. S., Kasim, S., & Mohamad, M. S. (2017). Specific Tuning
Parameter for Directed Random Walk Algorithm Cancer Classification. International Journal on Advanced Science, Engineering and Information Technology, 7(1), 176. doi:10.18517/ijaseit.7.1.1588
[3] Sen, S. C., Kasim, S., Fudzee, M. F., Abdullah, R., & Atan, R. (2017). Random Walk From Different Perspective. Acta Electronica Malaysia, 1(2), 26-27. doi:10.26480/aem.02.2017.26.27
[4] Chan, W. H., Mohamad, M. S., Deris, S., Corchado, J. M., Omatu, S., Ibrahim, Z., & Kasim, S. (2016). An improved gSVM-SCADL2 with firefly algorithm for identification of informative genes and pathways. International Journal of Bioinformatics Research and Applications, 12(1), 72. doi:10.1504/ijbra.2016.075404
[5] Ramesh Prasad Aharwal (2016). Evaluation of Various Classification Techniques of Weka Using Different Datasets. International Journal of Advance Research and Innovative Ideas in Education. Vol-2 Issue-2. ISSN (O)-2395-4396
[6] Duygu Calisir, Esin Dogantekin. (2011). a new intelligent hepatitis diagnosis system: pca–lssvm. sciencedirect. volume 38, issue 8, pages 10705–10708.
[7] Seah, C. S., Kasim, S., Mohamad, M. S., et al. (2018). An Effective Pre-Processing Phase for Gene Expression Classification. Indonesian Journal of Electrical Engineering and Computer Science, 11(3). [8] CfsSubsetEval. (2017, December 22). Retrieved from
http://weka.sourceforge.net/doc.dev/weka/attributeSelection/CfsSubs etEval.html
[10] GainRatioAttributeEval. (2017, December 22). Retrieved from http://weka.sourceforge.net/doc.dev/weka/attributeSelection/GainRat ioAttributeEval.html
[11] CorrelationAttributeEval. (2017, December 22). Retrieved from http://weka.sourceforge.net/doc.dev/weka/attributeSelection/Correlati onAttributeEval.html
[12] Seah, C. S., Kasim, S., Fudzee, M. F., & Mohamad, M. S. (2017). A Direct Proof of Significant Directed Random Walk. IOP Conference Series: Materials Science and Engineering, 235, 012004. doi:10.1088/1757-899x/235/1/012004
[13] Rusland, N. F., Wahid, N., Kasim, S., & Hafit, H. (2017). Analysis of Naïve Bayes Algorithm for Email Spam Filtering across Multiple Datasets. IOP Conference Series: Materials Science and Engineering, 226, 012091. doi:10.1088/1757-899x/226/1/012091
[14] Ngwar, M., & Wight, J. (2015). A fully integrated analog neuron for dynamic multi-layer perceptron networks. 2015 International Joint Conference on Neural Networks (IJCNN). doi:10.1109/ijcnn.2015.7280448
[15] Jenkins, J., Nick, W., Roy, K., Esterline, A., & Bloch, J. (2016). Author identification using Sequential Minimal Optimization. SoutheastCon 2016. doi:10.1109/secon.2016.7506654
[16] Nawi, N. M., Atomi, W. H., & Rehman, M. (2013). The Effect of Data Pre-processing on Optimized Training of Artificial Neural Networks. Procedia Technology, 11, 32-39. doi:10.1016/j.protcy.2013.12.159