Vol.7 (2017) No. 1
ISSN: 2088-5334
Specific Tuning Parameter for Directed Random Walk Algorithm
Cancer Classification
Choon Sen Seah
#, Shahreen Kasim
#, Mohd Saberi Mohamad
*#Faculty of Computer Sciences and Information Technology, Universiti Tun Hussein Onn Malaysia, Parit Raja, Batu Pahat, Malaysia
*
Faculty of Computing, Universiti Teknologi Malaysia, Skudai, 86400, Malaysia E-mail: [email protected]
Abstract— Accuracy of cancerous gene classification is a central challenge in clinical cancer research. Microarray-based gene
biomarkers have proved the performance and its ability over traditional clinical parameters. However, gene biomarkers of an individual are less robustness due to litter reproducibility between different cohorts of patients. Several methods incorporating pathway information such as directed random walk have been proposed to infer the pathway activity. This paper discusses the implementation of group specific tuning parameter in directed random walk algorithm. In this experiment, gene expression data and pathway data are used as input data. Throughout this experiment, more significant pathway activities can be identified which increases the accuracy of cancer classification. The lung cancer gene is used as the experimental dataset, with which, the sDRW is used in determining significant pathways. More risk-active pathways are identified throughout this experiment.
Keywords— directed random walk algorithm; group specific tuning parameter; cancer classification
I. INTRODUCTION
The human genome contains tens of thousands of genes. Throughout studying the genes, biologists and researchers can understand more about human beings, especially the causes of formation of cancer [1]. The study and analysis of these genes are done by using microarray experiment. Genes are playing important roles in the classification of cancer and for prognosis or diagnosis of cancer at early stage. The analysis and study of genes are complete by using deoxyribonucleic acid (DNA) microarray analysis. DNA microarray analysis is a technology used by scientists to measure the gene expression level changes in gene expression data. The microarray analysis involves the breaking of a cell to isolate its genetic contents to identify all the genes that are turned on in that cell, and generating a list of those genes (DNA Microarray). Various experiments and approaches are triggered to identify informative genes and pathways that contribute to the certain cellular process [2]. Even though the gene expression data contain genetic information, it is not sufficient to classify cancer accurately due to the small sample size of data. Hence, the integration between pathway data and gene expression data can provide a better understanding of the biological processes for cancer classification [3]. Biologists and researchers need accurate classification tools and lists of cancerous genes, which can contribute to the diagnosis process.
The Directed Random Walk (DRW) was proposed by Liu in 2013. It was developed to infer reproducible pathway activities and robust disease classification [4]. Its’ computational complexity and existing algorithm identify genes within pathways, which led to over-fitting and poor discriminating power. The discriminating power reflects the reproducible power and the robustness of pathways, whether the pathways are significantly differentially expressed or not [4]. Global directed pathway network is constructed in a directed random walk. In directed random walk, reverse direction of genes is allowed in global directed network pathway, and this can increase the probability for the edges to connect the next genes [4].
Besides that, the existing algorithm that identifies the genes within pathways also produces poor discriminating power. The discriminating power denotes the reproducible power and the robustness of pathways, whether the pathways are significantly differentially expressed or not [6]. When the tuning parameter is too large, it can lead to the production of poor discriminating power.
II. MATERIAL AND METHOD
Genes are the fundamental unit of heredity and the basic structure of DNA. Gene expression data is extracted from human DNA through microarray analysis. Gene expression data is used as input data for the experiment, while the method that applied in this experiment is specific directed random walk which enhances from directed random walk.
A. Gene Expression Data
The Microarray dataset used in this experiment was downloaded from the National Centre for Biotechnology Information (NCBI). It is GSE10072 for lung adenocarcinoma [7] with 107 samples where 58 samples are cancer samples while 49 are normal samples. These 107 samples are constructed from GSM254625 until GSM254731. This dataset contains 13788 genes and was used to compare with a group of metabolic pathways, which were obtained from the Kyoto Encyclopaedia of Genes and Genomes Databases [8, 9] and further developed into a global pathway network [4]. Pathways obtained and used are listed in Table 1. They are top 20 frequently selected pathway for lung cancer. The frequency of pathway markers for lung cancer classification is listed in Table 2. Global pathway network was formed by 300 graphs which cover 4113 nodes and 40 875 directed edge where the nodes represent the genes and directed edge represents how genes interact and regulate among each other [4].
The lung adenocarcinoma cancer dataset is chosen as the experimental dataset. Two classes of the lung datasets are employed for the sake of comparison. They are the tumour class and normal class. Overall, in the gene expression data, there are 107 samples and 13788 genes [8]. Out of the 13788 genes, 7948 genes have a p-value of less than 0.05, which means 7948 genes are used in the final experiment after filtering process in specific directed random walk (sDRW).
TABLEI
TOP 20 OF PATHWAYS DATA SELECTED FOR LUNG CANCER
CLASSIFICATION
No. Name of Pathways No. of genes in
pathways activity
1 Tight junction 63
2 ECM-receptor interaction 49
3 Focal adhesion 118
4 Leukocyte transendothelial
migration
63
5 Pancreatic secretion 45
6 Neuroactive ligand-receptor
interaction
41
7 Calcium signaling pathway 75
8 PPAR signaling pathway 34
9 Amoebiasis 60
10 Hepatitis C 63
11 Melanogenesis 47
12 Regulation of actin cytroskeleton 115
13 Bacterial invasion of epithelial cells 47
14 Cardiac muscle contraction 15
15 Neurotrophin signaling pathway 69
16 Chemokine signaling pathway 91
17 Adipocytokine signaling pathway 37
18 Vascular smooth muscle contraction 64
19 Adherens junction 43
20 Ether lipid metabolism 20
TABLEII
FREQUENTLY SELECTED PATHWAYS MARKERS (TOP 20)FOR CANCER
CLASSIFICATION
No. Name of Pathways Frequency of
selected pathway markers
1 ECM-receptor interaction 360/1500
2 Pancreatic secretion 230/1500
3 Focal adhesion 225/1500
4 Calcium signaling pathway 131/1500
5 Neuroactive ligand-receptor
interaction
114/1500
6 Leukocyte transendothelial
migration
109/1500
7 Tight junction 88/1500
8 PPAR signaling pathway 69/1500
9 Amoebiasis 63/1500
10 Hepatitis C 45/1500
11 Melanogenesis 29/1500
12 Regulation of actin cytoskeleton 24/1500
13 Bacterial invasion of epithelial cells 20/1500
14 Cardiac muscle contraction 16/1500
15 Neurotrophin signaling pathway 13/1500
16 Chemokine signaling pathway 12/1500
17 Adipocytokine signaling pathway 12/1500
18 Vascular smooth muscle
contraction
6/1500
19 Adherens junction 6/1500
20 Ether lipid metabolism 5/1500
B. Directed Random Walk Algorithm (DRW)
Fig. 1 Overview of directed random walk (DRW)-based method to infer pathway activity [4]
The directed random walk will restart the stimulation of random walker that starts on a source node, s. The walker transits from its current node to a random neighbouring node or goes back to the source node s with probability, r. Formally, the DRW is written as:
(1)
is a vector where the Z-th element holds the probability of being at node z at time t, and M is the row-normalized adjacency matrix of the graph G.
The initial probability was constructed by assigning data to each node by using their t-test score, after normalizing to a unit vector. The restart probability, r is set as 0.7, and it will be tuned and further described in the next sub-chapter. Due to the usage of t-test scores as the initial probability, the magnitude of the t-test scores also contributed to weight adjustments [4]. Thus, the genes that are both topologically important and significantly differentially expressed will obtain higher weights.
20 Pathway markers are selected to be specific for the cancer classification. This will further discuss in next section, materials.
C. Specific Directed Random Walk Algorithm (sDRW)
By using directed random walk algorithm, some informative genes may exclude from the pathways, and some uninformative genes may include within the pathways since some of the pathway data are usually gathered from the biological literature [10]. Hence tuning parameter selection method is proposed to integrate into directed random walk algorithm. The tuning parameter selection method is aimed to estimate the nearly optimal parameter for pathways; it is also important to identify an effective predictive model and the significant cancerous genes [9], [6]. Therefore, the tuning parameter selection method can lead to better performance of the directed random walk.
In the directed random walk algorithm, there is 1 tuning parameter, restart probability (r), also known as gamma that plays an important role in determining an effective predictive
model [4]. The tuning parameter, r is applied to estimate the probability of the node to move into the neighbouring nodes or going back to the previous node. With different numbers of restart probability, the specific directed random walk algorithm (sDRW) can list all pathways that are topologically important and significant to cancerous genes. This can lead to reduced miss up of significant pathways and reduce the consumed time by avoiding from using all pathways in the classification [4].
Instead of the general restart probability that implements in the directed random walk, 0.7 [4], additional of 8 different restart probabilities are applied in the specific directed random walk, which are 0.1, 0.2, 0.3, 0.4, 0.5, 0.6, 0.8, and 0.9. The significant genes within pathways can be selected and classified more accurately by using different restart probability.
The procedure consists of three main steps. In Step 1, the genes in microarray data are selected and grouped based on their prior pathway information from the pathway data. This process repeats for each pathway in the pathway data, and there is a possibility that some genes are not involved in any pathways at all. The P-value of genes is calculated, and the significant level of genes is differentiated accordingly. From this step, the new sets of gene expression data are produced to be evaluated by the sDRW.
After this, the weight, t-score and reproducible power of pathways are calculated. Table 3 illustrates the procedure of sDRW in pseudo-code. If the reproducibility of a gene is big, this indicates that it has more robustness and more significance to cancer. With this, the pathway that contains the genes will proceed to be evaluated by the restart probability, r that is also known as the tuning parameter. In the end, specific cancerous genes are identified and being classified accordingly. 5-fold cross validation is used to calculate the classification error [9] while the area under the curve is used to evaluate the performance of the classifier [11], [12]. Higher AUC indicates better accuracy of classification.
TABLEIII THE PROCESS OF SDRW Algorithm: sDRW
Input: GE, PD, r
Output: SP: Significant pathways
IG: Informative genes
Begin
For j=1 to the max no. of pathways in PD do
Select genes that are significant (p < 0.05); and
remove genes that are not significant (p > 0.05);
For i = 1 to all genes in GE do
Assign the initial weight of genes
with r = (0.1 – 0.9),
abs (t-test score), normalized vector;
End-for
Calculate the weight of genes;
Sign function for t-test scores of genes;
If the reproducible power of PA j > Pa j+1 More robustness PA for j;
End if
Evaluate pathways;
Estimation of r;
For r = 0.1 to 0.9 do
; Calculate the error rate with r;
End-for
Identify genes within PA;
Classify the genes based on cancer types; Calculate the classification error with 5-fold CV’ Evaluate the classifier by AUC;
End For End
Legend
GE = Gene Expression Data PD = Pathway Data
r = restart probability / tuning parameter
abs = absolute i = number of genes j = number of pathways PA = Pathway activity CV = Cross Validation AUC = Area Under Curve
III.RESULTS AND DISCUSSION
A. Results
The tuning parameter is built based on the constant restart probability. To tune the probability and seek for a different result that may be missed, 0.1 – 0.9 of restart probability is used. The usage of this tuning parameter is to specific select the risk-active pathway that significant to lung cancer. Instead of the general restart probability, 0.7 [4], 9 different restart probabilities are applied in the sDRW, which are 0.1, 0.2, 0.3, 0.4, 0.5, 0.6, 0.7, 0.8, and 0.9. With this, the significant genes within pathways can be selected and classified more accurately. “√” indicates that the
significant pathways are shown after running the tuning parameter in the DRW algorithm.
TABLEIV
PATHWAY DETERMINED BY SPCIFIC DIRECTED RANDOM WALK
Pathways Specific Directed Random Walk (sDRW)
0.1 0.2 0.3 0.4 0.5 0.6 0.7 0.8 0.9
Tight junction √
ECM-receptor
interaction √ √ √ √
Focal adhesion √ √ √ √
Leukocyte transendothelial
migration √
Pancreatic
secretion √
Calcium signaling pathway
Neuroactive ligand-receptor
interaction
PPAR signaling
pathway
Amoebiasis
Hepatitis C
Melanogenesis
Regulation of actin
cytoskeleton
Bacterial invasion of
epithelial cells
Cardiac muscle
contraction
Neurotrophin signaling
pathway
Chemokine signaling
pathway
Adipocytokine signaling
pathway
Vascular smooth muscle
contraction
Adherens
junction
Ether lipid
metabolism
TABLE IV
PATHWAY DETERMINED BY SPCIFIC DIRECTED RANDOM WALK
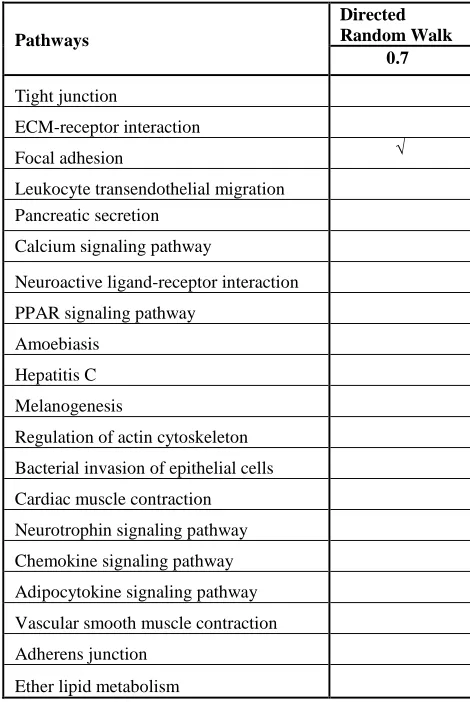
and Error! Not a valid bookmark self-reference. show the results of identified risk-active pathway with the Specific Directed Random Walk and Directed Random Walk. Results in TABLE IV
PATHWAY DETERMINED BY SPCIFIC DIRECTED RANDOM WALK
show five risk-active pathways that are significant to the lung cancer genes where the restart probability is 0.1 to 0.9 while the directed random walk only can identify 1 risk-active pathway. The five significant pathways that identified by specific directed random walk are a tight junction, ECM-receptor interaction, focal adhesion, leukocyte transendothelial migration, and pancreatic secretion while the only pathway that identified by directed random walk are focal adhesion.
to the other significant. However, this does not mean that they contain more significant genes compared to other significant pathways.
TABLEV
PATHWAY DETERMINED BY DIRECTED RANDOM WALK
Pathways
Directed Random Walk
0.7
Tight junction
ECM-receptor interaction
Focal adhesion √
Leukocyte transendothelial migration Pancreatic secretion
Calcium signaling pathway
Neuroactive ligand-receptor interaction
PPAR signaling pathway
Amoebiasis
Hepatitis C
Melanogenesis
Regulation of actin cytoskeleton
Bacterial invasion of epithelial cells
Cardiac muscle contraction
Neurotrophin signaling pathway
Chemokine signaling pathway
Adipocytokine signaling pathway
Vascular smooth muscle contraction
Adherens junction
Ether lipid metabolism
Pathways that showed negative feedback with the restart probability of 0.1 to 0.9 are calcium signaling pathway, neuroactive ligand-receptor interaction, PPAR signaling pathway, Amoebiasis Hepatitis C, melanogenesis, regulation of actin cytoskeleton, bacterial invasion of epithelial cells, cardiac muscle contraction, neurotrophin signaling pathway, chemokine signaling pathway, adipocytokine signaling pathway, vascular smooth muscle contraction, adherens junction, and ether lipid metabolism.
To further demonstrate the restart probability, restart probability is applied in inter-validation. For a fair and effective comparison with other methods, within dataset five-fold cross validation is carried out. To reduce the effect of sensitivity in feature selection while comparing different pathway, only top 50 pathway activities are used [4]. The top 50 pathway activities are ranked by P-values in increasing order as the candidate feature for feature selection [4]. The classifier was built based on logistic regression.
Table 6 shows the average area under the curve (AUC) of each restart probability. Within the dataset, validation is attempted to perform five-fold cross validation. Five-fold
splits of samples in each dataset, four-fifths of the samples were used as the training set to build the classifier, and the remaining one-fifth was used as the test set.
TABLEVI
CLASSIFICATION PERFORMANCE COMPARISON ON DIFFERENT RESTART
PROBABILITY
Restart Probability Mean AUC
0.1 0.9687
0.2 0.9759
0.3 0.9704
0.4 0.9692
0.5 0.9883
0.6 0.9939
0.7 0.9706
0.8 0.9881
0.9 0.9761
Fig. 2 Classification performances of different restart probability within datasets using logistic regression
Fig. 2 presents a summary of the AUC of the inter-validation experiments. The proposed sDRW method obtained AUCs of restart probability 0.1 (0.9687), 0.2 (0.9759), 0.3 (0.9704), 0.4 (0.9692), 0.5 (0.9883), 0.6 (0.9939), 0.7 (0.9706), 0.8 (0.9881), and 0.9 (0.9761).
probability for lung adenocarcinoma cancer, while 0.5 and 0.8 can be uses as references restart probability.
Noted that, restart probability can perform differently per the datasets. The experiment shows that 0.1, 0.3, 0.4 and 0.7 are not suitable to be used as restart probability for lung adenocarcinoma cancer. This is because the accuracy of 0.1, 0.3, 0.4 and 0.7 are between 0.969 to 0.971, which are significantly low compare to restart probability of 0.6.
B. Discussion
This paper focuses on identifying the significant pathways that are related to gene expression data by proposing the sDRW. From the experiments and analyses, the sDRW shows plenty of pathways that are significant to gene expression data. By comparing the resulted significant pathways to gene expression data, we can easily locate the relevant genes that may be significant to cancerous genes [13].
The sDRW has also shown its ability on resulted pathways by tuning the restart probability. Out of the 20 pathways that are related to lung cancer, only five pathways denote positive results from the algorithm where only 2 major pathways showed higher significance compared to most of the results.
Even with correctly selected pathways, the sDRW may select the uninformative pathways. However, it has narrowed down the selected pathways whereby out of 20 pathways, only five pathways showed higher chances of being significant to lung cancer. This can reduce the time for researchers to figure out the significant genes by using all relevant pathways. This does not mean the other pathways are not significant to lung cancer, but it proves that this unselected pathway is not significant to the gene expression data used in this experiment. The result pathways are used in feature selection as they contain common genes that are significant to the lung tumour.
By tuning the restart probability from a fixed probability, 0.7 to a range of probability, 0.1 – 0.9, the number of resulted pathways increases. This resulted to the pathway that may contain insignificant genes, and this can lead to a low discriminative power. As demonstrated in the results, the restart probabilities of 0.1 and 0.9 have no common results with other restart probabilities. This is because the range of probability from 0.1 to 0.9 is used, and not all are sufficient to identify the significant pathways. When the restart probability is too small, it can lead to over-fitting of the training model and give too little sparse to the produced classifier; and if it is too big, it can lead to under-fitting of the training model, which again can be very sparse to the classifier [14].
The reliable performance of sDRW could be attributed to the strategy of different restart probability. By testing with a range of 0.1 to 0.9 restart probability, the sDRW could identify the best restart probability to cancer. Thus, the implement of specific tuning parameter will increase the accuracy of classification.
Therefore, further research, especially in the tuning parameter selection methods, is needed to surmount the limitation of the sDRW where a process of identifying the useful restart probability is needed as well as other algorithms enhancement [15], [16]. A complete library of
restart probability could help to clarify the suitable restart probability for every cancer type. With the rapid development of human interaction databases, a complete restart probability library will enable a more accurate prediction of cancerous genes which covered most of the cancer type.
IV.CONCLUSIONS
Directed random walk algorithm had been succeeding improved by implementing tuning parameter selection method. By using different restart probability, different significant pathways are selected and affected the accuracy of classification. Even the accuracy is increased, but the restart probability is only suitable for the sample datasets. Please note that different datasets required different restart probability. Hence, the range of restart probability is proposed.
Therefore, a complete library of restart probability could help to clarify the suitable restart probability for every cancer type. With the rapid development of human interaction databases, a complete restart probability library will enable a more accurate prediction of cancerous genes which covered most of the cancer type. Besides, further research, especially in the tuning parameter selection methods, is needed to surmount the limitation of the sDRW where a process of identifying the useful restart probability is needed.
ACKNOWLEDGMENT
We would like to thank Universiti Tun Hussein Onn Malaysia for supporting this research by the Fundamental Research Grant Scheme (FRGS) vot numbers 1559.
REFERENCES
[1] Waleed, K. M. A., Ibraem, A. A., Mohammed, Q. A., Nadia, T. A., Ismail, S., Isolation of Lactobacillus salivarius from Children and Purification of Bacteriocin to Inhibition Cancer Cell in Vitro, International Journal on Advanced Science, Engineering and Information Technology, vol. 1, no. 1, pp. 104-108, 2011. [Online]. Available: http://dx.doi.org/10.18517/ijaseit.1.1.24
[2] Mah, S-K., Tee, S-H., Computational Analysis of PTEN Gene Mutation," International Journal on Advanced Science, Engineering and Information Technology, vol. 2, no. 5, pp. 383-386, 2012. [Online]. Available: http://dx.doi.org/10.18517/ijaseit.2.5.229 [3] Ong, H. F., Mustapha, N., Sulaiman, M. N. (2011). Integrative Gene
Selection for Classification of Microarray Data. CIS Computer and Information Science, 4(2). doi:10.5539/cis.v4n2p55
[4] Liu, W., Li, C., Xu, Y., Yang, H., Yao, Q., Han, J., Shang, D., Zhang, C., Su, F., Li, X., Xiao, Y., Zhang, F., Dai, M., Li, X. (2013). Topologically Inferring Risk-active Pathways Toward Precise Cancer Classification by Directed Random Walk. Bioinformatics, 29(17), 2169-2177. doi:10.1093/bioinformatics/btt37
[5] Shchur, L., Heringa, J., Blöte, H. (1997). Simulation of a Directed Random-walk Model the Effect of Pseudo-random-number Correlations. Physica A: Statistical Mechanics and Its Applications, 241(3-4), 579-592. doi:10.1016/s03784371(97)00126-x
[6] Misman, M. F., Mohamad, M. S., Deris, S., Hashim, S. Z. (2014). A Group-specific Tuning Parameter for Hybrid of SVM and SCAD in Identification of Informative Genes and Pathways. International Journal of Data Mining and Bioinformatics IJDMB, 10(2), 146. doi:10.1504/ijdmb.2014.064013
[8] Landi, M. T., Caporaso, N. E., Jen, J., Dracheva, T., Rotunno, M., Figueroa, J. D., Liu, H., Dasgupta, A., Mann, F.E., Fukuoka, J., Hames, M., Bergen, A.W., Murphy, S.E., Yang, P., Pesatori, A.C., Consonni, D., Bertazzi, P.A., Wacholder, S., Shih, J.H., Caporaso, N.E., Jen, J., (2008). Gene Expression Signature of Cigarette Smoking and Its Role in Lung Adenocarcinoma Development and Survival. PLoS ONE, 3(2). doi:10.1371/journal.pone.0001651
[9] Kanehisa, M., Sato, Y., Kawashima, M., Furumichi, M., and Tanabe, M.; KEGG as a Reference Resource for Gene and Protein Annotation. Nucleic Acids Res. 44, D457-D462 (2016).
[10] Wang, X., Dalkic, E., Wu, M., Chan, C., Gene Module Level Analysis: Identification to Networks and Dynamics. (2008). Current Opinion in Biotechnology. 19(5): 482-491.
[11] Chua, M. E., Tanseco, P. P., Mendoza, J. S., Castillo, J. C., Morales, M. L., Luna, S. L., Configuration and Validation of a Novel Prostate Disease Nomogram Predicting Prostate Biopsy Outcome: A Prospective Study Correlating Clinical Indicators Among Filipino Adult Males with Elevated PSA Level. (2015). Asian Journal of Urology
[12] Gagliano, S. A., Paterson, A. D., Weale, M. E., Knight, J., Assessing Models for Genetic Prediction of Complex Traits: A Comparison of Visualization and Quantitative Methods. (2015). BMC genomics, 16(1), 405.
[13] Tillinghast, G. W., Partee, J., Albert, P., Kelley, J. M., Burtow, K. H., Kelly, K. (2003), Analysis of genetic stability at the EP300 and CREBBP Loci in a Panel of Cancer Cell Lines, Genes Chromosomes and Cancer, Vol. 37, No.2, pp.121–131.
[14] Yang, S., Naiman, D. Q. (2014). Multiclass Cancer Classification based on Gene Expression Comparison. Statistical Applications in Genetics and Molecular Biology, 0(0). doi:10.1515/sagmb-2013-0053.
[15] Lee, L. C., Liong, C-Y, Jemain, A. B, Applying Fourier-Transform Infrared Spectroscopy and Self-Organizing Maps for Forensic Classification of White-Copy Papers, International Journal on Advanced Science, Engineering and Information Technology, vol 6, no 6, 2016. [Online]. Available: DOI: http://dx.doi.org/10.18517/ ijaseit.6.6.1425
![Fig. 1 Overview of directed random walk (DRW)-based method to infer pathway activity [4]](https://thumb-us.123doks.com/thumbv2/123dok_us/10045282.1991056/3.595.53.287.51.255/overview-directed-random-based-method-infer-pathway-activity.webp)