650
Research Article
Studies on genetic diversity for seedling root parameters in maize
Asima Gazal1, F. A. Nehvi2, Ajaz Ahmad Lone3, Zahoor Ahmed Dar3, S. Naseer3 and S. Nagoo4 1
Division of Genetics & Plant Breeding, Shalimar, SKUAST-K, J&K 2
Division of plant biotechnology, SKUAST-K, J&K 3
Dryland Agricultural Research Station, Budgam, SKUAST-K, J&K 4
Faculty of agriculture Wadura, SKUAST-K, J&K *E-mail: [email protected]
(Received:21 Mar 2018; Revised:09 May 2018; Accepted:10 May 2018)
Abstract
The D2 statistics is useful tool to assess genetic diversity among genotypes. It also provides qualitative measures of association between geographical and genetic diversity based on generalized distances. In the present study hundred maize lines were subjected to D2 analysis, which revealed the presence of substantial amount of genetic variability among them. To evaluate genetic diversity among the 100 inbred lines of maize over two years observations were recorded for six seedling root traits. ANOVA for dispersion for root traits in inbred maize lines revealed highly significant difference among all inbred lines. Inbred lines were grouped into ten clusters in year-1 analysis, twelve clusters in year-2 analysis and eight clusters in pooled over years analysis indicating the presence of genetic diversity. Maximum number of lines were accommodated in cluster-I in year-1, year-2 and in cluster-II in pooled over analysis. Maximum inter cluster distance in Y1 was recorded between cluster-X and cluster-IV. Similarly, in Y2 maximum inter cluster distance was recorded between cluster-XII and cluster-V and in pooled analysis maximum distance was recorded between cluster-VII and cluster-IV. Fresh root weight contributed maximum contribution towards divergence followed by primary root length. The pattern of distribution of lines into various clusters was random, suggesting that geographical and genetic diversity were not related. These genetically diverse inbred lines can be further used for developing superior hybrids and can also be utilized in developing synthetics and composites.
Key words
Genetic diversity, Maize, D2 analysis, Introduction
Genetic divergence is an essential tool in developing new cultivars and has a pivotal importance for hybrid combinations in maize. Genetic diversity studies are useful for genetic improvement and for synthetic cultivars development with novel genes for desired traits like high yield stability, abiotic and biotic stress tolerance and resistance. Maintaining genetic divergence and improving genetic resources are important issues among maize curators and breeders Hoxha et al.(2004). Inbred lines are the prerequisite for hybrid variety crop development. For developing high yielding maize hybrids, inbred lines need to be evaluated for their diverged gene pool. Assessment of genetic diversity among the cultivars is important for planning an effective hybrid breeding program as the genetically diverged genotypes are known to produce high heterotic effects. It has become possible to quantify magnitude of genetic diversity among germplasm with the help of advanced biometrical methods such as multivariate analysis Rao(1952) based on Mahalanobis’(1936) D2
statistics. Several studies on maize report that inbred lines from diverse stocks tend to be more productive than crosses of inbred lines from same variety Vasal (1998). The
manifestation of heterosis usually depends on the genetic divergence of the two parental lines Saxena
et al.(1998). The quantification of genetic diversity through biometrical procedure made it possible to choose genetically diverse parents for hybrid production. Genetic diversity is one of the
useful tools to select appropriate genotypes/lines for hybridization. The genetic diversity between the genotypes is important as the genetically diverged parents are able to produce high heterotic effects Falconer,(1960); Arunachalam(1981); Ghaderi et al.(1984). Knowledge of germplasm diversity among elite breeding materials have a significant impact on the improvement of crop plant Hallauer
et al.(1988). Characterization of genetic diversity of maize germplasm is of great importance in hybrid maize breeding Xia et al.(2005). The present investigation was undertaken with a view to estimate the nature and magnitude of genetic diversity in hundred maize inbred lines.
Material and Methods
651 Kharif 2015 and 2016. Two seeds of each inbred
line were planted in pots replicated twice in a randomized block design in a mixture of clay and sand (3:7). The materials were subjected to following moisture management regimes viz; well watered in which water was applied to 100% of the field capacity, intermediate stress in which water was applied to 60% of the field capacity and stress in which water was applied to 40% of the field capacity. Observations were recorded on root traits after giving subsequent drought cycles, that is, after 21 days of planting. The seedlings from each of the pots were carefully uprooted, washed free of sand, and divided at the cotyledonary node into their respective root and shoot portions. Data was recorded on germination percentage, number of seminal roots, number of crown roots, primary root length, fresh root weight and dry root weight. Mean values for all traits were worked out for statistical and biometrical analysis. Data were subjected to analysis of Mahalanobis’ D2-statistics. Intra-cluster and inter-cluster distance, cluster mean and contribution of each trait to the divergence was estimated as suggested by Singh and Chaudhary (1985) using windostat 9.1 version computer programme.
Results and Discussion
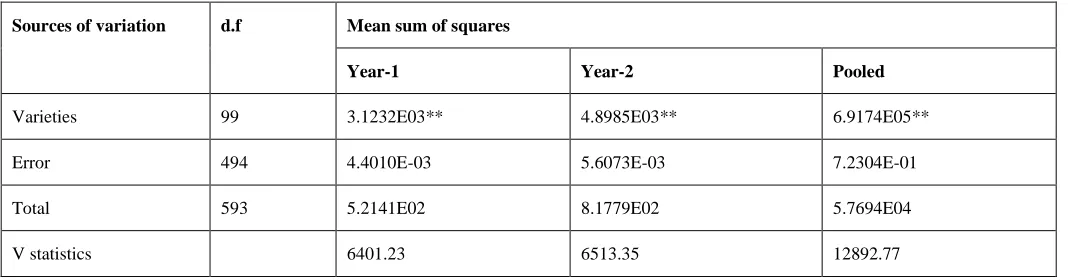
The strategy of developing superior hybrids in cross pollinated crops depends on genetic diversity present in the available inbred lines for improvement in trait of interest. For development of superior hybrids, superior inbreds need to be selected, possessing higher directional dominance, genetic diversity and allelic differentiation. The genetic divergence is estimated by using an effective statistical tool, Mahalanobis D2statistics, which gives clear idea about the diverse nature of the germplasm. Genetic divergence was carried out for 100 maize inbred lines both in individual years and in data pooled over years as per Mahalanobis D2 analysis employing Tocher’s method (Rao, 1952). Analysis of variance for dispersion revealed that the “V” statistics, which is a measure of Wilk’s criterion was significant in the individual and in the pooled analysis over years for all the root traits indicating diversity among the lines (Table-1). The success and usefulness of D2 analysis in quantifying the genetic diversity had been followed in maize (Saxena and Sandhu,1989).
For root traits maize lines were grouped in 10 clusters in Y1 with maximum number of lines (43) in cluster-I followed by cluster-IV, cluster-II and cluster-III accommodating 22, 15 and 14 maize lines, respectively. Six clusters namely cluster-V, VI, VII, VIII, IX and X accommodated one line viz., KDM-347, CM-128, KDM-958, KDM-362B, KDM-913A and KDM-361A, respectively. Similarly, Y2 exhibited 12 clusters with cluster-I accommodating 23
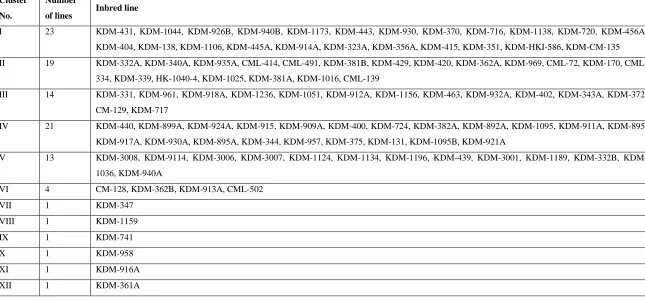
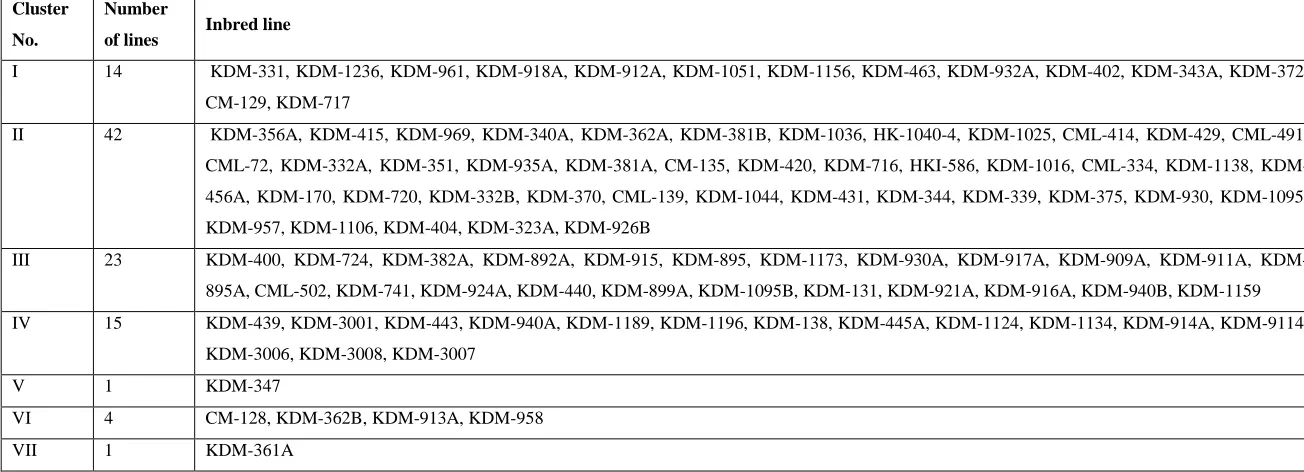
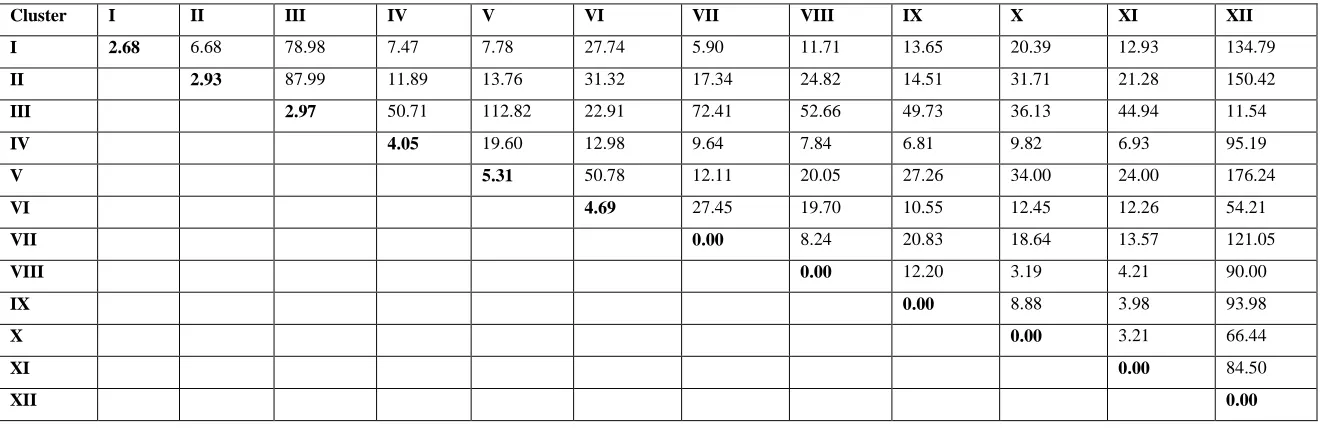
lines followed by cluster-IV (21), cluster-II (19), cluster-III (14), cluster-V (13) and cluster-VI (4), whereas 347, 1159, 741, KDM-958, KDM-916A and KDM-361 were grouped in monogenotypic clusters VII, VIII, IX, X, XI and XII, respectively. Pooled analysis over years grouped 100 maize lines in 7 clusters with maximum number of lines (42) in cluster II, followed by 23 lines in cluster-III, 15 lines in cluster-IV, 14 lines in cluster-I, 4 lines in VI and 1 line each in cluster V and cluster-VII. Fifteen lines viz; 331, 961, 918A, 912A, 1051, 1236, 1156, 463, 932A, 343A, KDM-402, KDM-717, KDM-372, CM-129 and KDM-361A exhibited similar grouping pattern in Y1, Y2 and pooled analysis. Other lines exhibited differences in their grouping pattern (Table-2.1, 2.2, 2.3). Maximum inter cluster distance in Y1 was recorded between cluster-X and cluster-IV (162.72) followed by 134.85 recorded between cluster-X and cluster-I, 113.57 between cluster-X and cluster-V and 96.74 between cluster-IV and cluster-III. Similarly, in Y2 maximum inter cluster distance (176.24) was recorded between cluster-XII and cluster-V followed by cluster-XII and cluster-II (150.42), cluster-XII and cluster-I (134.79) and cluster-V and cluster-III (112.82). In pooled analysis maximum distance of 73.56 was recorded between cluster-VII and cluster-IV followed by 65.36 and 53.14 exhibited by VII and II and cluster-VII and cluster-V (Table - 3.1, 3.2, 3.3). Minimum inter cluster distance, a measure of least genetic divergence, was observed for cluster-VIII and cluster-VII (3.46) followed by cluster-VIII and cluster-VI (3.59) and cluster- II and cluster- IX (7.13) in Y1, cluster-X and cluster-VIII (3.19), cluster-XI and cluster-VIII (4.21), cluster II and cluster-I (6.68) in Y2 and cluster-IV and cluster-II (3.55), V and III (3.56) and cluster-V and cluster-II (4.99) in pooled analysis. The mean intra cluster distance (D2) values for the Y1 revealed that cluster IV had highest intra cluster distance (D2) value of (6.48) followed by cluster II (3.93) and cluster III (3.40). In Y2 cluster V had maximum intra- cluster D2 value of (5.31) followed by cluster VI (4.69) and cluster IV (4.05). Pooled over analysis across the years revealed that the cluster- VI had the maximum distance (2.35) followed by cluster IV (1.93) and cluster- III (1.75).
652 cluster distances may not be worthwhile to get
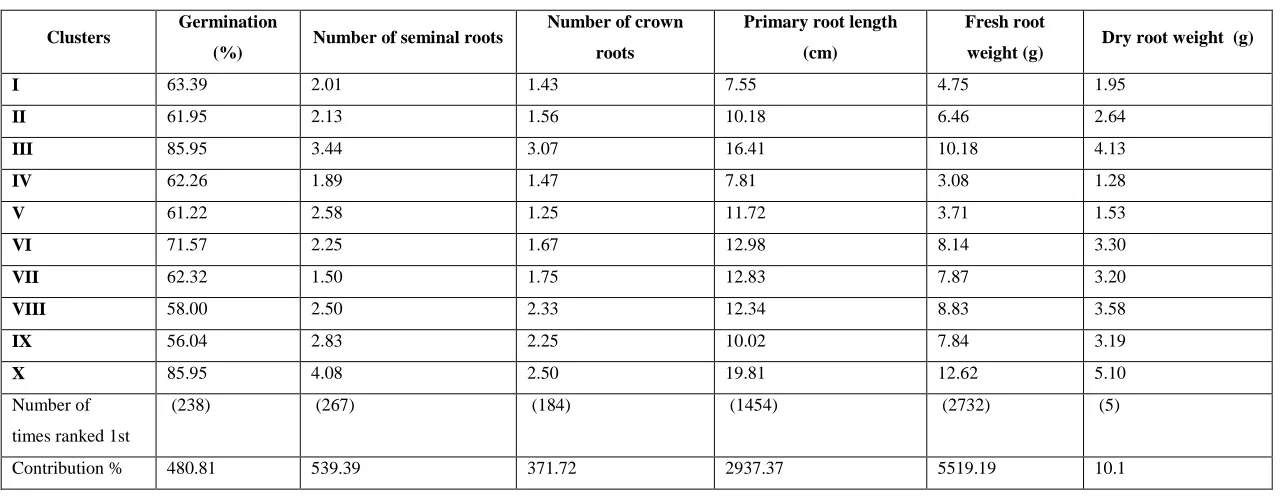
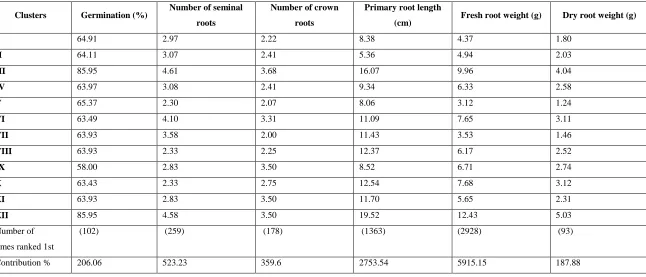
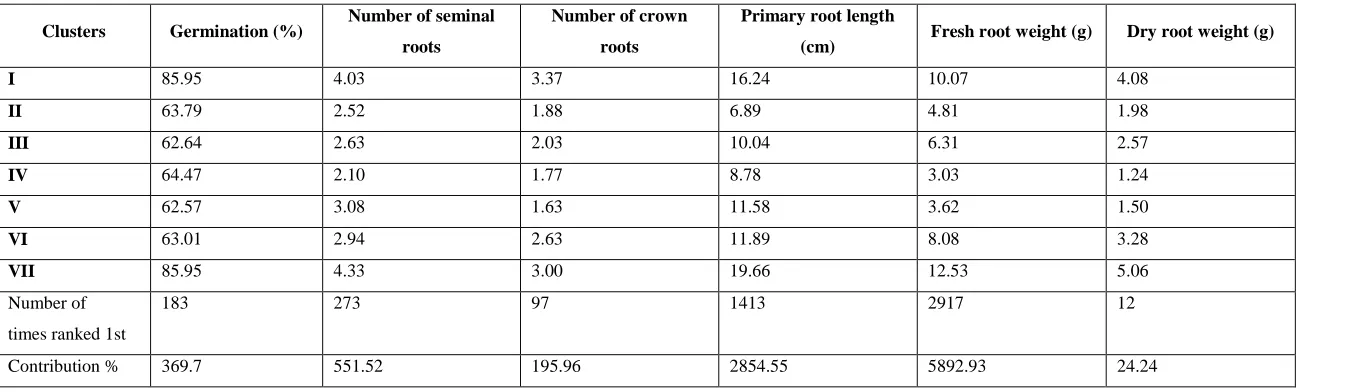
desired extent of heterosis. This is probably because of parents with similarity may possess common alleles governing the characters and may not help in complementation in the hybrid combination. Similarly, parents exhibiting greater divergence may also lack nick well ability. This is specially being observed in distant crosses (interspecific) for yield related traits. However, many studies are on the record that whenever parents with moderate divergence are used for crossing, throw out significant level of desired heterosis Arunachalam et al.(1984) and Singh et al. (2005). Line KDM-361A accommodated in cluster X (Y1), cluster-XII (Y2) and cluster-VII (pooled) recorded maximum cluster mean for germination per cent (85.95), number of seminal roots (4.08), primary root length (19.81), fresh root weight (12.62) and dry root weight (5.10), whereas for number of crown roots (3.07) highest cluster means was exhibited by cluster-III in Y1. In Y2 maximum germination per cent (85.95) was exhibited by cluster-III and for number of seminal roots (4.61) and number of crown roots (3.68) highest cluster means were exhibited by cluster-III, whereas for primary root length (19.52), fresh root weight (12.43) and dry root weight (5.03) highest cluster mean were exhibited by cluster-XII. In pooled over years highest cluster means for germination per cent (85.95) was exhibited by cluster-I and for number of seminal roots, primary root length, fresh root weight and dry root weight highest cluster means of 4.33, 19.66, 12.53 and 5.06, respectively was exhibited by cluster-VII, whereas for number of crown roots highest cluster mean of 3.37 was exhibited by cluster-I (Table-4.1, 4.2, 4.3). Cluster-III in Y1, Y2 and cluster-I in pooled over years accommodating lines KDM-331, KDM-961, KDM-918A, KDM-912A, KDM-1051, KDM-1236, KDM-1156, KDM-463, KDM-932A, KDM-343A, KDM-402, KDM-717, KDM-372, CM-129 exhibited desirable cluster means for rest of the seedling traits. Fresh root weight recorded maximum contribution towards divergence in Y1 (5519.19%), Y2 (5915.15%) and pooled over years (5892.93%) followed by primary root length in Y1 (2937.37%), Y2 (2753.54%) and pooled over year analysis (2854.55%), number of seminal roots (539.39% in Y1, 523.23% in Y2 and 551.52% in pooled), germination per cent (480.81% in Y1, 206.06% in Y2 and 369.7% in pooled), number of crown roots (10.1% in Y, 187.88% in Y2 and 24.24% in pooled) and dry root weight (10.1% in Y1, 6-187.88% in Y2 and 24.24% in pooled). (Table-4.1, 4.2, 4.3). Emphasis should be laid on characters contributing maximum D2 values for choosing the cluster for the purpose of further selection and choice of parents for hybridization.
The genotypes exhibited random pattern of
distribution into various clusters showing that genetic diversity and geographical diversity is not related. This suggests that forces other than geographical origin such as genetic drift, natural and artificial selection, exchange of breeding material plays an important role in the diversity of genotypes. Maximum diversity was found between cluster IV and VII suggesting that the genotypes in these clusters could be fully exploited to explore the wide range of heterosis and to release good recombinant lines by intermating them in a definite design
Acknowledgment
Authors are highly grateful to the staff of AIRCP Srinagar station, Budgam for providing the experimental fields and labour to carry the experiments smoothly for 2 year
References
Arunachalam, V., Bandopadhya, A., Nigam S.N. and Gibbons R.W. 1984. Heterosis in relation to genetic divergence and specific combining ability in groundnut (Arachis hypogaea L.), Euphytica, 33: 33-39.
Arunachalam, V. 1981. Genetic distance in plant breeding. Indian Journal of Genetics, 41: 226-236.
Azad, M.A.K., Biswas, B.K., Alam N. and Alam, S.S. 2012. Genetic diversity in maize (Zea mays L.) inbred lines. The Agriculturists,10(1): 64-70. Falconer, D.S. 1960. Introduction to quantitative
genetics. Oliver & Boid. London, pp. 304. Ghaderi, A., Shishegar, M., Regai A. and Ehdaie, B.
1984. Multivariate analysis of genetic diversity for yield and its components in mungbean. Journal of American Society of Horticultural Science, 104: 728-731.
Hallauer, A.R.,. Russell, W.A and Lamkey, K.R. 1988. Corn Breeding. In: Corn and Corn Improvement, 3rd edn. Agron Monogr 18, ASA-CSSA-SSSA, Madison, Wisconsin. USA, pp. 469-564.
Hoxha, S., Shariflou, M.R. and Sharp, P. 2004. Evaluation of genetic diversity in Albanian maize using SSR markers. Maydica, 49: 97-103.
Khumkar, M.S. and Singh, R.D. 2002. Divergence analysis of elite inbred lines of maize (Zea mays L.). Annalsof Agricultural Research 23: 595-601.
653 Marker, S. and Krupakar, A. 2009. Genetic divergence in
exotic maize germplasm (Zea mays L.). ARPN Journal of Agricultural and Biological Science,
4(4): 44-47.
Miranda, G.V., Combrs, R.R., Godoy, C.L, Guimaraes, L.J.M. and Melo-AV-de and de- Melo, A.V. 2003. Potential for breeding and genetic divergence in pop corn cultivars. Pesquisa- Agropecuaria-Brasileria, 38: 681-688. Rao, P.C. 1952. Advanced Statistical Methods in
Biometrical research. John Wiley and Sons, New York, USA.
Saxena, V.K., Mathi, N.S., Singh, N.N. and Vasal, S.K. 1998. Heterosis in maize: Grouping and patterns. Proc. of 7th Asian Regional Maize Workshop. Los Banos, Philippines. February 23-27, pp. 124-133.
Seshu, G., Brahmeswara Rao, M.V., Sudarshan, M.R. and Eeswari, K.B. 2014. Genetic Divergence in Sweet Corn (Zea mays L. saccharata.) International Journal of Pure and Applied Bioscience, 2(1): 196-201.
Singh, P.K., Prasad, M.K. and Chaudhari, L.B. 1999. Diversity study in maize (Zea mays L.). Journal of Applied Biology,9: 2 129-132. Singh, P., Sain, D., Dwivedi, V.K., Kumar, Y. and
Sangwan, O. 2005. Genetic divergence studies in maize (Zea mays L.). Annals of Agri. Bio. Res., 10(1): 43-46.
Singh, R.K. and Chaudhary, B.D. 1985. Biometrical methods in quantitative genetic analysis. Kalyani Publ., New Delhi. pp. 102-157. Saxena, V.K and Sandhu, A.S. 1989. Divergence
analysis in maize. Crop Improvement, 16(2): 154-158.
Vasal, S.K. 1998. Hybrid maize technology: Challenges and expanding possibilities for research in the next century. Proc. of 7th Asian Regional Maize Workshop. Los Banos, Philippines. February 23-27, pp. 58-62.
Xia, X.C., Reif, J.C., Melchinger, A.E., Frisch, M., Hoisington, D.A., Beck, D., Pixley, K. and Warburton, M.L. 2005. Genetic diversity among CIMMYT maize inbred lines investigated with SSR markers. Crop Science,
654 Table 1. ANOVA for dispersion for root traits in inbred lines of maize (Zea mays L.)
Sources of variation d.f Mean sum of squares
Year-1 Year-2 Pooled
Varieties 99 3.1232E03** 4.8985E03** 6.9174E05**
Error 494 4.4010E-03 5.6073E-03 7.2304E-01
Total 593 5.2141E02 8.1779E02 5.7694E04
V statistics 6401.23 6513.35 12892.77
Table 2.1. Distribution of inbred maize lines into clusters based on D2 statistics for root traits (Year-1)
Cluster No.
Number of lines
Inbred line
I 43 KDM-356A, KDM-415, KDM-969, KDM-1036, KDM-362A, KDM-381B, KDM-1025, HK-1040-4, KDM-429, KDM-491, KDM-332A, KDM-334, 716, 351, 1016, HKI-586, 720, 332B, CM-135, 420, 456A, 370, 1044, 1138, KDM-170, KDM-930, KDM-344, KDM-957, CML-139, KDM-1106, KDM-404, KDM-1095, KDM-375, KDM-339, KDM-926B, KDM-431, KDM-323A, KDM-1173, KDM-138, KDM-439, KDM-3001, KDM-445A, KDM-1124
II 22 KDM-899A, KDM-924A, KDM-909A, KDM-440, KDM-915, KDM-382A, KDM-400, KDM-892A, KDM-895, KDM-724, KDM-917A, KDM-930A, KDM-911A, KDM-895A, KDM-741, CML-502, KDM-1095B, KDM-921A, KDM-1159, KDM-131, KDM-916A, KDM-940B
III 14 KDM-331, KDM-961, KDM-918A, KDM-912A, KDM-1051, KDM-1236, KDM-1156, KDM-463, KDM-932A, KDM-343A, KDM-402, KDM-717, KDM-372, CM-129,
IV 15 KDM-1134, KDM-9114, KDM-3008, KDM-3006, KDM-3007, KDM-1196, KDM-443, KDM-381A, KDM-340A, CML-414, CML-72, KDM-940A, KDM-914A, KDM-935A
V 1 KDM-347
VI 1 CM-128
VII 1 KDM-958
VIII 1 KDM-362B
IX 1 KDM-913A
655 Table 2.2. Distribution of inbred maize lines into clusters based on D2 statistics for root traits (Year-2)
Cluster
No.
Number
of lines Inbred line
I 23 KDM-431, KDM-1044, KDM-926B, KDM-940B, KDM-1173, KDM-443, KDM-930, KDM-370, KDM-716, KDM-1138, KDM-720, KDM-456A, KDM-404, KDM-138, KDM-1106, KDM-445A, KDM-914A, KDM-323A, KDM-356A, KDM-415, KDM-351, KDM-HKI-586, KDM-CM-135 II 19 KDM-332A, KDM-340A, KDM-935A, 414, 491, KDM-381B, KDM-429, KDM-420, KDM-362A, KDM-969, 72, KDM-170,
CML-334, KDM-339, HK-1040-4, KDM-1025, KDM-381A, KDM-1016, CML-139
III 14 KDM-331, KDM-961, KDM-918A, KDM-1236, KDM-1051, KDM-912A, KDM-1156, KDM-463, KDM-932A, KDM-402, KDM-343A, KDM-372, CM-129, KDM-717
IV 21 KDM-440, KDM-899A, KDM-924A, KDM-915, KDM-909A, KDM-400, KDM-724, KDM-382A, KDM-892A, KDM-1095, KDM-911A, KDM-895, KDM-917A, KDM-930A, KDM-895A, KDM-344, KDM-957, KDM-375, KDM-131, KDM-1095B, KDM-921A
V 13 3008, 9114, 3006, 3007, 1124, 1134, 1196, 439, 3001, 1189, 332B, KDM-1036, KDM-940A
VI 4 CM-128, KDM-362B, KDM-913A, CML-502
VII 1 KDM-347
VIII 1 KDM-1159
IX 1 KDM-741
X 1 KDM-958
XI 1 KDM-916A
656 Table 2.3. Distribution of inbred maize lines into clusters based on D2 statistics for root traits (Pooled over years)
Cluster
No.
Number
of lines Inbred line
I 14 KDM-331, KDM-1236, KDM-961, KDM-918A, KDM-912A, KDM-1051, KDM-1156, KDM-463, KDM-932A, KDM-402, KDM-343A, KDM-372, CM-129, KDM-717
II 42 KDM-356A, KDM-415, KDM-969, KDM-340A, KDM-362A, KDM-381B, KDM-1036, HK-1040-4, KDM-1025, CML-414, KDM-429, CML-491, CML-72, 332A, 351, 935A, 381A, CM-135, 420, 716, HKI-586, 1016, CML-334, 1138, KDM-456A, KDM-170, KDM-720, KDM-332B, KDM-370, CML-139, KDM-1044, KDM-431, KDM-344, KDM-339, KDM-375, KDM-930, KDM-1095, KDM-957, KDM-1106, KDM-404, KDM-323A, KDM-926B
III 23 400, 724, 382A, 892A, 915, 895, 1173, 930A, 917A, 909A, 911A, KDM-895A, CML-502, KDM-741, KDM-924A, KDM-440, KDM-899A, KDM-1095B, KDM-131, KDM-921A, KDM-916A, KDM-940B, KDM-1159 IV 15 KDM-439, KDM-3001, KDM-443, KDM-940A, KDM-1189, KDM-1196, KDM-138, KDM-445A, KDM-1124, KDM-1134, KDM-914A, KDM-9114,
KDM-3006, KDM-3008, KDM-3007
V 1 KDM-347
VI 4 CM-128, KDM-362B, KDM-913A, KDM-958
657 Table 3. 1. Average inter-cluster (above diagonal) and intra-cluster (diagonal) distances among lines for root traits (Year-1)
Cluster I II III IV V VI VII VIII IX X
I 4.20 10.05 76.95 7.52 9.67 24.94 24.42 32.54 19.50 134.85
II 3.93 45.71 18.51 9.14 8.10 7.63 11.66 7.13 87.79
III 3.40 96.74 64.40 19.97 29.98 20.24 30.96 13.96
IV 6.48 11.01 38.69 36.66 47.32 31.71 162.72
V 0.00 20.25 19.27 25.44 18.13 113.57
VI 0.00 2.70 3.59 6.03 47.85
VII 0.00 3.46 7.63 60.63
VIII 0.00 4.77 45.00
IX 0.00 65.87
X 0.00
Table 3. 2. Average inter-cluster (above diagonal) and intra-cluster (diagonal) distances among lines for root traits (Year-2)
Cluster I II III IV V VI VII VIII IX X XI XII
I 2.68 6.68 78.98 7.47 7.78 27.74 5.90 11.71 13.65 20.39 12.93 134.79
II 2.93 87.99 11.89 13.76 31.32 17.34 24.82 14.51 31.71 21.28 150.42
III 2.97 50.71 112.82 22.91 72.41 52.66 49.73 36.13 44.94 11.54
IV 4.05 19.60 12.98 9.64 7.84 6.81 9.82 6.93 95.19
V 5.31 50.78 12.11 20.05 27.26 34.00 24.00 176.24
VI 4.69 27.45 19.70 10.55 12.45 12.26 54.21
VII 0.00 8.24 20.83 18.64 13.57 121.05
VIII 0.00 12.20 3.19 4.21 90.00
IX 0.00 8.88 3.98 93.98
X 0.00 3.21 66.44
XI 0.00 84.50
658 Table 3.3. Average inter-cluster (above diagonal) and intra-cluster (diagonal) distances among lines for root traits (Pooled over years)
Cluster I II III IV V VI VII
I 1.16 36.88 21.32 43.56 29.77 10.83 5.70
II 1.71 4.80 3.55 4.99 12.56 65.36
III 1.75 7.04 3.56 4.36 42.17
IV 1.93 3.85 16.58 73.56
V 0.00 9.35 53.14
VI 2.35 25.42
VII 0.00
Table 4.1. Cluster means for root traits of inbred lines of maize (Year-1)
Clusters Germination
(%) Number of seminal roots
Number of crown
roots
Primary root length
(cm)
Fresh root
weight (g) Dry root weight (g)
I 63.39 2.01 1.43 7.55 4.75 1.95
II 61.95 2.13 1.56 10.18 6.46 2.64
III 85.95 3.44 3.07 16.41 10.18 4.13
IV 62.26 1.89 1.47 7.81 3.08 1.28
V 61.22 2.58 1.25 11.72 3.71 1.53
VI 71.57 2.25 1.67 12.98 8.14 3.30
VII 62.32 1.50 1.75 12.83 7.87 3.20
VIII 58.00 2.50 2.33 12.34 8.83 3.58
IX 56.04 2.83 2.25 10.02 7.84 3.19
X 85.95 4.08 2.50 19.81 12.62 5.10
Number of times ranked 1st
(238) (267) (184) (1454) (2732) (5)
659 Table 4.2. Cluster means for root traits of inbred lines of maize (Year-2)
Clusters Germination (%) Number of seminal
roots
Number of crown
roots
Primary root length
(cm) Fresh root weight (g) Dry root weight (g)
I 64.91 2.97 2.22 8.38 4.37 1.80
II 64.11 3.07 2.41 5.36 4.94 2.03
III 85.95 4.61 3.68 16.07 9.96 4.04
IV 63.97 3.08 2.41 9.34 6.33 2.58
V 65.37 2.30 2.07 8.06 3.12 1.24
VI 63.49 4.10 3.31 11.09 7.65 3.11
VII 63.93 3.58 2.00 11.43 3.53 1.46
VIII 63.93 2.33 2.25 12.37 6.17 2.52
IX 58.00 2.83 3.50 8.52 6.71 2.74
X 63.43 2.33 2.75 12.54 7.68 3.12
XI 63.93 2.83 3.50 11.70 5.65 2.31
XII 85.95 4.58 3.50 19.52 12.43 5.03
Number of times ranked 1st
(102) (259) (178) (1363) (2928) (93)
660 Table 4.3. Cluster means for root traits of inbred lines of maize (Pooled over years)
Clusters Germination (%) Number of seminal
roots
Number of crown
roots
Primary root length
(cm) Fresh root weight (g) Dry root weight (g)
I 85.95 4.03 3.37 16.24 10.07 4.08
II 63.79 2.52 1.88 6.89 4.81 1.98
III 62.64 2.63 2.03 10.04 6.31 2.57
IV 64.47 2.10 1.77 8.78 3.03 1.24
V 62.57 3.08 1.63 11.58 3.62 1.50
VI 63.01 2.94 2.63 11.89 8.08 3.28
VII 85.95 4.33 3.00 19.66 12.53 5.06
Number of times ranked 1st
183 273 97 1413 2917 12