A Survey on Pre-service and In-service
Teachers’ Perceptions of Technological
Pedagogical Content Knowledge (TPCK)
Zahra Hosseini [1] Anand Kamal [2],
[1] Islamic Azad University-South Tehran branch
[email protected] [email protected]
[2] IP Associate, IP pro Services (India)
ABSTRACT
In the past two decades, technology has become an important part of the educational system. However, there are many evidences that indicate teacher deficiency in the use technology in teaching. In order to effectively use technology in teaching, researchers have identified the need to possess Technological Pedagogical Content Knowledge (TPCK)a complex knowledge that enables teachers to select appropriate technology tools for teaching a particular content through a particular method of teaching. Thus, the present research aimed to measure teachers’ knowledge for technology integration through the lens of TPCK. 236 pre-service and in-service teachers in five fields participated in this survey. An examination of the participants’ TPCK showed that Pedagogy Knowledge (PK) was highest and Technological Pedagogical Knowledge (TPK) was lowest among participants. Furthermore, statistical analysis using MANOVA indicated that there was no significant relationship between the demographic variables of age and gender with TPCK and its components while the participants’ field of study and teaching experience were significantly related to their TPCK. Moreover, the correlation between participants’ attitude toward using technology and TPCK was not found to be significant.
Keywords: Technological Pedagogical Content Knowledge (TPCK), technology integration
INTRODUCTION
Currently, computers are available in almost every school, college and university. But in spite of its availability and accessibility, computer technology is still not being utilized for teaching to its full extent (Daniels, 2002; Cradler, et al., 2002). It seems teachers are experiencing difficulty in effectively integrating technologies into existing curricula (Brand 1997).
In investigating the reasons for deficiency in teachers’ knowledge, many studies have acknowledged that teaching technology skills out of context and as separate skills in teacher educational program is not adequate to learn how to use technology in classroom (Vrasidas & McIsaac, 2001; Flick & Bell, 2000; Koehler, Mishra & Yahya, 2007). It is now considered important to teach how to integrate technology into instruction rather than teaching computer skills isolated from content learning (Silverstein et al., 2000; Sandholtz et al., 1997). Several studies have also asserted that effective integration of technology is grounded in revising curricular and educational practice (Lee, 2002; Vrasidas & McIsaac, 2001; White, Ringstaff, & Kelley, 2002; Willis, 2001).
While finding a model for incorporating technology into curriculum seems a difficult and complex task for teacher educators (Garofalo et al., 2000), Mishra and Koehler (2006) provided Technological pedagogical Content Knowledge (TPCK) framework for effectively integrating technology through curriculum planning. TPCK is an emergent form of knowledge that comprises a complex interplay among content knowledge, pedagogical knowledge and technological knowledge. TPCK enables the teacher to successfully incorporate technology in teaching by enabling the teacher to develop appropriate, context-specific strategies and representations. TPCK involves understanding and identifying (a) the use of appropriate technology, (b) in a particular content area, (c) as part of a pedagogical strategy, (d) within a given educational context, and (e) to develop students’ knowledge of a particular topic or meet an educational objective or student need (Cox, 2008).
From the current body of literature on TPCK, it seems that the TPCK framework provides a promising way forward for successfully integrating technology through curriculum planning. Further, it is argued that TPCK is a helpful framework for studying the development of teacher knowledge about technology (Koehler et al., 2007). Therefore, the present study tried to determine the knowledge of integrating technology of pre-service and in-service teachers through the lens of TPCK. For this purpose, the research questions addressed included:
1)Is there significant relationship between participants’ demographic variables such as age, gender, field of study and teaching experiences with their TPCK?
2)Is there significant relationship between participants’ computer attitude and their TPCK?
METHODOLOGY
This paper reports the survey conducted by the researchers by collecting data from the sample group of participants who were representative of the knowledge in the population (Creswell, 2008).
I. Participants
The participants of this survey contained 275 student-teachers in a university enrolled in five different fields for theirBachelors Degreeprogram. Study participants were allocated to 5 parallel groups of pre-service teachers in the following different fields: English, Persian Literature, Religion and Science in Elementary School.
II. Sampling
In the present research, sample was selected using a stratified sampling method (Creswell, 2008). For this purpose, the researchers divided the population into different groups and randomly selected a subset of participants from each group. The sample was selected from five different groups of student-teachers who were enrolled in different courses in university. This was done in order to consider many questions in the TPCK questionnaire which are dependent on different content areas. In an attempt to be consistent in size across different groups, 55 participants were randomly selected from each group to form the sample of 275 participants. However, only 236 participants in the sample completed the questionnaires and returned it back. The data collected from the final sample group of 236 participants were classified according to different fields: English, 53 (22.4%); Persian Literature, 43 (18.1%); Mathematics, 48 (20.3%); Religion, 42 (17.7%) and Science in elementary, 50 (21.1%). Further, 40.61% of participants in the final sample group had experience teaching in schools and private institutes or as a tutor.
III. The Instrument
The instrument consisted of a computer attitude questionnaire, a demographic questionnaire, and a TPCK questionnaire:
1.Computer Attitude Questionnaire: The computer attitude questionnaire included thirteen 5-point Likert type items assessing subjects' attitudes towards computer technology and computer activities (SD = Strongly Disagree, D = Disagree, U = Undecided, A = Agree and SA = Strongly Agree).
2.Demographic Questionnaire: The demographic data included age, gender, the field of study and experience in teaching. A multiple choice questionnaire was designed and different variables of age and teaching experience were designed in six and five group levels in the questionnaire form.
3.TPCK questionnaire: The TPCK questionnaire contained 50 close-ended for indicating TPCK knowledge and its components. Similar to the computer attitude questionnaire, a 5-point Likert system was selected to assess the seven constructs of TPCK.
The instrument was based on the TPCK framework introduced by (Mishra and Koehler, 2006) for integrating technology into teaching and the theme of “Survey of Pre-service Teachers' Knowledge of Teaching and Technology” that was introduced by (Schmidt et. al., 2009). The Persian version of the questionnaire was shown valid and reliable in a recent study (Hosseini and Anand, 2012). In that study, the Cronbach’s alpha value was found to be 0.895, indicating that the questionnaire had good internal consistency. The questionnaire contained 7 constructs and the items for each construct in the questionnaire were: 1) Technological Knowledge (11 items); 2) Pedagogical Knowledge (7 items); 3) Content Knowledge (6 items); 4) Technological Pedagogical Knowledge (10 items); 5) Pedagogical Content Knowledge (7 items); 6) Technological Content Knowledge (5 items); and 7) Technological Pedagogical Content
Knowledge (7 items).
IV. Data Analysis Method:
In this study, Multivariate Analysis of Variance (MANOVA) tested whether mean differences among different groups on a combination of dependent variables are significant. Further, the assumption of homogeneity of variances was evaluated with a Levene's Test. In addition, Pillai's trace was calculated to evaluate the significance of MANOVA results.
The relationship between the participant’s computer attitude and their TPCK was calculated using Pearson product-moment correlations.
RESULTS AND ANALYSIS
The statistical results indicating the Mean and standard deviation for TPCK and its components are as shown in Table 1.
Table 1: Descriptive Statistics
I.
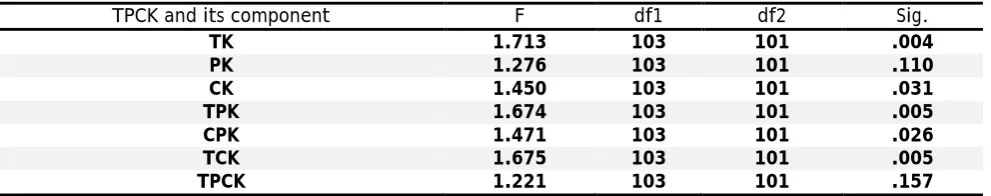
Relationship between Demographic items and TPCK and its components.To answer the first research question, the relationship between the demographic variable and TPCK and its component was investigated using Multivariate Analysis of Variance (MANOVA). To meet the assumption of using MANOVA, homogeneity of variance was evaluated with Levene's Test for MANOVA and the result showed that the error variance of the dependent variable was equal across groups (Table 2).
Table 2: Levene's Test of Equality of Error Variance
TPCK and its component F df1 df2 Sig.
TK 1.713 103 101 .004
PK 1.276 103 101 .110
CK 1.450 103 101 .031
TPK 1.674 103 101 .005
CPK 1.471 103 101 .026
TCK 1.675 103 101 .005
TPCK 1.221 103 101 .157
1)Relationship between Field of Study and TPCK: The results showed the participants’ field of study was related to
TPCK and its component Mean Percent Std. Deviation N
TK 31.0769 62.16 8.59854 221
PK 25.0139 71 6.08198 216
CK 20.5093 68.7 5.48043 214
TPK 23.3925 51.97 6.22166 214
PCK 24.2723 69.34 6.18436 213
TCK 16.0853 64.32 4.56720 211
TPCK 22.1005 63.4 6.31653 209
TPCK and its component except pedagogical knowledge (Table 3). Table 3: Relationship between Field of Study and TPCK
Source Dependent Variable Type III Sum of Squares df Mean Square F Sig.
field TK 599.977 4 149.994 2.957 .023
PK 261.869 4 65.467 2.256 .068
CK 331.666 4 82.917 3.177 .017
TPK 513.155 4 128.289 5.290 .001
CPK 427.647 4 106.912 3.503 .010
TCK 261.463 4 65.366 3.975 .005
TPCK 521.554 4 130.388 3.769 .007
2)Relationship between Age and TPCK: As indicted in table 4 the participants’ age did not have significant
relationship with TPCK and its component.
Table 4: Relationship between Age and TPCK
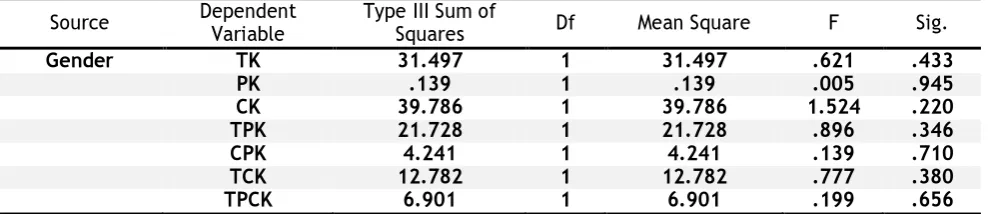
3)Relationship between Gender and TPCK: Age as a demographic variable was studied and the results that
emerged from MANOVA indicated there is not significant relationship between participants’ age and their scores of TPCK and its components (Table 5).\
Table 5: Relationship between Gender and TPCK
4)Relationship between Teaching Experiences and TPCK: The result showed that the participants’ teaching
experience was significantly related to TPCK and its five components (Table 6). However, no statistically significant (P < 0.5) differences in teachers with different experiences in teaching were found with technological pedagogical knowledge.
Source Dependent Variable Type III Sum of Squares Df Mean Square F Sig.
Age TK 409.507 5 81.901 1.615 .163
PK 145.525 5 29.105 1.003 .420
CK 36.295 5 7.259 .278 .924
TPK 51.129 5 10.226 .422 .833
CPK 24.673 5 4.935 .162 .976
TCK 61.723 5 12.345 .751 .587
TPCK 27.496 5 5.499 .159 .977
Source Dependent Variable Type III Sum of Squares Df Mean Square F Sig.
Gender TK 31.497 1 31.497 .621 .433
PK .139 1 .139 .005 .945
CK 39.786 1 39.786 1.524 .220
TPK 21.728 1 21.728 .896 .346
CPK 4.241 1 4.241 .139 .710
TCK 12.782 1 12.782 .777 .380
TPCK 6.901 1 6.901 .199 .656
Table 6: Relationship between Teaching Experience and TPCK
Source Dependent Variable Type III Sum of Squares df Mean Square F Sig.
Teaching Experience TK 482.500 4 120.625 2.378 .057
PK 658.896 4 164.724 5.676 .000
CK 443.795 4 110.949 4.251 .003
TPK 24.100 4 6.025 .248 .910
CPK 328.391 4 82.098 2.690 .035
TCK 251.957 4 62.989 3.831 .006
TPCK 381.925 4 95.481 2.760 .032
5)Relationship between Combination of Variables on TPCK: The result of studying on the significance of the mean
differences among different groups on a combination of variables (Table 7) demonstrated only combination of gender and teaching experiences on TPCK score appeared significant (with P= 0.05 or less).
Table 7: Relationship between Combinations of Variables with TPCK Scores
II.
Correlation between Computer Attitude and TPCK and its ComponentsTo answer the second research question, the correlations between computer attitude and TPCK and its components were calculated using Pearson product-moment correlations. The coefficient correlation among seven components of TPCK ranged from .028 (Computer Attitude and TCK) to .133 (Computer Attitude and PK). The results indicated that participants’ computer attitude was not significantly correlated with TPCK and its components at the 0.01 level (2-tailed).
DISCUSSION
Comparing the TPCK scores achieved by all of the participants in different fields indicated that student-teachers in the field of Science in elementary school had the lowest mean score in every component of TPCK except pedagogy knowledge. The lowest mean score for pedagogical knowledge was found in student-teachers in the field of Mathematics. However, student-teachers in the field of Persian Literature achieved the highest mean in the score of pedagogical knowledge among all five groups of participants. Further student-teachers in the field of English had the highest mean score of technology knowledge while student-teachers in the field of Religion achieved the highest mean score in CK and PCK.
Overall, the findings demonstrated that the PK and PCK were highest in the test of perceived knowledge of TPCK’s components. According to the significance of the relationship between teaching experience and components of TPCK (except TPK), it appeared that experience in teaching was correlated to the knowledge of PK and PCK. However, this experience was not significantly correlated to their TPK. While Figg and Jaipal (2009), accentuate TPK and believed TPK to be the most significant item in planning and implementing technology in teaching and identified the negative effect of lack of this knowledge in teaching.
In addition, the results of the study demonstrated no significant relationship between the demographic variables including age and gender and also computer attitude of the participants and their TPCK. However, MANOVA revealed a significant difference of TPCK scores among five groups of the participants with different field of study and experiences in teaching.
Source Dependent Variable Type III Sum of Squares df Square Mean F Sig.
Field and Age TPCK 458.214 13 35.247 1.019 .439
Field and Teaching Experience TPCK 6.080 1 6.080 .176 .676
Field and Gender TPCK 160.499 3 53.500 1.546 .207
Age and Gender TPCK 58.919 3 19.640 .568 .638
Age and Teaching Experience TPCK 164.786 4 41.197 1.191 .320 Gender and Teaching Experience TPCK 137.778 1 137.778 3.982 .049
CONCLUSION
The result of the current study indicated that in spite of attempts by teacher educational programs, the participants showed deficiency in knowledge of using technology for instructional purposes (TPK). The researchers believe it may be the result of teaching technology in an isolated way in teacher educational programs. It appears that although teacher education programs are making strides to prepare teachers for using technology in their teaching, their progress still seems slow for equipping teachers with the special knowledge of how to effectively use technology in their teaching.
REFERENCES
Brand, G. A. (1997, Winter). What research says: Training teachers for using technology. Journal of Staff Development, 19(1).
Creswell, J. W. (2008). Planning, conducting and evaluating quantitative and qualitative research (3rd ed., pp. 511-550). Upper Saddle River, NJ: Pearson Education, Inc.
Cox, S. (2008). A conceptual analysis of technological pedagogical content knowledge.Doctoral dissertation, Brigham Young University, Provo, UT.
Cradler, J., Freeman, M., &McNabb, M.L.(2002, September).Research implications for preparing teachers to use technology. Learning & Leading with Technology,30(1),pp. 50-55.
Daniels, T. (2002).Using the Internet to create an integrated thematic unit across the curriculum. In Proceedings of World Conference on E-Learning in Corporate, Government, Healthcare, and Higher Education 2002 (pp. 1378-1381). Chesapeake, VA: AACE\
Figg, C., & Jaipal, K. (2009).Unpacking TPACK: TPK characteristics supporting successful implementation. In I. Gibson et al. (Eds.), Proceedings of Society for Information Technology & Teacher Education International Conference 2009 (pp. 4069-4073). Chesapeake, VA: AACE.
Flick, L., & Bell, R. (2000). Preparing Tomorrow’s Science Teachers to Use Technology: Guidelines for Science Educators. Contemporary Issues in Technology and Teacher Education [Online serial], 1(1), 39-60.
Garofalo, J., Drier, H., Harper, S., Timmerman, M.A., &Shockey, T. (2000).Promoting appropriate uses of technology in mathematics teacher preparation. Contemporary Issues in Technology and Teacher Education [Online serial], 1(1).
Hooper, S. & Rieber, L.P. (1995).Teaching with technology. In A.C. Ornstein (Ed.), Teaching: Theory into practice (pp. 154-170). Needham Heights, MA: Allyn & Bacon.
Hosseini, Z., & Anand, K. (2012).Developing an Instrument to Measure Perceived Technology Integration Knowledge of Teachers.Proceedings of International Conference of Advanced Information System, E- Education & Development (ICAISED 2012). 7-8th February 2012. Kuala Lumpur. Malaysia.
Koehler, M. J., Mishra, P., &Yahya, K. (2007).Tracing the development of teacher knowledge in a design seminar: Integrating content, pedagogy and technology. Computers & Education, 49(3), 740-762.
Lee, K. (2002). Effective teaching in the information era: Fostering an ICT-based integrated learning environment in schools. Asian Pacific Journal of Teacher Education and Development, 5(1),21-45.
Mishra, P., & Koehler, M. J. (2006). Technological Pedagogical Content Knowledge: A new framework for teacher knowledge. Teachers College Record, 108(6), 1017-1054.
Sandholtz, J. H., Ringstaff, C., & Dwyer, D. C. (1997).Teaching with technology: Creating student-centered classrooms. New York, NY: Teachers College Press.
Schmidt, D., Baran, E., Thompson, A., Koehler, M.J., Shin, T.,& Mishra, P. (2009, April). Technological Pedagogical Content Knowledge (TPACK): The Development and Validation ofan Assessment Instrument for Preservice Teachers. Paper presented at the 2009 Annual Meeting of the American Educational Research Association. April 13-17, San Diego, California.
Silverstein, G., Frechtling, J., & Miyoaka, A. (2000). Evaluation of the use of technology in Illinois public schools: Final report (prepared for Research Division, Illinois State Board of Education). Rockville, MD: Westat.
Vrasidas, C., & McIsaac, M. (2001).Integrating technology in teaching and teacher education: Implications for policy and curriculum reform. Educational Media International, 38(2/3), 127-132.\
White, N., Ringstaff, C., & Kelley, L. (2002).Getting the most from technology in schools. Knowledge brief. WestEd, San Francisco, CA.
Willis, J. (2001). Foundational assumptions for information technology and teacher education. Contemporary Issues in Technology and Teacher Education, [Online serial], 1(3), 305-320