24
International Journal of Engineering and Management Research, Volume-3, Issue-3, June 2013
ISSN No.: 2250-0758
Pages: 24-29
www.ijemr.net
ISI Mitigation in Image Data for Wireless Wideband Communications
Receivers using Adjustment of Estimated Flat Fading Errors
Mohammad Ajmal1, Ahmad Nafees2 1
Department of Electronics Communication Engineering, Integral University, Lucknow, INDIA. 2
Department of Electronics Communication Engineering, Integral University, Lucknow, INDIA.
ABSTRACT
We first build up a wireless communication simulator including Gray coding, modulation, different channel models (AWGN, flat fading and frequency selective fading channels), channel estimation, adaptive equalization, and demodulation. Next, we test the effect of different channel models to the data and image in receiver with constellation and BER (bit error rate) plots under QPSK modulation. For Image data source, we also compare the received image quality to original image in different channels. At last, we give detail results and analyses of the performance improvement with channel estimation and adaptive equalization in slow Rayleigh fading channel. For frequency selective fading channel, we use linear equalization with both LMS (least mean squares) and RLS (Recursive Least Squares) algorithms to compare the different improvements. We will see that in AWGN channel, the image is degraded by random noise; in flat fading channel, the image is degraded by random noise and block noise; in frequency selective fading channel, the image is degraded by random noise, block noise, and ISI.
Keywords—Channel estimation, flat fading, frequency selective fading, slow fading, LMS, RLS.
I. INTRODUCTION
The speed of the mobile unit determines the channel fading rate and the Doppler spread, which is directly related to the coherence time of the channel. The choice of transmission model, and its corresponding bit error rate, depends on the channel data and coherence time. Mobile communications and wireless network have experienced massive growth and commercial success in the recent years. However, the radio channels in mobile radio systems are usually not amiable as the wired one. Unlike wired channels that are stationary and predictable, wireless channels are extremely random and time-variant. It is well known that the wireless multi-path channel causes an arbitrary time dispersion, attenuation, and phase shift, know as fading, in the received signal. Fading is caused by interference between two or more versions of the
transmitted signal which arrive at the receiver at slightly different times. There are many diversity techniques to address fading issue, such as OFDM, MIMO, RAKE receiver and etc. However, it may be still necessary to remove the amplitude and phase shift caused by the channel if you want to apply linear modulation schemes, such as the ones used in WiMAX. Digital communication systems operating on time varying dispersive channels often employ a signaling format in which customer data are organized in blocks preceded by a known training sequence. The training sequence at the beginning of each block is used to estimate channel or train an adaptive equalizer. Depending on the rate at which the channel changes with time, there may or may not be a need to further track the channel variations during the customer data sequence.
Modern wireless wideband communications such as 3GPP LTE, WIMAX, Wireless LANs, Digital TV Broadcasting (DVB), Vehicle to Vehicle (V2V) communications, and has recently been considered for underwater acoustic (UWA) communications. The latter are of special interest as they exemplify severely Doppler distorted channels, with Doppler factors as high as 10 (4) (normalized residual Doppler in excess of 10%).
25 feedback equalization schemes with time and frequency
domain Minimum Mean Squared Error (MMSE) receivers have been proposed. Low complexity data detection algorithms that assume linearly varying tap gains have been proposed for wireless radio (see [6, 7] and the references therein). In wideband such as UWA and Ultra Wide Band (UWB) systems [8], Doppler distortion causes time-scaling of the signal and as such may not be accurately modeled using linearly varying tap-gains. In [9], a low complexity detector for time-varying underwater acoustic communications which models time-scaling as a phase shift has been proposed, and in [8] a synchronization algorithm to jointly estimate the frequency offset and the Doppler-scaling factor is presented. An adaptive algorithm for estimating an underwater channel is derived in [10] and the ICI is compensated using a MMSE equalizer.
II. SYSTEM MODEL
We choose a model simulated to GSM, where the carrier frequency is 1.8GHz, and bandwidth of each channel is 200KHz. Suppose we use Nyquist pulse to transmit, we get Ts = 5 micro second, where Ts is symbol period. We simulate a suburb environment, where RMS delay spread is 200-310ns and we choose delay spread as 300ns. Now suppose the user is on a training which has a velocity of
2120km/hr. (actually we may set the velocity from 0-1000km/hr to simulate a slow fading channel, but it is out of the practical so we let the velocity in the range from 20km/hr to 120km/hr) .For 40km/hr, we get Tc =5.4ms>>5us>>300ns, so it is a slow flat fading channel.
III. DATA AND SYSTEM PARAMETER
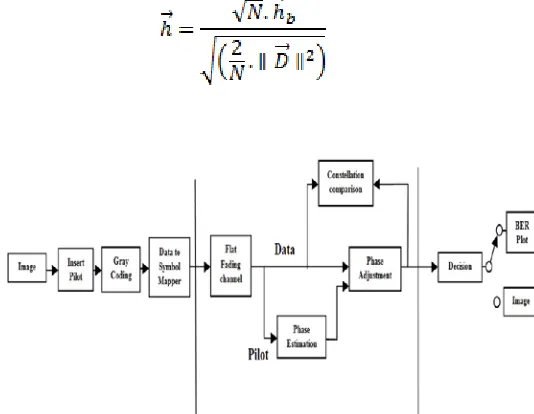
Since the baseband complex envelope expression can be used to represent band pass waveforms, the channel response, demodulated signal, and adaptive algorithms are usually simulated and implemented at baseband. So, our simulations are built up by baseband simulation. Our simulation supports image data. Image files give us an intuitive impression and comparison for different channels. In our model, we use phase shift keying (PSK) modulation to modulate the data source, and user may choose arbitrary M-ary PSK to modulate the signal. In our simulation, we test the QPSK modulation. We need to estimate channel phase during each coherence time. The pilot data length is 8% of the total data length and is inserted into head of source data in each coherence time. It is used to estimate the random phase shift of the fading channel and train the decision to adjust the received signal with phase recover. The received signal constellations of both with and without phase recover are dynamically showed in the simulation. User may choose to plot constellation or not in the program, and if they choose to plot constellation, they may also set the SNR for the constellation.
IV.
CHANNEL MODELING
We need to derive the fading channel to meet our requirement. In Matlab program, a simulation of Clarke and Gans fading model is produced. We derive the calculations and equations which are used in the flat fading channel impulse response. N samples of iid complex Gaussian random variable are produced by directly generating N*fd/fs numbers [1] of iid complex Gaussian random variable in frequency domain.
Following points are considered to derive the calculation of fading model:
(1)In flat fading channel with N samples, E[ || h ||2]=N,
where h represent channel impulse response with N samples.
(2)Calculate the channel impulse response before normalization.
(3) Calculate the channel impulse response after normalization.
We can get RF signal spectral shape after Doppler spread by the product of amplitude of complex Gaussian random variable and root square of Doppler power spectrum. We denote:
A: amplitude of complex Gaussian random variable in frequency domain,
D: root square of Doppler power spectrum
: RF signal spectral shape after Doppler spread. So is actually a scaled version of D, where each point in A is a scalar of complex Gaussian random variable. We finally get:
26
V. SIMULATION RESULTS
We discuss our simulation result by two steps. First we analyze the performance comparison by different SNR parameter setting in fading channel at vehicle speed of 40Km/hr i.e. slow flat fading. Then we analyze the performance by comparing 4PSK and 8PSK modulation type under the same SNR parameters setting.
All the simulations are based on 4/8 PSK modulation with gray code with and without channel estimation based on only phase adjustment of receive image data samples cause during slow fading.
2(a)
2(b)
As we can see in figure 2(a,b) scatter plots are shown for image data office_2.jpg sent through a 4 PSK channel model for four conditions above 2 plots of 2(a) represents scatter plot in presence of AWGN channel at SNR 6dB without estimation for phase adjustment(top left) and with estimation for phase adjustment(top right).Similarly bottom two plots of fig.2(a) indicates scattering in presence of slow fading effect for without estimation (bottom left) and with estimation (bottom right).
2(c)
2(d)
27
2(f)
Figure 2: Scatter plot for 4/8 PSK at different SNR
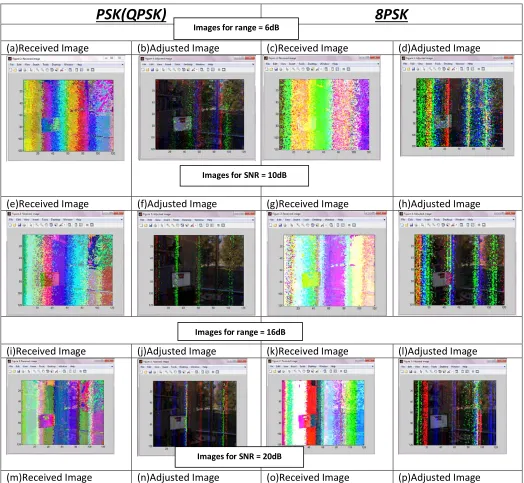
Similarly figure 2(c and e) represents scatter plot for 4 PSK at SNR 16 and 20 dB and figure 2(b,d and f) are scatter plots for 8 PSK ate SNR 6,16 and 20 dB. As the SNR is increasing we can see reduction in scattering that indicates reduction in bit errors. In each figure 2(a to f) bottom left and right plots shows fading effect and that is why scattering is large. However the effect of estimation for adjustment of can not be minutely described by scatter plot. So we have shown fig 3(a to p) to demonstrate the effect of fading and noise and the improvement in image quality after phase adjustment from estimate phase error.
PSK(QPSK)
8PSK
(a)Received Image (b)Adjusted Image (c)Received Image (d)Adjusted Image
(e)Received Image (f)Adjusted Image (g)Received Image (h)Adjusted Image
(i)Received Image (j)Adjusted Image (k)Received Image (l)Adjusted Image
(m)Received Image (n)Adjusted Image (o)Received Image (p)Adjusted Image Images for range = 6dB
Images for SNR = 10dB
Images for range = 16dB
Images for SNR = 20dB
28 Figure 3: (a,e,i and m) Effect of slow fading and AWGN at different SNR without estimation and phase adjustment for 4PSK
modulation (c,g,k and o) for 8PSK.(b,f,i and n) QPSK output image after phase adjustment and (d,h,l and p) for 8PSK with phase adjustment.
0 2 4 6 8 10 12 14 16 18 20
0 0.1 0.2 0.3 0.4 0.5 0.6 0.7
SNR
BER
BER vs SNR in flat fading
with channel estimation (8PSK) without channel estimation(8PSK) with channel estimation (4PSK) without channel estimation(4PSK)
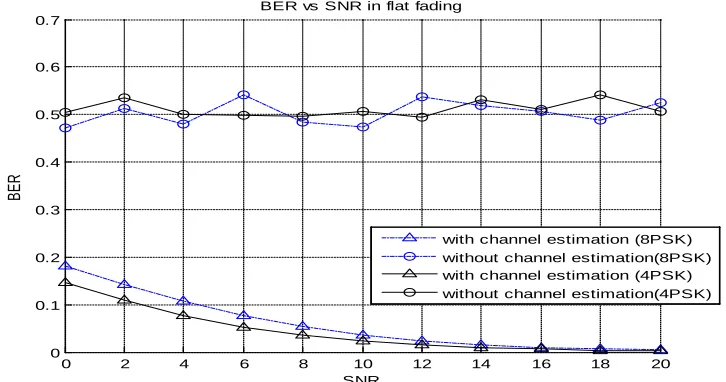
Figure 4: BER VS SNR with or without flat fading
We can get a better idea of robustness of modulation type from received image in figure 3 at low SNR QPSK is performing better than 8PSK however even at higher SNR QPSK is better than 8 PSK but both of them are not completely able to remove all the effects caused by slow fading.
Finally we can see in figure 4 that BER vs. SNR plot the BER of 4 PSK with estimation is lowest.
VI.
CONCLUSION
Image data transmission over slow fading channel is considered for QPSK and 8PSK based modulation at different SNR. The performance analysis based on scatter plot, received image and BER vs. SNR is considered. It is concluded that the data transmission using QPSK based channel estimation with phase adjustment is robust to fading and noise both. Further developments can be done by incorporating OFDM techniques along with 16 or 32 QAM mapping. We can also consider coding methods instead of gray coding.
REFERENCES
[1] P. Schniter, “Low complexity equalization of OFDM in doubly selective channels,” IEEE Transactions on Signal Processing, vol. 52, no. 4, Apr 2004.
[2] I. Barhumi, G. Leus, and M. Moonen, “Equalization for OFDM over doubly selective channels,” IEEE Transactions on Signal Processing, vol. 54, no. 4, Apr 2006.
[3] X. Cai and G. Giannakis, “Bounding performance and suppressing intercarrier interference in wireless mobile OFDM,” Communications, IEEE Transactions on, vol. 51, no. 12, pp.2047–2056, Dec. 2003.
[4] K. Fang, L. Rugini, and G. Leus, “Low complexity block Turbo equalization for OFDM systems in time varying channels,” IEEE Transactions on Signal Processing, vol. 56, no. 11,
pp. 5555–5566, Nov 2008.
29 [7] Y. Mostofi, D. Cox, and A. Bahai, “ICI mitigation for
mobile OFDM receivers,” in Communications, 2003. ICC ’03. IEEE International Conference on, vol. 5, May 2003, pp. 3351–3355.
[8] A. B. Salberg and A. Swami, “Doppler and frequency offset synchronization in wideband OFDM,” IEEE Transactions on Wireless Communications, vol. 4, no. 6, Nov 2005.
[9] M. Stojanovic, “MIMO OFDM over underwater acoustic channels,” in Proceedings of 43rd Asilomar Connference on Signals, Systems and Computers, Nov 2009.