http://www.sciencepublishinggroup.com/j/jeee doi: 10.11648/j.jeee.20170502.14
ISSN: 2329-1613 (Print); ISSN: 2329-1605 (Online)
A Novel Sorting Method Based on Auto-correlation
Function of Coherent Radar Signal
Wei Qing-yun
1, Chen Bei
1, Wang Jing
2, Han Jun
1, Tang Yu-wen
11Air Force Early Warning Academy, Wuhan, China 2
Spic Central Research Institute, Beijing, China
Email address:
[email protected] (Tang Yu-wen)
To cite this article:
Wei Qing-yun, Chen Bei, Wang Jing, Han Jun, Tang Yu-wen. A Novel Sorting Method Based on Auto-correlation Function of Coherent Radar Signal. Journal of Electrical and Electronic Engineering. Vol. 5, No. 2, 2017, pp. 48-52. doi: 10.11648/j.jeee.20170502.14 Received: March 6, 2017; Accepted: April 1, 2017; Published: April 6, 2017
Abstract:
In order to solve the increasing-batch problem in signal sorting, a novel sorting method based on auto-correlation function of coherent radar signal is proposed. By using the instantaneous auto-correlation function of coherent signal, the discrimination model of ratio of peak values was built and applied in sorting simulation. Simulation results show that the proposed approach can solve the Increasing-batch problem for CW, LFM, NLFM one sorting when the signal-to-noise rate (SNR) above 5dB. The validity of the approach is demonstrated by experimental results.Keywords:
Sorting, Coherency, Auto-correlation Function, Ratio of Peak Values1. Introduction
Radar emitter sorting, especially in the unknown Radar emitter sorting in the mixed electromagnetic environment. As we know Radar emitter sorting is an important part of the Electronic Intelligence (ELNT) and Electronic Support Measure (ESM) system. Only on the basis of sorting, we can analyze and extract the feature of emitter signal, then identify the type and nature of threat of the radar.
Traditional emitter sorting measures are based on the 5 parameters. Among them, PRI sorting is the popular measure [1, 2]. Along with developing of electronic technique, Radar technical system become more and more complex, during sorting course, after a sorting many parameters are difficult to sort completely. Because leak of effective characteristic parameters for judging, many signals from different radar with the same frequency always be decided to one emitter by mistake. In recent years, aim at extract new characteristic parameters of radar emitter signal, many measures was
proposed, such as ambiguity function [3], atomic
decomposition [4], empirical mode decomposition [5], phase difference [6] and add parameter character method [7, 8]. Use these methods can improve accuracy rate in sorting signals. But based on these measures cannot solve the increasing-batch problem effectively.
This paper proposed a novel sorting method based on auto-correlation function of coherent radar signal. Do re-sorting to the result of sorting use the instantaneous auto-correlation function. It can judge the parameter is coherent or incoherent, through compare the difference of auto-correlation function, we can make sure if there is increasing-batch problem, complete the first single sorting result.
2. Definition of Instantaneous
Auto-correlation Function
Correlation function is describes the correlation rate among different instantaneous value of random sample. It can be described similarity degree between vibration waveform and other wave when time coordinate move [9]. Signal instantaneous auto-correlation function is correlation function of the current signal and delay signal. It reflect correlation rate between the signals before and after. Coherency as intra-pulse information shows the correlation and continuity of phase information between front and back pulse. Instantaneous auto-correlation function can be used to judge coherency between front and back pulse.
*
( , ) ( ) ( )
Y tτ =s t ×s t+τ (1)
Without time integral is the biggest difference between ( , )
Y tτ and common auto-correlation function, therefore it can
keep instantaneous information of correlation, mathematic express is Y n m( , )
*
( , ) ( ) ( ) 0, 1,
Y n m =s n ×s n+m m= ± ⋯ (2)
*
( ) ( , ) ( ) ( )
m m
Y n Y n m s n s n m
+∞ +∞
=−∞ =−∞
=
∑
=∑
× + (3)3. Simulation of Signal Instantaneous
Auto-correlation Function
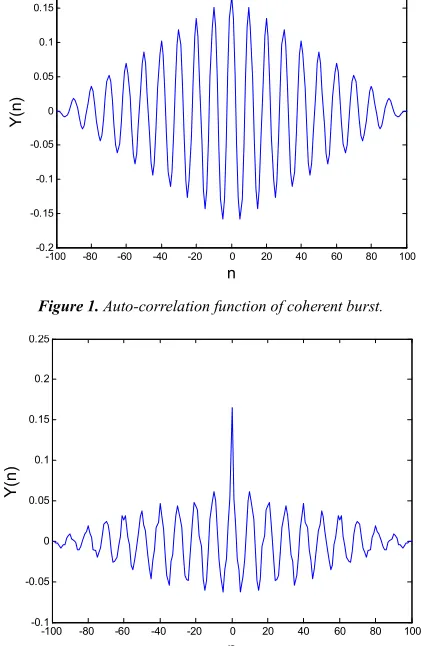
According to received signal and result of the 1st sorting, such as f, PRI, PW etc., calculate with auto-correlation function. Take two bursts, one is coherent burst, the other is incoherent burst. Signal parameters are as follows: IF=30MHz, PRI=30µs,
τ
=10µs. The radar transmitted coherent burst has the same initial phase. The other radar transmitted incoherent burst has different initial phase. Every burst has 10 pulses. Sampling rate is 100MHz . Take the two bursts to do correlation functional operation, simulation results as shown in the Figure 1 and Figure 2.Figure 1. Auto-correlation function of coherent burst.
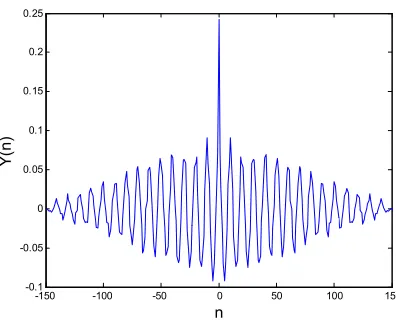
Figure 2. Auto-correlation function of incoherent burst.
From Figure 1 and Figure 2 shows, around zero correlation of coherent burst and incoherent burst are roughly the same. Away from the zero point, correlation of coherent burst is much better than incoherent burst. The correlation of coherent burst declines periodically with growth of the latency time. The correlation of incoherent burst disparities marked between zero and the next peak point. It shows: correlation of incoherent burst is poorer than coherent burst,. The auto-correlation function computation results of coherent burst are in agreement in experiments, no matter how much computing time. For incoherent burst, the result of the
auto-correlation function computation has stochastic
fluctuation.
In order to research the correlation of intra-pulse modulation, take two bursts, one is coherent burst the other is incoherent burst. Signal parameters are as follows: IF=30MHz, bandwidth=10MHz, sampling frequency=100MHz, PRI=
30µs,
τ
=8µs, The radar transmitted coherent burst which has the same initial phase. The other radar transmitted incoherent burst which has different initial phase. Take the two bursts to do correlation functional operation, simulation result as shown in the Figure 3 and Figure 4.Figure 3. Auto-correlation function of coherent LMF burst.
Figure 4. Auto-correlation function of incoherent LMF burst.
From Figure 3 and Figure 4 shows, correlation of LFM burst is similar to correlation of single frequency burst; correlation of coherent LFM single is better than incoherent LFM single.
-100 -80 -60 -40 -20 0 20 40 60 80 100
-0.2 -0.15 -0.1 -0.05 0 0.05 0.1 0.15 0.2 n Y (n )
相相相相相相相相相
-100 -80 -60 -40 -20 0 20 40 60 80 100
-0.1 -0.05 0 0.05 0.1 0.15 0.2 0.25 n Y (n )
-80 -60 -40 -20 0 20 40 60 80
-0.1 -0.05 0 0.05 0.1 0.15 n Y (n )
-80 -60 -40 -20 0 20 40 60 80
Similarly, take two NFM singles, one is coherent pulse, the other is incoherent pulse. IF= 200MHz , bandwidth=10MHz ,
PRI=30µs,
τ
=15µs, The radar transmitted coherent burst which has the same initial phase. The other radar transmitted incoherent burst which has different initial phase. Take the two bursts to do correlation functional operation, simulation result as shown in the Figure 5 and Figure 6.Figure 5. Auto-correlation function of coherent NMF burst.
Figure 6. Auto-correlation function of incoherent NMF burst.
From Figure 5 and Figure 6 shows, the changing rule of auto-correlation function of NFM signal is similar to single frequency signal and LFM signal.
Basing on the above simulated analysis, auto-correlation of coherent signal is better than incoherent signal. Extract this feature can be used as coherent characteristic parameter, and be used for sorting.
4. Analysis and Simulation of Ratio of
Peak Judgment Model
By the analysis of section 2, we can see the biggest difference between coherent and incoherent burst is peak point of auto-correlation function has different change rule. Set the origin for the first peak point, set the peak point close to the origin of the right side for the second peak point, and so on. So, for the signal of the same modulation type, the second peak point value of coherent burst is about two times higher than
incoherent burst. Use this feature peak comparison model is put forward.
4.1. Ratio of Peak Judgment Model
Define the ratio of second peak point and the first peak point as ratio of peak L
max[ ( )]
1 (1)
R m
L m
R
= > (4)
Among them, R(1) is the first peak point of
auto-correlation function which origin corresponds.
According to the simulation conditions described in section 2, the peak model was used to calculate, get the ratio of peak values of various kinds of coherent burst and incoherent burst. As shown in table 1.
Table 1. Ratio of peak values of coherent burst and incoherent burst.
Pulse type coherent burst incoherent burst Modulation mode CW LFM NFM CW LFM NFM ratio of peak value L 0.906 0.876 0.940 0.404 0.334 0.383
By the calculation results, for coherent burst ratio of peak value is close to1; for incoherent burst ratio of peak value is small. By using the difference of this parameter, we can distinguish between coherent burst and incoherent burst.
Do 100 time Monte Carlo experiments, extract single frequency, LFM, NFM signal randomly in the operation, duty ratio of pulse signal is 0.05~0.4, SNR(signal to noise ratio) is Integer-Valued between 5dB to 15dB. The ratio of peak value result of every operation as shown in the Figure 7. Incoherent signal simulation result with dashed line. By the simulation results, the ratio of peak value of coherent burst most are greater than 0.5,while the ratio of peak value of incoherent burst most are less than 0.5. Therefore, define 0.5 as judgment threshold. If the ratio of peak value is greater than 0.5, it can be judged to coherent signal, otherwise judged to be incoherent signal.
Figure 7. 100 operations result distribution curve.
-150 -100 -50 0 50 100 150
-0.25 -0.2 -0.15 -0.1 -0.05 0 0.05 0.1 0.15 0.2 0.25
n
Y
(n
)
-150 -100 -50 0 50 100 150
-0.1 -0.05 0 0.05 0.1 0.15 0.2 0.25
n
Y
(n
4.2. SNR Error
To verify the accuracy and application scope of the decision threshold, we considered the influence of the noise. Choose
IF= 30MHz , sampling rate= 100MHz , PW=10µs, PRI=
50µs, take 10 pulses, we calculate separately when SNR is 5dB, 10dB and 15dB, ratio of peak simulation result in different SNR is shown in the table 2.
Table 2. Ratio of peak simulation result on different SNR.
SNR (dB) 5 10 15 noiseless
ratio of peak value L
coherent signal 0.5717 0.7512 0.8483 0.9058 incoherent signal 0.1733 0.2587 0.2900 0.3349
From simulation result, when there is noise ratio of peak value will be affected. But when SNR is greater than 5dB, ratio of peak value of coherent burst always greater than 0.5. Ratio of peak value of incoherent burst always less than 0.5. That is, although noise affect the result of auto-correlation, but it does not affect the judgment result which used 0.5 as threshold. Ratio of peak judgment measure can be applied to SNR greater than 5dB. It can be satisfied in the real signal environment.
5. Application of Sorting Judgment
Model
Take 10 bursts, SNR (signal-noise ratio)=10dB, The first 5 sets are coherent bursts, parameters are as follows: IF=
30MHz, PRI=50µs,duty ratio respectively are 1 / 3 , 1 / 4 , 1 / 5, 1 / 8 , 1 / 10 , modulation mode respectively are: fixed frequency, linearity frequency modulation (bandwidth 1 0 M H z ), nonlinear frequency modulation (bandwidth 10MHz ), linearity frequency modulation (bandwidth 15MHz ), nonlinear frequency modulation (bandwidth 15MHz ); the following 5 sets are incoherent bursts. Parameters are the same as the previous 5 sets. Use ratio of peak judgment model which based on auto-correlation function for sorting. The results as shown in table 3.
Table 3. Ratio of peak value after the correlation operation (coherent and incoherent signal).
Burst No. 1 2 3 4 5
ratio of peak value L 0.848 0.826 0.782 0.797 0.739
Burst No. 6 7 8 9 10
ratio of peak value L 0.302 0.280 0.275 0.253 0.263
The sorting result indicates ratio of peak value of burst 1, 2, 3, 4, 5 is greater than 0.5, according to judgment rule, it can be judged to coherent signal; ratio of peak value of burst 6, 7, 8, 9, 10 is less than 0.5, which can be judged to incoherent signal. That is consistent with assumption, and validated the effectiveness of the sorting model.
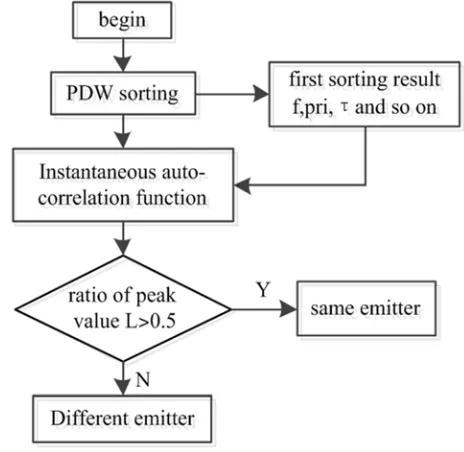
In practical sorting, the signal has same frequency often be misjudged to signal from same emitter, when difference of their modulation parameters is not obvious. That leads to increasing-batch, and will affect to recognition and identification. Use ratio of peak value of auto-correlation
function judgment method can reduce increasing-batch problem and improve the sorting accuracy. Modified signal sorting method based on auto- correlation function flowchart is as shown in Figure 8.
Figure 8. Flowchart of modified signal sorting method based on auto-correlation function.
6. Conclusions
This article proposed a novel sorting method based on auto-correlation function of coherent radar signal. First of all, introduced auto-correlation function definition, then do simulation and analysis with auto-correlation function of coherent radar signal and incoherent radar signal, based on it ratio of peak judgment model is proposed, which was used to sort again. At last designed a sorting method based on the correlation. Simulation results show that the proposed method can solve increasing-batch problem in process of the first sorting for the burst of single frequency, LFM and NFM.
References
[1] Guo Qiang, Zhang Xingzhou, Li Zheng. A new feature extraction method for radar pulse sequences [J]. Journal of Harbin Institute of Technology, 2006, 38 (1): 130-133. [2] Nishguchi K, Kobayashi M. Improved algorithm for estimating
pulse repetition intervals [J]. IEEE Trans on AES, 2000, 36(2): 407-421.
[3] Pu Yunwei, Jin Weidong, Zhu Ming, Hu Laizhao. Extracting the main ridge slice characteristics of ambiguity function for radar emitter signals [J]. Journal of Infrared and Millimeter Waves, 2008, 27(2): 133-137.
[5] Hu Hongying, Kang Jing, and Guan Lina. Instantaneous frequency estimation based on empirical mode decomposition [C]. Proceedings of the 7th Wor1d Congress on Intelligent Control and Automation, Chongqing, China, June 25-27, 2008. [6] Huang Zhitao, Zhou Yiyu, Jiang Wenli. The automatic analysis of intrapulse modulation characte- ristics based on the relatively non-ambiguity phase restoral [J]. Journal on Communications, 2003, 24(4): 153-160.
[7] Han Jun, He Minghao, Zhu Yuanqing, Mao Yan. Sorting of Radar Emitter Based on Multi-Parameters [J]. Journal of Data Acquisition & Processing, 2009, 24(1): 91-94.
[8] Meng Xianghao, Luo Jingqing. Radar Signal Sorting Based on Compositive Characteristic Parameter and Pulse Pattern [J]. Fire Control & Command Control, 2012, 37(9): 50-54. [9] Li Yaojun, Li Ping, Chu Fulei. Multi-vibration signal data
fusion method based on correlation function [J]. Journal of Vibration, Measurement & Diagnosis, 2009, 29(2): 179-183. [10] Zhao Guoqing. Principle of Radar Countermeasure [M]. Xian: