in the population sciences published by the Max Planck Institute for Demographic Research Konrad-Zuse Str. 1, D-18057 Rostock · GERMANY www.demographic-research.org
DEMOGRAPHIC RESEARCH
VOLUME 14, ARTICLE 10, PAGES 179-216
PUBLISHED 10 MARCH 2006
http://www.demographic-research.org/Volumes/Vol14/10/ DOI: 10.4054/DemRes.2006.14.10
Research Article
Race/ethnic differences and age-variation
in the effects of birth outcomes on infant
mortality in the U.S.
Daniel A. Powers
W. Parker Frisbie
Robert A. Hummer
Starling G. Pullum
Patricio Solis
1.1 Race/ethnic variation in pregnancy outcomes 181
1.2 Birth outcome measures 182
1.2.1 Objectives of this research 184
2 Data and methods 185
2.1 Data 185
2.2 Methods 186
2.3 Birth outcome measures 186
2.4 Modeling infant mortality 189
2.5 Model specification 190
3 Results 191
3.1 Race/ethnic variation in age-specific mortality rates 191
3.2 Multivariate analysis 193
3.2.1 Static birth outcome effects model 193 3.2.2 Age-varying Birth Outcome Effects Model 194 3.2.3 Description of birth outcome effects 196
4 Discussion 201
5 Acknowledgements 204
References 205
Appendix A 211
Race/ethnic differences and age-variation in the effects of birth
outcomes on infant mortality in the U.S.
Daniel A. Powers 1
W. Parker Frisbie 2
Robert A. Hummer 3
Starling G. Pullum 4
Patricio Solis 5
Abstract
This paper investigates effects of continuous measures of birth outcomes on U.S. infant mortality for non-Hispanic white, black, and Mexican-American females. Birth outcomes show larger effects on neonatal mortality with smaller effects later on. Unlike static effects models, age-varying effect models of early and late gestational age and small birth weight statistically adjust for the black neonatal mortality disadvantage. While Mexican American infant mortality largely mirrors that of whites throughout the first year, higher neonatal mortality among blacks reflects disadvantaged birth outcome composition. Higher postneonatal mortality among blacks remains, net of birth outcomes, and may largely reflect socio-environmental disadvantages.
1 Direct all correspondence to Daniel A. Powers, Department of Sociology, 1 University Station, A1700, University of Texas at Austin, Austin, TX 78712, USA. E-mail: [email protected]
1. Introduction
Demographic, clinical, and epidemiological research consistently documents the greatly increased risk of mortality among preterm and low birth weight infants (Cramer 1987; Frisbie, Forbes, and Hummer 1998; Hack et al. 1995; Kiely and Susser 1992; Kline, Stein, and Susser 1989; McCormick 1985). Several relatively recent demographic studies (Frisbie, Forbes and Pullum 1996; Frisbie et al. 1997; Hummer et al. 1999) have considered alternative specifications that make finer-grained distinctions than do the conventional dichotomous classifications of birth weight and gestational age. These alternative categorizations of birth outcomes follow in a long tradition (cf. Yerushalmy 1967) and have proven useful in more precisely distinguishing higher-risk from lower-risk infants. However, while typologies constructed by categorizing continuous data may be theoretically justified and yield meaningful results, they inevitably discard potentially important information.
Retaining greater detail and precision in birth outcome measurement would seem to be increasingly important for the study of race/ethnic differentials in infant mortality because of historic changes in the structure of infant mortality that have occurred in the past two decades (Gortmaker and Wise 1997; Wise 2003). There seems little doubt that technological innovations and general improvement in perinatal care have produced a situation in which “the greatest progress in enhancing infant survival occurred in low birth weight and preterm infants” (Alexander et al. 1999b: 71; see also Gortmaker and Wise 1997 and Wise 2003). But, despite substantial general reductions in absolute levels of infant mortality in the United States, the relative black-white disparity in risk of infant death has been increasing (Guyer et al. 1998; Minono et al. 2002). In this context, there is a renewed interest in measurement strategies that retain the continuous metric of birth outcomes (Solis, Pullum, and Frisbie 2000) within meaningful subgroups of gestational age, as suggested long ago by Yerushalmy (1967) and reinforced in more contemporary public health research (Wilcox 2003; Wilcox and Skjœrven 1992). However, a potential problem with all of the aforementioned research is that birth outcome effects are modeled without regard to the widely differing risks of mortality that are highest during the first day of life and decrease throughout the first year (Mathews et al. 2002).
2 discusses data and the statistical models and methods applied to assess birth outcome effects; and Section 3 presents results from this study. Further implications of this research are discussed in Section 4.
1.1 Race/ethnic variation in pregnancy outcomes
The motivation for studies of pregnancy outcomes6 that are comparative by
race/ethnicity is well known. For many years, the greatest concern has been with black-white disparities in that, as far into the past as data exist, the black infant mortality rate has been close to double that of the white rate, and, over the past decade or two, the relative disparity has actually increased up to about 2.4 (Buehler et al. 1987; Guyer et al. 1998; Hoyert et al. 2001; Hummer 1996; Minono et al. 2002). The higher black infant mortality rate is generally attributed to higher mortality at normal birth weights and higher rates of low birth weight (where mortality is higher). However, it is also well documented that blacks face lower birth weight specific mortality at low birth weights (Buehler et al. 1987; Wilcox and Russell 1990), leading to the so-called “pediatric paradox.”
More recently, interest in Hispanic, especially Mexican American, infant mortality has burgeoned, fueled by the consistent finding that the Mexican American infant mortality rate is remarkably similar to the rate among non-Hispanic whites, despite the fact that the former group is quite disadvantaged with respect to socioeconomic status and access to, and/or utilization of, health services (Albrecht et al. 1996; Becerra et al. 1991; Frisbie et al. 1998; Frisbie and Song 2003; Hummer et al. 1999; Rumbaut and Weeks 1991; 1996; Scribner 1996). For example, Mexican Americans, on average, have lower levels of education, less access to prenatal care, and are less apt to have health insurance of any kind than either non-Hispanic blacks or non-Hispanic whites (Frisbie et al. 1997). Reasons for the seemingly paradoxical coupling of relatively positive pregnancy outcomes with a disadvantageous risk profile include positive selection of migration (Frisbie 2005; Palloni and Morenoff 2001) and culturally-based behavioral buffers to morbidity and mortality (Cobas et al. 1996; Guendelman and Abrams 1995; Scribner 1996; Scribner and Dwyer 1989; Rumbaut and Weeks 1991, 1996).
1.2 Birth outcome measures
Categorical measures of birth outcomes have generally received the most attention. Yerushalmy (1967) argued that classification systems should combine birth weight and gestational age into relevant categories. His typology consisted of five categories ranging from very low birth weight (<1500 grams) to moderately low weight (1500 to 2499 grams) to normal weight (>2500 grams) births, with gestational age categories (<37 weeks versus 37+ weeks) dichotomizing the latter two categories. Demographers have employed a less extensive classification for some analyses in which low birth weight (LBW) infants are divided into premature births (<37 weeks gestation and < 2500 grams) and those who are intrauterine growth retarded (37 or more weeks gestation and < 2500 grams), with all births weighing 2500 grams or more classified as normal (Kallan 1993; Hummer et al. 1995). More recent modifications proposed by
Frisbie et al. (1996, 1997) distinguish heavy premature infants (<37 weeks, ≥2500
grams) and also incorporate the fetal growth ratio (Kramer et al. 1988, 1989) as a means of identifying immature births that would not be detected using conventional measures. In many respects, these classifications were created to reflect specific analytic problems and interests of researchers. To the extent that they simplify analysis and interpretation of patterns of association, there is much to recommend their use. But, as alluded to previously, categorical measures are limited in important ways. First, categories inherently involve fixed cutoff points in the continuous distribution of birth outcomes and thus create an image of discontinuity in the association between birth outcomes and infant mortality. Second, significant variation within categories is ignored, thus implying homogeneity of risk within categories of birth outcomes. Solis et al. (2000) note the obvious problem that arises when conventional birth outcome dichotomies are employed (i.e., a cut-point of 37 weeks gestation to distinguish preterm from term births and 2500 grams as the cut-point distinguishing low from normal weight births). For example, an infant born at 36 weeks gestation is treated as having the same risk of death as one born at 30 weeks, and as being at much greater risk of
death than one born at 37 weeksat best, a gross oversimplification. Perhaps less often
of birth weight and gestational age that yield the lowest levels of infant mortality, and modeled both main and interaction effects of these birth outcome dimensions, thus allowing a more precise evaluation of the relationship of each birth outcome with infant mortality risk.
Recent efforts to improve measurement of birth outcomes have complemented, and to some extent arisen from, unresolved issues regarding the relationship between birth outcomes and infant mortality risk. Therefore, it is of considerable interest to determine whether recent alternative measurement approaches permit us to learn more about race/ethnic disparities in infant mortality. Another issue involves the debate over the causal significance of birth weight. Contrary to the conclusion reached in the vast majority of literature on the subject, Wilcox (2001a, 2001b) has argued that the association between birth weight and infant mortality is non-causal. If this interpretation is correct, then “(e)limination of LBW (low birth weight) is neither practical nor necessary in order to achieve the lowest possible rates of infant mortality” (Wilcox 2001a: 1238). While there have been challenges to the Wilcox perspective (David 2001; Hertz-Picciotto 2001), the recent debate is more than a little reminiscent of an earlier concern, expressed primarily in the public health literature, that birth weight and gestational age play somewhat separate roles in infant survival, but unfortunately, “attention has been diverted from the task of establishing the independent effects of gestational age and size” (Kline et al. 1989: 173; see also Yerushalmy 1967 and Battaglia and Lubchenco 1967).
A potentially serious shortcoming of much research in this area is the failure to systematically consider models that allow age variation in the effects of birth weight
and gestational age on infant mortality risk.7 A disproportionate number of all infant
deaths in the United States occur in the neonatal period (deaths prior to the 28th day of life), and a majority of neonatal deaths occur within the first week (Alexander et al. 1999b), with considerable concentration in the first day (Preston et al. 2001). Although numerous studies have focused separately on the effects of birth outcomes on neonatal (deaths to infants <28 days of life) and postneonatal mortality (deaths from the 28th day through the remainder of the first year), potentially important sources of age variation in the neonatal period are often ignored. Further, it may be that both the main and conjoint effects of birth weight and gestational age interact with infant age in influencing mortality risk throughout the first year of life.
1.2.1 Objectives of this research
In general, we are interested in the extent to which birth weight and gestational age influence infant mortality risk and the extent to which race/ethnic variation exists in this relationship. More specifically, the objectives of the present research are to: (1) apply alternative measurement strategies that preserve the continuous metric of birth weight and gestational age in the modeling of the relationship between birth outcomes and infant mortality risk based on recent data available for the nation as whole, (2) construct models for non-Hispanic blacks and Mexican Americans, as well as for non-Hispanic whites, based on race/ethnic-specific birth weight distributions, and (3) model the age-specific mortality rate and assess the assumption of proportionality in the effects of birth outcomes on infant mortality. (4) Finally, since our approach incorporates both the main and conjoint effects of gestational age and birth weight, the results should allow some additional insight into the question of the relative magnitude of each on infant mortality risk.
2. Data and methods
2.1 Data
The data employed are the National Center for Health Statistics (NCHS) linked birth/infant death cohort files for 1995-1998, which include all infants born alive in the U.S. during those years and mortality information for the subset of infants in the cohorts who died during the first year of life. The data set consists of approximately
four million cases each year, and the match rate is exceptionalas early as 1989, more
than 97% of death records were successfully linked to a birth certificate (U.S. Department of Health and Human Services 1995). Also beginning in 1989, a clinical estimate of gestational age was included, which NCHS uses, along with other diagnostic techniques, to arrive at more accurate recording of gestational age than is possible by the conventional method of subtracting date of birth from date of last normal menses. As recommended by NCHS, mother’s race/ethnicity is used to distinguish non-Hispanic Whites (hereafter, “Whites”), non-Hispanic Blacks (hereafter “Blacks”) and Mexican Americans.
2.2 Methods
We incorporate recent developments in the continuous measurement of birth outcomes as advocated by Solis et al. (2000) and others (e.g., Wilcox and Skjœrven 1992), in which birth outcomes are measured as deviations from optimal combinations of birth weight and gestational age for infant survival. However, we extend this general approach in important ways. First, we broaden the analysis to include non-Hispanic
blacks and Mexican Americanspopulations that have rarely been previously analyzed
in this manner. In so doing, we highlight race and ethnic differences in the effects of birth outcomes on infant mortality using recent data for these populations. Further, we estimate proportional hazard models of infant mortality that allow effects of birth outcomes on the risk of infant death to vary by age of death during the first year of life, thus allowing for nonproportional effects. Proportional hazards models with age-varying effects permit a more rigorous assessment of the differential impact of continuously measured birth outcomes, and their interactions, on age-specific infant mortality than do the more widely-used static models that assume constant effects throughout the first year of life. We define age intervals to broadly distinguish between mortality in the neonatal and postneonatal period, and also within finer subdivisions (within the 1st day, 1 to 7 days, and 7 to 28 days) in the neonatal period.
2.3 Birth outcome measures
differences between the mean birth weight and the optimum birth weight are nearly the same regardless of race (Chung 1967). The Appendix to this paper provides additional details about the birth weight optimum obtained by Solis et al. (2000), in addition to evidence that one standard deviation above the gestational age specific mean is a reasonable survival optimum birth weight for white and black females using the 1995-1998 data. Our preliminary results suggest that the survival optimum for Mexican American females is somewhat closer to the gestational age-specific mean birth weight. In the present context, where race/ethnic differences in effects of birth outcomes are the focus, this standardization approach allows the comparison of mortality for infants of the same relative weight (i.e., relative to the race/ethnic specific distribution of birth weight). When gestational age-specific standardization is used, this identifies infants that are large or small for their gestational age and permits a comparison to infants of the same relative sizes at other gestational ages (Wilcox and Skjœrven 1992). Although Wilcox and Russell proposed that gestational age birth weight standardization be used, they argued that comparisons of populations based on a single standardization were biased. Instead, they argued in favor of the use of population-specific standards (Wilcox and Russell 1983). There is considerable debate in the epidemiological literature on the use of population-specific standards in the study of infant mortality. Population-specific standards have been criticized because they may obscure unexplained population differences (Wise and Pursley 1992). If this is the case, then the use of race/ethnic-specific distributional standards makes comparisons of birth outcome effects across races more problematic insofar as we do not know to what extent observed race/ethnic differences are due to distributional differences or differences in the effects of birth outcomes. However, as Wilcox and Russell (1983) and others have argued, standardization by conventional means, such as using the white birth weight distribution or another single standard, will tend to obscure race/ethnic differences, and lead to comparisons that are biased against the population with heavier birth weights. Platt et al. (2004a) have cautioned that the (race/ethnic specific) relative birth weight standardization approach may create analytic problems due to confounding by gestational age. However, these authors have not addressed possible bias associated with the approach of Wilcox and Skjœrven 1992, which makes use of gestation-specific standardization (i.e., relative birth weights constructed for each gestational age stratum), and may better isolate the effects of birth weight and gestational age than
would a standardization based on birth weight alone.8 As Adams et al. (1991) have
argued, when population standards are used without an accounting of gestational age, analysis may not detect important race/ethnic differences such as the relative survival advantage of black infants at short gestations. Our purpose here is not to bring closure
to this debate but to show the relevance of modeling age-variation in the effects of components of infant mortality risk that reflect the main and conjoint effects of birth weight and gestational age. We next provide the details about the construction of these birth outcome measures.
For each race/ethnic group, a measure S (small) is defined as the difference
between one-standard deviation (σj) above the mean birth weight at gestational age j
(µj) and the ith infant’s birth weight (Wi), which corresponds to a negative deviation
from optimum. More formally,
( )
1 ,
j j i
i i
j
W
S = µ σ+σ − = −Z (1)
where Zi is the ith infant’s standardized birth weight score based on the gestational
age-specific mean and standard deviation. This measure is positive when 1 – Zi > 0 and 0
otherwise. This measure can be interpreted as the additive effect on the mortality risk due to a decrease in birth weight beyond the gestational age-specific optimum. This is analogous to Wilcox and Russell’s (1983) formulation of “risk from low birth weight,”
R1. As noted in their paper, the relationship between birth weight and mortality follows
the form of a dose-response curve, which is “widely used in biological assay to describe mortality from an increasing and potentially lethal dose.” (Wilcox and Russell 1983:323). Similarly, an infant is classified on a continuum of heavy birth weight (H) if birth weight exceeds the gestational age-specific optimum, defined as the difference between the ith infant’s birth weight and one standard deviation above the gestational age specific mean, or
( )
1,
i j j
i i
j
W
H = − µ σσ + =Z − (2)
where Zi is the standardized score defined above. This measure is positive when Zi – 1
> 0 and 0 otherwise.9 This term is analogous to Wilcox and Russell’s (1983) measure
of “risk from high birth weight,” R2, and is meant to capture the increase in risk
associated with increases in birth weight beyond the gestational age-specific optimum. The measures S and H are calculated separately for each race/ethnic group, thus giving race/ethnic specific standardizations. This construction implicitly recognizes that gestational age and birth weight may vary together in different ways for different racial and ethnic groups depending, for example, on social context. The population parameters
underlying the standardization are provided in the Appendix (Table A1). Together these terms comprise the birth weight risk components.
In addition to birth weight risk components, we also consider variables that capture the gestational age component of the risk. The variable E (early) is defined in terms of positive deviations (in weeks) below the optimal minimum of 39 weeks of gestation. This captures the increased risk associated with preterm birth. The variable L (late) measures gestational age risk associated with births later than the 41st week. More formally, if A denotes an infant’s gestational age in weeks,
Ei = 39 – Ai, if Ai < 39, and 0 otherwise, (3)
and
Li = Ai – 41, if Ai > 41, and 0 otherwise. (4)
The measures S and H can be viewed as independent competing risks that can be combined to form what Wilcox and Russell (1983) term the “total risk,” which is, more specifically, total birth weight risk. In principle, this is also true with regard to the gestational age (preterm/postterm) measures E and L. It follows that total risk should be modified to include the sum of all of these measures. However, risks are no longer independent, as certain combinations (early and small, heavy and late, etc.) are expected to have effects on risk beyond that predicted from main effects alone. Therefore, we include interactions between preterm/postterm risks (E and L) and birth weight risks (S and H) in our multivariate models.
2.4 Modeling infant mortality
Individual-level multivariate models of infant mortality are usually modeled as binary (lives/dies) outcomes (e.g., Hummer et al. 1999) with the log-odds of infant mortality as the usual focus of investigation. Logistic regression models of this type do not fully capture the dynamic of mortality in the first year of life. By the last decade of the 20th century, about 65% of all infant deaths in the U.S. occurred during the first month of life, with the vast majority of the latter (about 80%) occurring during the first week (National Center for Health Statistics 1996: Table 23). For this reason, it is useful to form subdivisions by age that are more detailed than the usual dichotomy (i.e., live versus die) or trichotomy (e.g., neonatal death, postneonatal death, and survival).
Our models consider distinct periods of risk of infant death within intervals of 1st
week, one week to less than 28 days, and 28 days to 1 year. We consider the following proportional hazard model for the risk of mortality h(t) in the first year of life
0
( )i ( )exp{k i' ( k)},
h t =h τ x β τ (5)
where h0(τk) represents a piecewise constant baseline hazard that is constant within age
intervals of [0-1), [1-7), [7-28), and [28-365) days. This model allows for non-proportional covariate effects through a set of time-varying effects β(τk) of covariates x,
denoting birth outcome measures and interaction terms.
Proportional hazards models with time-varying covariates have been used to study perinatal mortality using a “fetuses at risk” approach based on gestational age as the time axis (Platt et al. 2004b). This approach addresses the key issues associated with the use of gestational age as an independent variable. Specifically, the temporal nature of gestational age implies that gestational ages are not “exchangeable” in the sense that an infant born at a later age was in the risk set for all earlier birth dates, but that infants born earlier are not members of the risk sets for later gestational ages. This approach has been criticized by Wilcox and Weinberg (2004) for ignoring time since birth, arguing that both the gestational age time scale and the time since birth are relevant to an infant’s risk. Accordingly, the approach we follow treats gestational age as a covariate and considers the time since birth as the temporal component of risk.
2.5 Model specification
We estimate the model above using the methods described by Laird and Oliver (1981), in which the data are grouped according to unique values of S, H, E, L, and T (with T denoting a factor representing the 4 age intervals). Aggregating the data this way results in a matrix of counts and exposures that can be fit using conventional log-linear models, where the number of infant deaths in each cell of the table follows a Poisson
distribution and the logarithm of exposure to riskmeasured in person-days in the
intervalis treated as an offset term in the model. This approach yields considerable
Model 1:
ijklm T S H E L SE HE i j k l m jl kl ijklm
D
R =λ λ λ λ λ λ λ ` (6)
and
Model 2:
, ijklm T S H E L TS TH TE TL TSE THE
i j k l m ij ik il im ijl ijk ijklm
D
R =λ λ λ λ λ λ λ λ λ λ λ (7)
where Dijklm denotes the number of infant deaths in time interval i, at the jth value of S,
the kth value of H, the lth value of E and the mth value of L, and Rijklm is the number of
person-days of exposure to risk in the ijklm cell of the I × J × K × L × M table. The absence of an intercept term allows a parameterization of the baseline hazard, which contains the infant age-specific mortality rates adjusted for covariates. Certain two-way
interactions such as “small × heavy” and “early × late” are not possible, thus limiting
the higher-order interactions involving these terms.
Our initial model (Model 1, above) for each race/ethnic group is similar to the logit model fit by Solis et al. (2000). This model allows the baseline mortality rate to vary by age of infant but assumes age-constant (or static) effects of birth outcomes, thus providing a parsimonious baseline model for comparison with Model 2, which relaxes the assumption of age-invariant birth outcome effects. Model 1 differs from Solis et al. (2000) by estimating an specific baseline hazard, whereas Model 2 includes an age-specific baseline hazard in addition to age-age-specific birth outcome effects.
3. Results
3.1 Race/ethnic variation in age-specific mortality rates
Assessing the age-specific rates for these two groups, we find that the relative risk of mortality on the first day is about 9 times the risk of mortality in the first week (i.e., 939/101 for whites and 930/100 for Mexican Americans). Mortality risk during the first day is about 30 times higher than in the first month, and is more than 185 times the risk in the postneonatal period.
For blacks, the risk of mortality is about 11 times higher during the first day relative to the first week (i.e., 1794/169). This is about 14% higher than the corresponding white and Mexican-American relative risks when comparing the same two periods. The black mortality risk on the first day relative to the first month is about 30 times higher, which is similar to the corresponding relative risks among whites and Mexican-Americans. Due to the higher mortality of blacks in the postneonatal period, the relative risk of mortality on the first day is 163 times the risk in the postneonatal period, which is about 13% lower than the corresponding relative risks for the other two groups when comparing the same two periods.
Table 1: Age-specific infant mortality rates and relative risks by race/ethnicity
Mortality Rate per 1,000,000 Person Days* Relative Risk
Age Interval White Black
Mexican-
American Black/White Mexican- American/White
day [0 – 1) 939 1794 930 1.911 0.991
day [1 – 7) 101 169 100 1.673 0.995
day [7 – 28) 30 60 32 1.976 1.053
day [28 – 365) 5 11 5 2.289 0.997
Source: 1995-1998 NCHS linked birth/infant death files. * Rounded to nearest whole number
3.2 Multivariate analysis
The results in Table 1 are based on a model that includes only the baseline hazard expressed in age-specific rates per 1,000,000 person-days of life; this model reproduces the average empirical age-specific mortality rates that would be observed in the pooled
1995-1998 NCHS data.10 Next, we consider models that include the main effects of
early (E), small (S), late (L) and heavy (H), in addition to the interaction terms for early
× small (E × S) and early × heavy (E × H) to capture effects of prematurity and low or
high birth weight occurring jointly. In all models considered here, interaction effects
involving late and small (L × S) and late and heavy (L × H) were not statistically
different from 0 conditional on other model effects, so we ignore these terms.
3.2.1 Static birth outcome effects model
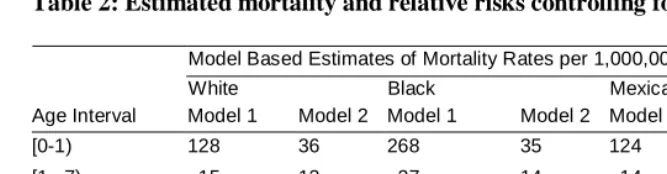
Table 2 provides estimates of the baseline hazard rates in deaths per million person-days, conditional on main and interaction effects of birth outcomes for each of the two models outlined earlier. Model 1 includes only the main effects of birth outcomes and their interactions, while Model 2 allows for nonproportionality in birth outcome effects. Compared to the empirical rates shown in Table 1, the estimated baseline hazards are, as expected, greatly attenuated when controlling for birth outcomes. Model 1 accounts for 80 to 87 percent of the observed mortality, with the greatest impact on Mexican-American neonatal mortality and the smallest effect on black postneonatal mortality. However, despite controls for birth outcomes, the relative race/ethnic comparisons based on Model 1 of Table 2 do not differ appreciably from the race/ethnic comparisons based on the empirical age-specific rates shown in Table 1. For example, the empirical and model-based estimates of the mortality risk for backs are 1.5 to 2.5 times that of whites and Mexican-Americans for deaths occurring at all ages, with a high degree of correspondence between the empirical and model-based relative risks at any given age. Although static models of birth outcomes yield considerable reductions in predicted mortality, they do little to alter the observed age-specific patterns of relative risks. Specifically, static models do not change the overall picture of black disadvantage at any age relative to other groups.
10 Letting D
i and Ri denote, respectively, the number of deaths and the number of person days of exposure in the ith age interval, the yearly
mortality rate can be computed as ∑Di/Ri. Letting pi denote the period-specific rates given in Table 1, we construct the yearly mortality rate as
∑piRi. For example, carrying this out on the rates in Table 1 gives a yearly mortality rate for white females of 3,857 infant deaths per 1,000,000
Table 2: Estimated mortality and relative risks controlling for birth outcomes
Model Based Estimates of Mortality Rates per 1,000,000 Person Days
White Black Mexican-American
Age Interval Model 1 Model 2 Model 1 Model 2 Model 1 Model 2
[0-1) 128 36 268 35 124 30
[1– 7) 15 12 27 14 14 9
[7 – 28) 5 4 10 7 5 4
[28 – 365) 1 1 2 4 1 1
Relative Risks
Black/White Mexican-American/White Age Interval Model 1 Model 2 Model 1 Model 2
[0-1) 2.089* 0.962 0.965 0.954
[1– 7) 1.821* 1.158 0.952 0.832
[7 – 28) 2.162* 1.760* 1.007 1.096
[28 – 365) 2.524* 2.673* 0.955 0.961
Source: 1995-1998 NCHS linked birth/infant death files. *Effect does not cover 1.0 with 95% confidence.
3.2.2 Age-varying birth outcome effects model
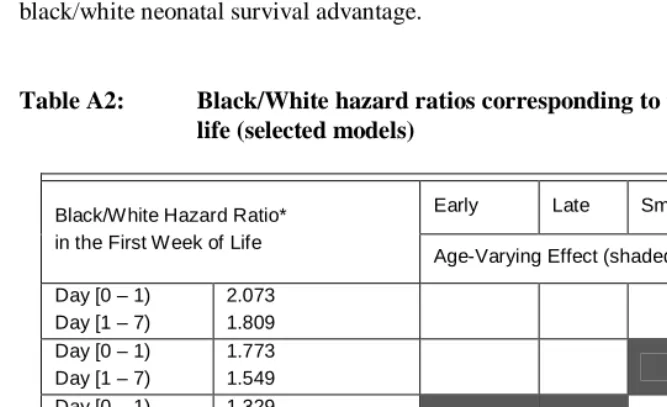
associated with infant deaths that occur during the later infant ages, are consequently less able to explain infant mortality disparities beyond the neonatal period. This is discussed in more detail in Appendix A.
Our findings suggest that the black disadvantage during the first week of life is due to heterogeneity in the composition of birth outcomes, such that if the composition of birth outcomes were similar for blacks and whites (even considering a race-specific birth-weight standard for both groups, as in this case), differences in mortality risk during the first week would disappear. Our results are consistent with findings from other bodies of research that focus more squarely on population differences in birth outcome distributions. Researchers using parametric mixture models to identify latent primary and secondary birth weight subpopulations within advantaged (white) and disadvantaged (black) populations provide explanations for the “pediatric paradox” of lower mortality among low-birth-weight blacks compared to low-birth weight whites. Specifically, Gage et al. (2004) argue that the mortality advantage of the low-birth-weight black population is due entirely to lower mortality among the low-birth-low-birth-weight compromised (i.e., low birth weight, small for gestational age, intrauterine growth
retarded, macrosomic, etc.) births. This research also suggests that the black
compromised subpopulation may be more highly selected through fetal loss than the white compromised subpopulation.
Disparities in infant mortality are the result of differences in composition as well as differences in “return to risk.” Blacks are immensely disadvantaged in compositional terms due to the much greater proportion of black births that occur at low weights and short gestations—adverse birth outcomes which are the most powerful predictors of infant death. Our findings may reflect compositional differences in the birth weight distribution. Black infants in this data set are 264 grams lighter than whites on average. The risks of low birth weight (< 2500 grams) and very low birth weight (< 1500 grams) are, respectively, 2.35 and 3.14 times higher for blacks than for whites
3.2.3 Description of birth outcome effects
We turn now to a direct examination of birth outcome effects from Models 1 and 2. Table 3 compares the age-invariant birth outcome effects of Model 1 to the age-varying effects of Model 2, thus providing a direct assessment of variation in birth outcome effects and a comparison to the corresponding age-invariant effects. The second panel of Table 3 displays ratios of estimated birth outcome effects for blacks and Mexican Americans relative to the corresponding estimates for whites. In addition to discussing the estimates presented in Table 3, we will also make comparisons of effects within this table in order to assess differences in these effects by age. It should be noted that all main effects (early, late, small, and heavy) showed evidence of age variation when age periods [0–1) , [1–7), and [7–28) are contrasted against postneonatal baseline effects.
We focus first on birth weight outcomes “small” and “heavy.” Table 3 shows that being smaller or heavier than the gestational age-specific optimum has the largest effect on infant mortality for all three race/ethnic groups. The effects of being more than one standard deviation below the gestational age-specific optimal birth weight diminish with age, and are generally larger for whites and Mexican-Americans and smallest among blacks. However, we find significant race/ethnic differences only when comparing black/white mortality beyond the first week. For example, working directly with the age-specific effects, we note that the effects of small birth weight on mortality occurring in the neonatal period are uniformly higher (15 to 86 percent higher per standard deviation below the gestational age specific optimum) than in the postneonatal period. Among blacks, as compared to Mexican Americans and whites, the risk
associated with low birth weight is uniformly smaller in both Models 1 and 2a result
consistent with the previously documented survival advantage of low birth weight blacks, compared to their white counterparts (Kline, Stein, and Susser 1989; Wilcox and Russell 1986, 1990). With regard to age-variation in the low birth weight effect for blacks relative to other groups, we find that the risk associated with low birth weight for blacks in the first day is 18% higher than in the postneonatal period.11
The effect of being heavier than the optimum weight for gestational age also varies by age (Table 3, Panel 1). If we ignore age variation (Model 1), the effect of being more than one standard deviation above the gestational age-specific mean birth weight is to increase mortality by 63% to 108% (depending on race/ethnicity) per standard deviation increase in birth weight beyond the optimum, with the smallest effect observed for blacks and the largest effect for Mexican-Americans. We find a pattern of monotonic decline in the effect of heavy birth weight by age for whites and blacks, whereas the age
Table 3: Fixed and varying effects of birth outcomes on infant mortality: U.S. females, 1995-1998
Race/Ethnic Comparisons
White Black Mexican -American Black/White
Mexican-American/White
Multiplicative Effects
Model 1 Model 2 Model 1 Model 2 Model 1 Model 2 Model 1 Model 2 Model 1 Model 2
early 1.407* --- 1.274* --- 1.356* --- 0.906* --- 0.964* ---
early [0 – 1) 1.577* 1.484* 1.479* 0.941* 0.938*
early [1 – 7) 1.436* 1.324* 1.388* 0.922* 0.967
early [7 – 28) 1.415* 1.320* 1.377* 0.933* 0.973
early [28 – 365) 1.264* 1.191* 1.262* 0.943* 0.999
late 1.141* --- 1.179* --- 1.145* --- 1.034 --- 1.003 ---
late [0 – 1) 1.102* 1.307* 1.213* 1.186* 1.101
late [1 – 7) 1.044 1.185* 1.081 1.135 1.035
late [7 – 28) 1.142* 1.208* 1.053 1.057 0.922
late [28 – 365) 1.127* 1.106* 1.130* 0.981 1.002
small 2.266* --- 1.813* --- 2.253* --- 0.800* --- 0.994
small [0 – 1) 3.123* 3.022* 3.174* 0.968 1.016
small [1 – 7) 2.484* 2.240* 2.640* 0.902 1.063
small [7 – 28) 2.365* 1.951* 2.228* 0.825* 0.942
small [28 – 365) 1.976* 1.626* 1.933* 0.823* 0.979
heavy 1.842* --- 1.627* --- 2.077* --- 0.883* --- 1.127
heavy [0 – 1) 2.520* 2.615* 1.881* 1.038 0.747
heavy [1 – 7) 2.208* 2.127* 2.820* 0.963 1.277
heavy [7 – 28) 2.040* 1.821* 1.988* 0.893 0.975
heavy [28 – 365) 1.434* 1.254* 1.789* 0.874 1.247*
early ×small 1.030* --- 1.055* --- 1.043* --- 1.025* --- 1.013* ---
early × small [0 – 1) 1.018* 1.037* 1.046* 1.019* 1.027*
early ×small [1 – 7) 1.027* 1.061* 1.039* 1.032* 1.011
early × small [7 –28) 1.036* 1.054* 1.046* 1.017 1.009
early × small [28 – 365) 1.025* 1.035* 1.026* 1.010 1.001
early × heavy 0.935* --- 0.957* --- 0.957* --- 1.023* --- 1.024 ---
early × heavy [0 –1) 0.949* 0.960* 0.996 1.012 1.049
early × heavy [1 – 7) 0.908* 0.918* 0.882* 1.011 0.971
early × heavy [7 – 28) 0.904* 0.939* 0.956 1.039 1.057
early × heavy [28 – 365) 0.927* 0.960* 0.969 1.036 1.045
pattern for Mexican-Americans is generally inverted J-shaped. Moreover, for blacks and whites, there are significant differences in the heavy birth weight effects when comparing effects in the neonatal period to those in the postneonatal period. For example, the effect on mortality within the first day is 1.76 to 2.09 times higher—per standard deviation increase in birth weight beyond the gestational age-specific optimum—relative to its effect on mortality in the postneonatal period for whites and blacks respectively. For Mexican-Americans, there is evidence of a larger relative effect of heavy birth weight on mortality, but only during the first week. The only noticeable racial/ethnic difference in the effect of heavy birth weight occurs between Mexican-Americans and whites, with a standard deviation increase in birth weight above the gestational age-specific optimum increasing the postneonatal mortality risk of Mexican-Americans by 25% over that of whites.
We now discuss the effects of gestational age. Table 3 shows that gestational age earlier than the 39th week has a moderate impact on all race/ethnic groups, with a somewhat larger effect for whites and Mexican-Americans than for blacks. These effects diminish with age for all groups, such that the effects of early gestational age on neonatal mortality across all groups are 10 to 25 percent higher (per week of gestational age below the 39th week) than the corresponding effects on postneonatal mortality, with larger neonatal/postneonatal differences evident for whites and blacks. Panel 2 of Table 3 shows that the effect of early gestational age among blacks is 92 to 94 percent of the white effect. The impact of short gestation among Mexican-Americans is somewhat smaller compared to whites within the first day, but there is no evidence of Mexican-American/white differences for the other age intervals (based on a statistical comparison of the relative effects across selected age intervals).
Blacks face the greatest mortality disadvantage relating to gestational age later than the 41st week. The effects at all ages are statistically different from 1.0, with the largest effect (1.307) occurring on the first day. Among Mexican-Americans, the effects of late birth are generally smaller and significantly different from 1.0 only within the first day and during the postneonatal period. Among whites, age-varying effects of late birth are significant (except for days 1 to 7), and roughly similar in pattern to the results for blacks. Race/ethnic comparisons in Panel 2 show that the risks (relative to whites) associated with late birth are small for blacks and Mexican Americans, with the only significant effect being that blacks face a risk that is 18% higher than whites within the first day of life. In terms of age-variation, the risk of late gestational age on mortality in the first day—relative to postneonatal mortality—is 21% higher (per week beyond the 41st) for blacks compared to whites or Mexican-Americans. Accounting for age variation in the effect of late gestational age (especially on mortality within the first day) may contribute to the elimination of the observed black disadvantage (relative to whites) in the first week of life as shown in Table 2.
Being born both early and small is associated with a modest additional increase in risk, whereas being born early and heavy additionally lowers the risk for all groups beyond the main effects. The third-order interactions allowing for age-varying effects
are “offsetting” in the sense that the early × small × age interaction increases risk
slightly, and the early × heavy × age term reduces risk. Results show no evidence of a
monotonic pattern of decrease or increase in either of these effects by age, and the effects of these interactions on neonatal mortality do not differ significantly from their corresponding effects on postneonatal mortality. Therefore, simple interaction terms— rather than age-varying interactions—would yield a more parsimonious model.
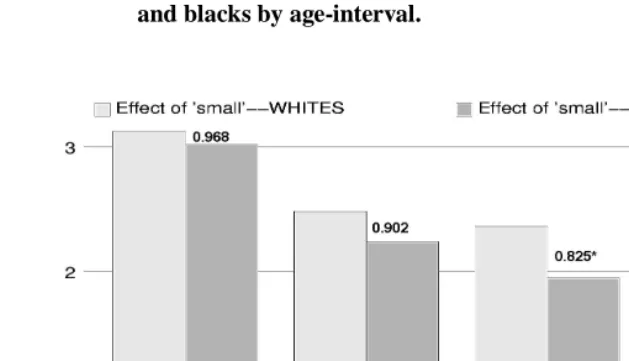
The main relationships described above may be summarized graphically as in Figures 1 and 2, which show the dynamics of the major birth outcome effects by age in a comparison of whites and blacks. Figure 1 shows the multiplicative effects associated with a one standard deviation decrease below the gestational age- and race-specific optimum birth weight, and the behavior of this effect during race-specific age periods during the first year. The effects for whites are respectively 3.123, 2.484, 2.365, and 1.976 times higher for each standard deviation below optimum birth weight in each of the age intervals. The effects for blacks are somewhat lower than the white effects in the first two age intervals (3.022 and 2.240), but are markedly lower in the later two periods (1.951 and 1.626). These later effects are about 17% lower than the corresponding effects for whites. Both groups exhibit significant differences between the earlier effects and the effects during the postneonatal period.
effect). However, given the low variability in gestational age, these apparently small effects (measured in weeks) represent significant multipliers of the mortality risk. This graphical evidence suggests that simpler models of linear age variation in the birth outcome effect may be adequate.
Figure 1: Race-specific and relative effects of being more than one standard deviation below the race-specific optimum birth weight for whites and blacks by age-interval.
Figure 2: Race-specific and relative effects of being more than one week below the 39th week of gestational age for whites and blacks by age-interval.
4. Discussion
This paper investigates infant mortality in the U.S. for the years 1995-1998 for white, black, and Mexican-American females. The results of a relatively straightforward expansion of the work of Solis et al. (2000) to include blacks and Mexican Americans showed that the risk of infant death in each of the race/ethnic groups notably increased at birth weights lower or higher than the optimum and early gestational age. In the case of both blacks and Mexican Americans, just as for whites, being born both early and light resulted in a modestly and significantly higher risk than would be expected based on main effects. Conversely, infants born at weights that are heavy relative to gestational age were at reduced risk compared to what would be expected based on main effects only.
higher mortality experienced by black females in the early neonatal period (from the 1st
to the 7th days), and to some degree during the later neonatal period (7th to 28th days).
Our tentative conclusion based on a series of simpler models described in Appendix A is that age-varying effects of early and late gestational age and small birth weight statistically account for the observed black disadvantage in the early neonatal period (less than one week). Lack of variation in the effects of late gestational age for whites and Mexican-Americans may be partially responsible for this finding. Specifically, the effect of late gestational age on mortality in the first day relative to the postneonatal mortality is about 21% higher for blacks than the corresponding age effect for whites and Mexican-Americans. Our models are less able to account for the relatively higher mortality experienced by black females in the late neonatal (one week to one month) and postneonatal periods, periods of time when social and environmental influences on differential mortality risk begin to become more pronounced together with a greater likelihood of infants dying of more exogenous, rather than endogenous, causes (Eberstein et al. 1990).12
The reduced black/white differential in neonatal mortality risk may also be the result of a relatively larger effect of small birth weight on mortality in the first day relative to postneonatal mortality, which is about 18% higher in the black population than the corresponding white effect. Disparities in infant mortality are the result of differences in composition as well as differences in “return to risk.” Blacks are immensely disadvantaged in compositional terms due to the much greater proportion of black births that occur at low weights and short gestations—adverse birth outcomes that are the most powerful predictors of infant death. Our findings may reflect compositional differences in the birth weight distribution.
A clear limitation of the present work is the assumption that one standard deviation above the gestational age-specific mean birth weight defines the survival optimum birth weight for all racial and ethnic groups. Although one standard deviation appears to represent a reasonably close approximation of the survival optimum for white female infants, deviations of greater or lesser magnitude may more closely reflect the optimum for other race/ethnic groups. Our research uses race/ethnic-specific measures of birth weight to construct gestational age-specific scores that denote departure from average birth weight for a particular gestational age. But this constitutes only a partial response to the concern raised by Alexander et al. (1999b) about the validity of the “one-size-fits-all” assumption. Specifically, these authors suggest that because “the general norms for preterm, postterm, and fetal growth measures may be largely derived from white populations, more information is needed to assess whether or not the ongoing use of these one-size-fits-all standards may result, for other ethnic groups, in invalid risk
assessments and the misidentification of infants in need of intervention services” (Alexander et al. 1999b: 77). To fully address this issue, it would be necessary to determine as precisely as possible the magnitude of the deviation from a race/ethnic-specific mean that is required to maximize survival for that race/ethnic-specific group. A promising area of future research will be to rigorously determine race/ethnic-specific optima, a process begun by Echeverria-Cruz (2004) and Adams et al. (1991). Wilcox and Russell (1986) show how this can be done using birth weight as a covariate in two separate logit models that partition the perinatal mortality risk into two separate risks, one that decreases with birth weight and one that increases. The optimum is determined by the intersection of the two fitted logit lines. However, this approach does not consider gestational age-specific optima. Adams et al. (1991) provide an approach based on fitting logit models for perinatal mortality with linear and quadratic birth weight terms to 4 gestational age intervals. Both Adams et al. (1991) and Wilcox and Russell (1986) find that birth weight optimums for perinatal mortality are closer to the mean (or median) birth weight for blacks.
We have taken steps that expand on the work by Adams et al. (1991). Appendix A of this paper applies a modeling approach to determine the survival optimum for each racial and ethnic group we consider. However, in the present context we consider females only and do not limit the focus to perinatal mortality. We find that the survival optima for whites and blacks in the 37-42 week gestational age race are very close to one standard deviation above the respective gestational age-specific means, whereas for Mexican Americans, the survival optimum is located about 2/3rds of a standard deviation above the mean. It seems unlikely that these differences are large enough to change the central findings presented here with respect to patterns of age variation in birth outcome effects (and their differences) for whites and blacks. Further examination of these effects for Mexican Americans is needed.
Another limitation related to the use of a gestational age birth weight standard is the assumption that the gestational age-specific birth weight optimum is constant over the first year. The empirical evidence presented in Appendix A suggests that the optima are further from the mean for preterm births and closer to the mean for later term births. This however, does not address the possibility that the optimum shifts from one piece of the proportional hazards model to another. For example, high mortality for macrosomic infants in the neonatal period may select out heavier infants so that the postneonatal optimum birth weight optimum is shifted toward smaller birth weights.
standardization we use leads to findings that are consistent with the general conclusions reached using cutpoint methods, but provide greater detail on birth outcome dynamics in the first year of life, there is much to recommend this approach. Of greatest interest, however, is in understanding the biological mechanisms that link birth outcomes to mortality, and the role of social environment on these mechanisms. Further insight into these issues will likely come from specialists working with data that can more squarely address the biological and social-environmental foundations of birth outcomes.
5. Acknowledgements
References
Adams, N.M., C.J. Berg, P.H. Rhodes, and B.J. McCarthy. 1991. “Another Look at the Black-White Gap in Gestation-Specific Perinatal Mortality.” International
Journal of Epidemiology, 20: 950-957.
Albrecht, S.L., L.L. Clarke, M.K. Miller, and F.L. Farmer. 1996. “Predictors of Differential Birth Outcomes among Hispanic Subgroups in the United States: The Role of Maternal Risk Characteristics and Medical Care.” Social Science
Quarterly 77: 407-433.
Allen, M.C., G.R. Alexander, M.E. Tompkins, and T.C. Hulsey, 2000 “Race Differences in Temporal Changes in Newborn Viability and Survival by Gestational Age.” Paediatric and Perinatal Epidemiology, 14: 152-158.
Alexander, G.R., M.D. Kogan, and J.H. Himes. 1999a. “1994-1996 U.S. Singleton Birth Weight Percentiles for Age by Race, Hispanic Origin, and Gender.”
Maternal and Child Health Journal 3: 225-232.
Alexander, G.R., M.E. Tompkins, M.C. Allen, and T.C. Hulsey. 1999b “Trends and Racial Differences in Birth Weight and Related Survival.” Maternal and Child
Health Journal 3: 71-79.
Alexander, G R., M.D. Kogan, D. Bader, W. Carlo, M.C. Allen, and J. Mor. 2003 “US Birth Weight/Gestational Age-Specific Neonatal Mortality: 1995-1997 Rates for White, Hispanics, and Blacks.” Pediatrics, 111: 61-66.
Battaglia, F.C., and L.O. Lubchenco. 1967. “A Practical Classification of Newborn Infants by Weight and Gestational Age.” Journal of Pediatrics 71: 159-163.
Becerra, J.E., C.J.R. Hogue, H. Atrash, and N. Pérez. 1991. “Infant mortality among Hispanics: A Portrait of Heterogeneity .” Journal of the American Medical
Association 265:217-221.
Buehler, J.W., J.C. Kleinman, C.J. Hogue, L.T. Strauss, and J.C. Smith. 1987. “Birth Weight-Specific Infant Mortality, United States, 1960-1970.” Public Health
Reports 102: 151-161.
Chung, C.S. 1967. “Birthweight,” Pp. 92, In Morton, N.E, C.S. Chung, and M. P. Mi, Eds., Genetics of Interracial Crosses in Hawaii, Basel: Karger.
Data with Structural Equation Models.” American Journal of Public Health 86: 394-396.
Cramer, J.C. 1987. “Social Factors and Infant Mortality: Identifying High-Risk Groups and Proximate Causes.” Demography 24: 299-322.
David, R. 2001. “Commentary: Birthweights and Bell Curves.” International Journal of
Epidmiology 30: 1241-1243.
Echeverria-Cruz, S. 2004. “U.S. Models of Infant Mortality by Race/Ethnicity: One Size Fits All? Paper Presented at the Annual Meeting of the Population Association of America, Boston, MA.
Eberstein, I.W., C.B. Nam, and R.A. Hummer. 1990. “Infant Mortality by Cause of Death: Main and Interaction Effects.” Demography 27: 413-430.
Frisbie, W.P. 2005. “Infant Mortality.” pp. 251-282 in D.L. Poston, Jr., and M. Micklin (eds.) Handbook of Population. New York: Kluwer/Plenum/Springer.
Frisbie, W.P., D. Forbes, and S.G. Pullum. 1996. “Compromised Birth Outcomes and Infant Mortality among Racial and Ethnic Groups.” Demography 33: 469-481.
Frisbie, W.P., M. Biegler, P.B. de Turk, D. Forbes, and S.G. Pullum. 1997. “Racial and Ethnic Differences in Determinants of Intrauterine Growth Retardation and Other Compromised Birth Outcomes.” American Journal of Public Health 87: 1977-1983.
Frisbie, W.P., D. Forbes, and R.A. Hummer. 1998. “Hispanic Pregnancy Outcomes: Additional Evidence.” Social Science Quarterly 79: 149-169.
Frisbie, W.P., and S.E. Song. 2003. “Hispanic Pregnancy Outcomes: Differentials over Time and Current Risk Factor Effects.” Policy Studies Journal 31: 237-252.
Gage, T.B., M.J. Bauer, N. Heffner, and H. Stratton. 2004. “Pediatric Paradox: Heterogeneity in the Birth Cohort.” Human Biology 76: 327-342.
Gortmaker, S.L., and P.H. Wise. 1997. “The First Injustice: Socioeconomic Disparities, Health Services Technology, and Infant Mortality.” Annual Review of Sociology 23: 147-170.
Guendelman, S., and B. Abrams. 1995. “Dietary Intake among Mexican-American Women: Generational Differences and a Comparison with White Non-Hispanic Women” American Journal of Public Health 85: 20-25.
Hack, M., N.K. Klein, and H.G. Taylor. 1995. “Long-Term Developmental Outcomes of Low Birth Weight Infants” The Future of Children 5: 176-196.)
Hertz-Picciotto, I. 2001. “Commentary: When Brilliant Insights Lead Astray.”
International Journal of Epidemiology 30: 1243-1244.
Hertz-Picciotto, I, and R. Din-Dzietham. 1998. “Comparisons of Infant Mortality Using a Percentile-Based Method of Standardization for Birthweight or Gestational
Age. Epidemiology1:67-68.
Hoyert, D.L., E. Arias, B.L. Smith, S.L. Murphy, and K.D. Kochanek. 2001. “Deaths: Final Data for 1999.” National Vital Statistics Reports 49, No. 8. Hyattsville, MD: National Center for Health Statistics.
Hummer, R.A. 1993. “Racial Differentials in Infant Mortality in the U.S.: An Examination of Social and Health Determinants.” Social Forces 72: 529-554.
Hummer, R.A. 1996. “Black-White Differences in Health and Mortality.” The
Sociological Quarterly 37: 105-125.
Hummer, R.A., C.P. Schmertmann, I.W. Eberstein, and S. Kelly. 1995. “Retrospective Reports of Pregnancy Wantedness and Birth Outcomes in the United States.”
Social Science Quarterly 76: 402-418.
Hummer, R.A., M. Biegler, P.B. de Turk, D. Forbes, W.P. Frisbie, Y. Hong, and S.G. Pullum. 1999. “Race/Ethnicity, Nativity, and Infant Mortality in the United States.” Social Forces 77: 1083-1118.
Kallan, J.E. 1993. “Race, Intervening Variables, and Two Components of Low Birth Weight.” Demography 30: 489-506.
Kiely, J., and M. Susser. 1992. “Preterm Birth, Intrauterine Growth Retardation, and Perinatal Mortality.” American Journal of Public Health 82: 343-345.
Kline, J., Z. Stein, and M. Susser. 1989. Conception to Birth: Epidemiology of Prenatal
Development. New York: Oxford.
Kramer, M.S., F.H. McLean, M.E. Boyd, and R.H. Usher. 1988. “The Validity of Gestational Age Estimation by Menstrual Dating in Term, Preterm, and Postterm Gestations.” Journal of the American Medical Association 260: 3306-3308.
Laird, N., and D. Olivier. 1981. “Covariance Analysis of Censored Survival Data Using Log-linear Analysis Techniques” Journal of the American Statistical Association 76: 231-240.
Mathews, T.J., F. Menacker, and M.F. MacDorman. 2002. “Infant Mortality Statistics from the 2000 Period Linked Birth/Infant Death Data Set.” National Vital
Statistics Reports 50(12). Hyattsville, MD: National Center for Health Statistics.
McCormick, M.C. 1985. “The Contribution of Low Birth Weight to Infant Mortality and Childhood Mortality.” New England Journal of Medicine 312: 82-90.
Minono, A.M., E. Arias, K.D. Kochanek, S.L. Murphy, and B.L. Smith. 2002. “Deaths: Final Report Data for 2000.” National Vital Statistics Reports 50(15). Hyattsville, MD: National Center for Health Statistics.
Myers, S.A., and R. Ferguson. 1989. “A Population Study of the Relationship between Fetal Death and Altered Fetal Growth.” Obstetrics and Gynecology 74: 325-331.
National Center for Health Statistics. 1996. Health, United States, 1995. Hyattsville, MD: Public Health Service.
Palloni, A., and J.D. Morenoff. 2001. “Interpreting the Paradoxical in the Hispanic Paradox.” Annals of the New York Academy of Sciences 954: 140-174.
Platt, R.W., C.V. Ananth, and M.S. Kramer. (2004a) “Analysis of Neonatal Mortality: Is Standardizing for Relative Birth Weight Biased?” BMC Pregnancy and
Childbirth. 4: 9.
Platt, R.W., K.S. Joseph, C.C. Ananth, J. Gondines, M. Abramowicz, and M. S. Kramer. (2004b). “A Proportional Hazards Model with Time-Dependent Covariates and Time-Varying Effects for Analysis of Fetal and Infant Death.”
American Journal of Epidemiology, 160: 199-206.
Preston, S.H., P. Heuveline, and M. Guillot. 2001. Demography: Measuring and Modeling Population Processes. Oxford, UK: Blackwell Publishers.
Rumbaut, R., and J.R. Weeks. 1991. “Perinatal Risks and Outcomes among Low Income Immigrant.” Final Report for the Maternal and Child Health Research
Program. Rockville: DHHS.
Rumbaut, R.G., and J.R. Weeks. 1996. “Unraveling a Public Health Enigma: Why Do Immigrants Experience Superior Perinatal Health Outcomes?” Research in the
Scribner, R. 1996. “Editorial: Paradox as Paradigm - The Health Outcomes of Mexican Americans.” American Journal of Public Health 86: 303-305.
Scribner, R., and J.H. Dwyer. 1989. “Acculturation and Low Birth Weight among Latinos in the Hispanic HANES” American Journal of Public Health 79: 1263-1267.
Solis, P., S.G. Pullum, and W.P. Frisbie. 2000. “Demographic Models of Birth Outcomes and Infant Morality: An Alternative Measurement Approach.”
Demography 37: 489-498.
U.S. Department of Health and Human Services. 1995. “Linked Birth/Infant Death Data Set: 1989 Cohort.” Public Use Data File Documentation. Hyattsville: National Center for Health Statistics.
Wilcox, A.J. 2001a. “On the Importance – and the Unimportance – of Birthweight.”
International Journal of Epidemiology 30: 1233-1241.
Wilcox, A.J. 2001b. “Response: Where Do We Go from Here.” International Journal
of Epidemiology 30:1245.
Wilcox, A.J. 2003. “Commentary: On the Paradoxes of Birthweight.” International
Journal of Epidemiology 32: 632-633.
Wilcox, A.J., and I.T. Russell. 1983. “Birthweight and Perinatal Mortality: II. On Weight-Specific Mortality.” International Journal of Epidemiology 12: 319-325.
Wilcox, A.J., and I.T. Russell. 1986. “Birthweight and Perinatal Mortality: III. Towards a New Method of Analysis.” International Journal of Epidemiology 15: 188-196.
Wilcox, A.J., and I.T. Russell. 1990. “Why Small Black Infants Have a Lower Mortality Rate than Small White Infants: The Case for Population-Specific Standards for Birth Weight.” Journal of Pediatrics 116: 7-10.
Wilcox, A.J., and R. Skjœrven. 1992. “Birth Weight and Perinatal Mortality: The Effect of Gestational Age.” American Journal of Public Health 82: 378 382
Wilcox, A.J., and C. R. Weinberg. 2004. “Invited Commentary: Analysis of Gestational-Age-Specific Mortality –– On What Biologic Foundations?”
American Journal of Epidemiology 160:213-214.
Wise, P.H. 2003. “The Anatomy of a Disparity in Infant Mortality.” Annual Review of
Wise, P.H., and D. Pursely. 1992. “Infant Mortality as a Social Mirror.” New England
Journal of Medicine 326: 1558-1560.
Appendix A
Race/Ethnic specific birth weight optima
In this section we describe a simple method to estimate race/ethnic specific gestational age-specific survival optimal birth weight from individual-level data. Solis et al. (2000) determined the survival optimum for white females in the 1991-1995 linked files by first standardizing the birth weight distribution around the mean birth weight in the 39-41 week gestational age range. This aggregation of data yielded sufficient observations to compute the empirical IMRs for different z-score standardized birth weights. They then examined log IMR over a grouping of z-values. The survival optimum (i.e., the birth weight yielding the lowest log IMR) was found to be between 1.00-1.99 standard deviations above the mean birth weight for gestational ages in this range. Thus, the value of 1 standard deviation above the gestational age specific mean birth weight was chosen a lower bound on the survival optimum. This value was then applied to construct the birth weight risk measures S and H for all infants over the 22-47 week gestational age range.
Our method follows a similar logic, but is based on fitting a statistical model for mortality (on the individual-level data) as a function of gestational age-standardized birth weight. We first construct a standard score, Z, representing an infant's departure from her gestational age-specific mean birth weight in standard deviation units. We then determine the survival optimal birth weight for gestational ages in the 37-42 week range (i.e., for between 80% to 88% of births, depending on race/ethnicity), and for gestations <37 weeks and >42 weeks.
Methods to determine race-specific optima must account for the inverted J-shaped relationship between gestational-age standardized birth weight and mortality. To account for this nonlinearity, we estimate logit models with polynomial terms in Z. Similar approaches to determining race specific optima for perinatal mortality have been used by Adams et al. (1991). This simple parametric strategy has the advantage of producing point estimates and standard errors that may be useful in future work to compute upper and lower bounds on survival optima. The results presented below are
based on fitting 5th-degree polynomials. Letting pi denote the probability of mortality
for the ith infant, the log odds of mortality can be expressed as a Kth-degree polynomial in Z as
0 1
logit( ) K k
i i k i
k
p Z
η β β
=
The estimated survival optimum is a point on the Z scale that is the solution to
( 1)
1 ˆ
ˆ 0
K k
k k
kZ Z
η β −
∂
=∑ =
=
∂ (A2)
This optimum is located empirically by finding the z-value in the data, Z , which
falls at the minimum predicted logit within a suitable range of z-values (i.e., -4, 4), or
ˆ ˆ
[ min( )]
Z=Zη= η as shown in Figure A1. These optima compare favorably to the
empirical optima determined using the procedures of Solis et al. (2000), in which log IMR is plotted for standardized birth weight values in a specific gestational age range. The empirical IMRs (shown as points) are based on aggregating the data over 250g intervals of birth weight in the 37-42 week range.
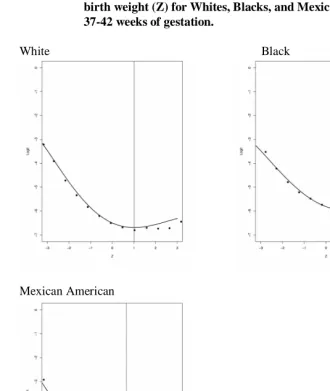
Figure A1 shows the observed and fitted logits by Z from polynomial models fit to white, black, and Mexican-American mortality for births occurring between 37 and 42 weeks gestation. It is clear that the optimum of one standard deviation above the gestational age-specific mean birth weight slightly overestimates the survival optimum for Mexican Americans, but appears to be a reasonable assumption for blacks and whites in the 37-42 week gestational age range. As might be expected, for gestations less than 37 weeks, the optima are further from the mean at 1.99sd, 1.76sd, and 1.79sd above gestational age-specific mean for whites, blacks, and Mexican Americans, respectively. For gestations greater than 42 weeks, the optima are somewhat closer to the mean: whites (0.93sd), blacks (1.03sd), and Mexican Americans (0.40sd). These results differ from those of Adams et al. (1991) who find that the optimum birth weight for blacks is closer to the mean that it is for whites. However, they focus on perinatal mortality and include males in the analysis. Table A1 provides more information on the particular standardization that would apply to each gestational age by race category for our sample. We present the mean, standard deviation, percentage of births occurring in the 22-47 week gestational age range for whites, blacks, and Mexican Americans, respectively.
Further results on age-varying effects
In this section we discuss in more detail the results from a set of simpler models using both age-invariant and age-varying effects of birth weight (small and heavy) and gestational age (early and late), in addition to an age-invariant interaction effect of
Figure A1: Observed and fitted logits by gestational age standardized birth weight (Z) for Whites, Blacks, and Mexican Americans: 37-42 weeks of gestation.
White Black
Mexican American
Whites: The lowest mortality is 1.01 standard deviations above the gestational age-specific mean birth weight. Blacks: The lowest mortality is at a point 1.05 standard deviations above the gestational age specific mean birth weight.