Mechanism of Improvement of Formability in Pulsating
Hydroforming of T-shape Tubes
M. Loh-Mousavii*; M. Bakhshi-Jooybariii and K. Moriiii
Received 5 March 2007; received in revised 9 October 2007; accepted 15 July 2008
i * Corresponding Author, M. Loh-Mousavi is with the Department of Mechanical Engineering, Islamic Azad University Khomeinishahr Branch, Iran (e-mail: [email protected])
ii M. Bakhshi-Jooybari is with the Department of Mechanical Engineering, Noshirvani Institute of Technology, Mazandaran University, Babol, P.O.Box 484, Iran (e-mail: [email protected])
iii K. Mori is with the Department of Production Systems Engineering, Toyohashi University of Technology, Tempaku-cho Hibarigaoka 1-1, Toyohashi, 441-8580, Japan (e-mail: [email protected])
ABSTRACT
In this paper, the mechanism of improvement of formability in pulsating hydroforming of T-shape tubes is investigated by the finite element simulation and experiment. It is shown that local thinning was prevented by oscillating the internal pressure, because the protrusion is formed gradually by the prevention of sharp bulging. In the hydroforming, for the pulsating pressure, several steps occur in variations in wall thickness, and thus, the thickness of the tube increases; whereas, for the peak pressure, the thickness is reduced continuously. Moreover, the effects of the amplitude and the number of cycles of pressure per unit punch, the stroke on formability and the corner filling are examined. It is shown that the small number of cycles of pressure and large amplitudes improve the formability; whereas, a large number of cycles of pressure and small amplitudes increase the die corner filling and shape accuracy as well.
KEYWORDS:
Tube hydroforming, Pulsating hydroforming, T-shape tubes, FE simulation, Tube formability
1. INTRODUCTION
In tube hydroforming process, the tube is bulged by internal pressure to be formed into a desired hollow part. In this process, bursting is caused by local thinning due to bulging caused by high pressure. To prevent local thinning, the tube is simultaneously compressed in the axial direction to feed more material into the die cavities. The excessive feeding under low internal pressure brings about wrinkling. In addition, the corner filling of the die cavities deteriorates due to low pressure. In general, the determination of internal pressure path is a key factor in improving the formability and shape accuracy in a tube hydroforming process [1]. The finite element simulation is effective in determining the pressure path by trial and error [2].
To improve the formability in the tube hydroforming, a pulsating hydroforming process has been developed [3]. In this process, the internal pressure required to bulge the tube is oscillated during the forming. The authors have simulated the axi-symmetric pulsating hydroforming of tubes by the rigid-plastic finite element method to examine the mechanism of improvement of formability in
free bulging [4, 5].
Hama et al. [6] have exhibited the effectiveness of the oscillation of internal pressure on the formability for an automotive part by the static explicit finite element method.
The authors have studied effects of oscillation of internal pressure on the formability and shape accuracy of the products in the pulsating hydroforming process of T-shape parts by a dynamic explicit finite element code [7]. The authors have also proposed a new method to improve the die corner filling in a box-shaped tube hydroforming by control of wrinkling [8]. Suetake et al. [9] have improved the shape accuracy of a bulged protrusion in T-shape tube hydroforming by optimizing the loading path by means of fuzzy control. Kridli et al. [10] have examined the effects of wall thickness of tubes and die corner radius on the filling of the die corner in the hydroforming process under non-pulsating pressure path by the finite element method.
for improving the formability than the change in friction [11]. Hama et al. [6] have claimed that the same effect as lowering the friction coefficient could be achieved by the pulsating pressure; whereas Mori et al. [5] showed that the pulsating pressure path influences the deformation behavior during the hydroforming, and that this pressure path may not influence the coefficient of friction.
In this paper, the pulsating T-shape tube hydroforming process with single side feeding is studied by the three-dimensional finite element method and experiment to investigate the mechanism of improvement of formability in closed-die pulsating hydroforming of tubes. In addition, the effect of amplitude and frequency of oscillating pressure on the formability and die corner filling are examined by the finite element method. The results obtained for the pulsating pressure path are compared with those for the non-pulsating pressure paths. Moreover, the results of the finite element simulation are compared with those obtained from experiment.
2. HYDROFORMING PROCEDURE
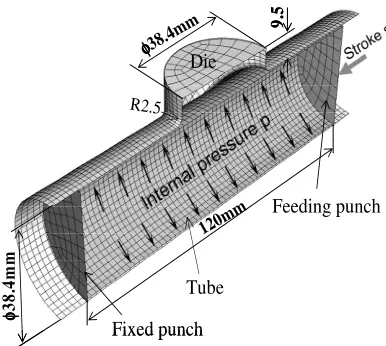
The closed-die pulsating T-shape tube hydroforming process of mild steel tubes is simulated by the commercial finite element software, ABAQUS/EXPLICIT. The tube and tools used in the simulation are shown in Fig. 1. Only half of the tube is divided into 3-D shell elements due to symmetrical deformation, and the tools are modeled to be rigid.
The tube is compressed from one end and the other end is fixed. The penalty contact approach was employed as a treatment of the contact between the tube and die.
Three pressure paths shown in Fig. 2 were set to examine the effect of oscillation of pressure on the formability and shape accuracy. The internal pressure path for the pulsating hydroforming shown in Fig. 2 is expressed by:
p=∆psin2πω(s-1) + p0 [MPa] (1)
where, ∆p is amplitude of the pressure cycle, ω is the number of pressure cycles per unit punch stroke (frequency), and s is the stroke of the upper punch. The pulsating pressure was oscillated from the base pressure, p0=25MPa, and the oscillation was started from s= 1 mm.
The peak pressure represents the maximum of the pulsating pressure. The pressures are constant up to s=12 mm, and then are linearly increased to improve the filling of the die corners. The tube was compressed under a constant velocity of the feeding punch of 0.75 mm/s.
120mm
φφφφ
3
8
.4
m
m
φφφφ38.4m
m 9.5
Tube Die
Fixed punch
Feeding punch
R2.5
120mm
φφφφ
3
8
.4
m
m
φφφφ38.4m
m 9.59.5
Tube Die
Fixed punch
Feeding punch
R2.5
Figure 1: Finite element model used for simulation
5 10 15
20 40 60
0
Stroke, s [mm]
P
re
ss
u
re
p
[
M
P
a] PulsatingPeak
1
Mean
5 10 15
20 40 60
0
Stroke, s [mm]
P
re
ss
u
re
p
[
M
P
a] PulsatingPeak
1
Mean
Figure 2: Three pressure paths used in simulation and experiment
Fixed punch
9
.5
120 160
Feeding punch
φ38.4
Pressure
Tube R2.5 Die
φ
3
8
.4
Fixed punch
9
.5
120 160
Feeding punch
φ38.4
Pressure
Tube R2.5 Die
Die
φ
3
8
.4
TABLE 1 CONDITIONS USED IN FINITE ELEMENT SIMULATION.
Young’s Modulus 210 GPa
Poisson’s ratio 0.3
Yield stress 290 MPa
Flow stress σ=510ε0.12MPa
r-Value 1.6
Coefficient of friction 0.1
Mass-scaling 10 times
Outer diameter of tube 38.4 mm
Thickness of tube 1.1 mm
Punch speed 0.75 mm/s
The conditions of the hydroforming process used in the simulation are given in Table 1. The flow stress and r-value of the mild steel tube were measured by the tensile test. The Hill’s anisotropic plasticity model was assumed in the simulation. To reduce the computational time, the mass scaling of 10 times was employed
To verify the accuracy of the results obtained from simulation, a T-shape tube hydroforming experiment was carried out (see Fig. 3). A hydraulic machine with computer control was employed to generate the pressure paths shown in Fig. 2. A water-oil emulsion was used as a pressure media and machine oil was used as a lubricant in the experiment. To avoid the occurrence of bulging from the welding line of the tube, the welding line was located in the bottom side of the die.
3. DEFORMATION BEHAVIOR AND MECHANISM OF
IMPROVEMENT OF FORMABILITY
The deformed element mesh during the pulsating T-shape tube hydroforming for ∆p=7MPa and ω=1.33c/mm is illustrated in Fig. 4. As the punch stroke increases, the protrusion becomes larger.
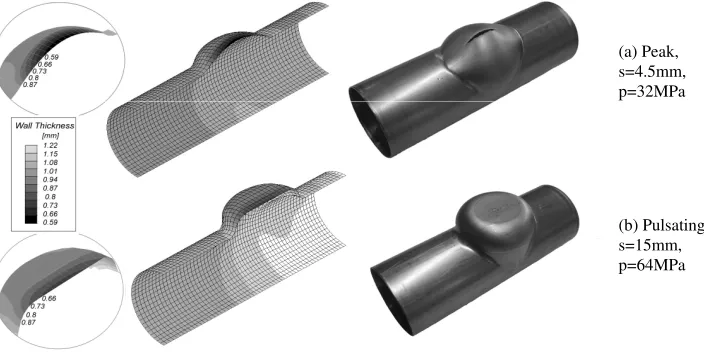
The deformed tubes obtained from the simulation and experiment for the pulsating and peak pressures are shown in Fig. 5. For the peak pressure, bursting occurs around the center of the protrusion in the early stroke of s=4.5 mm; whereas, local thinning does not appear for the
pulsating pressure, even in the final stroke of s=15 mm. The variations in the wall thickness at the center of the protrusion with the stroke for the peak and pulsating pressures obtained from simulation are compared with the experimental ones in Fig. 6. For the peak pressure, the thickness quickly decreases up to bursting; whereas, the wall thickness gradually decreases for the pulsating pressure. It can also be seen from Fig. 6 that, the simulated wall thickness is in good agreement with the experimental one.
The thinning mechanism of the tube in a cycle of pulsating pressure is shown in Fig. 7. For both the peak and pulsating pressures, in the first quarter of the cycle, the pressure increases (A-B), and thus, the thickness of the tube decreases (a-b); whereas, during the two later quarters (B-C), the thickness does not decrease (b-c) due to drop of internal pressure and the continuous compression in the axial direction. In the last quarter (C-D), the thickness of the tube does not decrease (c-d) because the amount of pressure is still less than the previous pressures, while the tube has been compressed in the axial direction during the oscillation of internal pressure.
It can be observed from Figs. 6 and 7 that, because of the above thinning mechanism, several steps occur in the variations in wall thickness for the pulsating pressure, and thus, the thickness of the tube increases; whereas, for the peak pressure, the thickness is reduced continuously.
The local thinning is greatly influenced by the deformation behavior during the hydroforming. The cross-sectional shapes of the protrusion during the hydroforming for the peak and pulsating pressures obtained from experiment and simulation are shown in Fig. 8. As observed from the figure, the simulation results agree well with the experimental ones.
0 5 10 15 Stroke, s [mm]
T
h
ic
k
n
es
s
at
c
en
te
r
o
f
tu
b
e
[m
m
]
0.5 0.7 0.9 1.1
Peak Pulsating FEM Exp.
Bursting 0.63
0 5 10 15
Stroke, s [mm]
T
h
ic
k
n
es
s
at
c
en
te
r
o
f
tu
b
e
[m
m
]
0.5 0.7 0.9 1.1
Peak Pulsating FEM Exp.
Bursting 0.63
Figure 6: Variations in wall thickness at the center of protrusion
with the stroke obtained from simulation and experiment. 0.6
0.8 1
0 25 50
One cycle
B a
b
A
C D
c d
T
h
ic
k
n
es
s
at
c
en
te
r
o
f
p
ro
tr
u
si
o
n
[
m
m
]
P
re
ss
u
re
p
[
M
P
a]
Stroke [mm]
Peak Pulsating
0.6 0.8 1
0 25 50
One cycle
B a
b
A
C D
c d
T
h
ic
k
n
es
s
at
c
en
te
r
o
f
p
ro
tr
u
si
o
n
[
m
m
]
P
re
ss
u
re
p
[
M
P
a]
Stroke [mm]
Peak Pulsating
Figure 7: Thinning mechanism of tube in one cycle of pulsating pressure for peak and pulsating pressures.
(b) Pulsating, s=15mm, p=64MPa (a) Peak, s=4.5mm, p=32MPa
Figure 5: Improvement of formability by pulsating pressure. (a) s=5mm (b) s=10mm (c) s=15mm Figure 5: Deformed element mesh during pulsating T-shape tube hydroforming, s=punch stroke.
4. Effects of Amplitude and Frequency on Formability
The effect of the number of cycles (frequency) on the variations of the wall thickness at the center of the protrusion for ∆p=7MPa in the pulsating hydroforming, obtained from simulation is shown in Fig. 9. It can be observed that as the frequency increases, the thickness decreases, and thus, bursting occurs for ω=2 c/mm at the stroke of s=10mm. In other expression, when the frequency increases, the variation in the wall thickness becomes closer to that for the peak constant pressure.
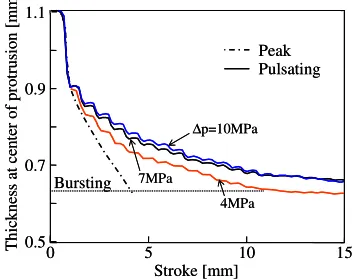
The effect of the pressure amplitude (∆p) on the variations in wall thickness at the center of the protrusion for ω=1.33c/mm, obtained from simulation is illustrated in Fig. 10. It can be observed that as the amplitude increases the thickness increases. The effect of the amplitude on the wall thickness for amplitudes of 7 and
10 MPa is almost similar. This is mainly due to the following reason. The pressure necessary to start yielding of the tube was determined (Py = 17.5MPa) based on a
simple axisymmetric expansion of a tube with fixed end, see (2):
Py=2σyt0/(D0-t0) (2)
Where σy is the yield strength of the tube material, and t0
and D0 are the initial thickness and the outside diameter of
the tube, respectively. The base pressure (average pressure) is p0=25MPa for all the cases, and thus, the
minimum pressure for the pulsating pressure path with the amplitude ∆p=7 MPa, is Pm=18MPa, which is very close
to the yielding pressure of the tube. Thus, the larger amplitude cannot influence the thickness of the tube, because all the pressures which are lower than the yielding pressure have the same effect on plastic deformation. However, for the small amplitude, the thickness variation becomes close to that for the peak constant pressure (see Fig. 10).
0 5 10 15
Stroke [mm] T h ic k n es s at c en te r o f p ro tr u si o n [ m m ] Peak 0.5 0.7 0.9 1.1 ω=0.33c/mm Pulsating 0.67c/mm 1.33c/mm 2c/mm Bursting
0 5 10 15
Stroke [mm] T h ic k n es s at c en te r o f p ro tr u si o n [ m m ] Peak 0.5 0.7 0.9 1.1 ω=0.33c/mm Pulsating 0.67c/mm 1.33c/mm 2c/mm Bursting
Figure 9: Effects of pressure frequency on the wall thickness of tube center, obtained from simulation.
0 5 10 15
Stroke [mm] T h ic k n es s at c en te r o f p ro tr u si o n [ m m ] 0.5 0.7 0.9 1.1 ∆p=10MPa Peak Pulsating 7MPa 4MPa Bursting
0 5 10 15
Stroke [mm] T h ic k n es s at c en te r o f p ro tr u si o n [ m m ] 0.5 0.7 0.9 1.1 ∆p=10MPa Peak Pulsating 7MPa 4MPa Bursting
Figure 10: Effects of pressure amplitude on the wall thickness of tube center, obtained from simulation, ω=1.33c/mm.
As it is shown in Fig. 6, the tube wall thickness in the bursting region (see Fig. 5-a) was measured experimentally which is about 0.63 mm. This value is
s
=4mm2mm Die
50 60 70 80 90 100
20 25 30
Distance from tube end [mm]
D is ta n ce f ro m t u b e ce n te r [m m ] FEM Exp.
s
=4mm 2mm Die50 60 70 80 90 100
20 25 30
Distance from tube end [mm]
D is ta n ce f ro m t u b e ce n te r [m m ] FEM Exp.
s
=15mm 8mm 4mm 2mm Die50 60 70 80 90 100
20 25 30
Distance from tube end [mm]
D is ta n ce f ro m t u b e ce n te r [m m ] FEM Exp.
s
=15mm 8mm 4mm 2mm Die50 60 70 80 90 100
20 25 30
Distance from tube end [mm]
D is ta n ce f ro m t u b e ce n te r [m m ] FEM Exp.
(a) Peak (b) Pulsating
5. Effects of Amplitude and Frequency on the Corner Filling
The filling ratios of the die cavity with the tube for the three pressure paths obtained from the simulation are compared with those from the experiment in Fig. 11. The filling ratio is defined by (A0-A)/A0, where A0 is the total
area of the die cavity, and A is the unfilled die cross sectional area. As the punch stroke increases, the filling ratio increases. The filling ratio for the pulsating pressure is greater than that for the mean pressure.
The protrusions of the formed tubes obtained from the experiment for the three pressure paths are shown in Fig. 12. The contact regions on the top surfaces of the protrusions for the pulsating and mean pressures are approximately elliptical, and the region for the pulsating pressure is rounder than that for the mean pressure.
The effect of the number of pressure cycles (frequency) on the die filling ratio for ∆p=7MPa in the pulsating T-shape tube hydroforming is shown in Fig. 13. It can be seen that as the frequency increases, the filling ratio of the die cavity increases. However, for ω=2c/mm, due to local necking at s=10mm, bursting occurs, as it was shown in Fig. 9 and the filling of the die cavity stopped. For ω=0.33c/mm, the filling ratio becomes closer to that for the mean constant pressure.
The effect of the pressure amplitude (∆p) on the filling ratio for ω=1.33c/mm is illustrated in Fig. 14. The filling ratio increases, as the amplitude decreases; whereas, for
∆p=4MPa, the filling ratio of the die cavity stopped due to bursting which occurred at the stroke of 11mm.
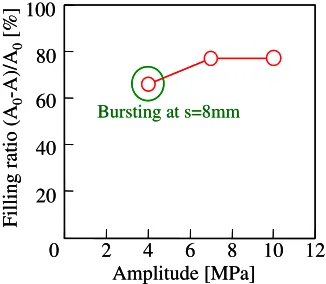
Figs. 15 and 16 show the experimental results for the effect of pressure amplitude and the number of cycles per unit punch stroke on the final value of the die filling ratio. The experimental results agree well with those obtained from the finite element simulation.
0 5 10 15
20 40 60 80 100
Stroke s [mm]
F il li n g r at io ( A0 -A )/ A0 [% ] Peak Pulsating Mean FEM Exp.
0 5 10 15
20 40 60 80 100
Stroke s [mm]
F il li n g r at io ( A0 -A )/ A0 [% ] Peak Pulsating Mean FEM Exp.
Figure 11: Effects of pressure oscillation on filling
20.2mm 2 3 .7 m m 22.4mm 2 5 .6 m m 20.2mm 2 3 .7 m m 20.2mm 2 3 .7 m m 22.4mm 2 5 .6 m m 22.4mm 2 5 .6 m m
(a) Peak, s=4.5mm (b) Pulsating, s=15mm (c) Mean, s=15mm
Figure 12: Protrusions of the formed tubes for the three pressure paths, obtained from experiment.
0 5 10 15
20 40 60 80 100
Stroke s [mm]
D ie f il li n g r at io ( A0 -A )/ A0 % Peak Pulsating Mean ω=0.33c/mm 0.67c/mm 1.33c/mm 2c/mm B u rs ti n g B u rs ti n g
0 5 10 15
20 40 60 80 100
Stroke s [mm]
D ie f il li n g r at io ( A0 -A )/ A0 % Peak Pulsating Mean ω=0.33c/mm 0.67c/mm 1.33c/mm 2c/mm B u rs ti n g B u rs ti n g
Figure 13: Effect of frequency on calculated die filling ratio for ∆p=7MPa in pulsating hydroforming, obtained from simulation.
0 5 10 15
20 40 60 80 100
Stroke s [mm]
D ie f il li n g r at io ( A 0 -A )/ A 0 % Peak Pulsating Mean B u rs ti n g B u rs ti n g 7MPa 10MPa ∆p=4MPa
0 5 10 15
20 40 60 80 100
Stroke s [mm]
D ie f il li n g r at io ( A 0 -A )/ A 0 % Peak Pulsating Mean B u rs ti n g B u rs ti n g 7MPa 10MPa ∆p=4MPa
Figure 14: Effect of pressure amplitude on the die filling ratio for ω=1.33c/mm, obtained from simulation.
F il li n g r at io ( A0 -A )/ A0 [% ] 20 40 60 80 100
Bursting at s=9.8mm
F il li n g r at io ( A0 -A )/ A0 [% ] 20 40 60 80 100
2 4 6 8 10 12 20
40 60 80 100
0
Bursting at s=8mm
F
il
li
n
g
r
at
io
(
A0
-A
)/
A0
[%
]
Amplitude [MPa]
2 4 6 8 10 12
20 40 60 80 100
0
Bursting at s=8mm
F
il
li
n
g
r
at
io
(
A0
-A
)/
A0
[%
]
Amplitude [MPa]
Figure 16: Effect of amplitude on the final die filling ratio for ω =1.33c/mm, obtained from experiment.
6. Conclusions
The mechanism of improvement of formability in pulsating hydroforming of T-shape tubes was examined
by both the finite element simulation and experiment. In tube hydroforming, for the pulsating pressure, several steps occur in the variations in wall thickness, and thus, the thickness of the tube increases; whereas, for the peak pressure, the thickness is reduced continuously. The reason is that, during the two middle quarters of each cycle of pulsating pressure, the thickness does not decrease due to drop of internal pressure and the continuous compression in the axial direction, and thus, the formability is improved. In addition, the effects of pressure amplitude and frequency were investigated by the finite element method. It was found that as the frequency of the oscillating pressure decreases, the formability is improved and the filling ratio decreases; whereas, a small amplitude is not effective in improving the formability, and a large amplitude decreases the filling ratio.
7. REFERENCES
[1] S. J. Kang, H. K. Kim, B. S. Kang, "Tube size effect on hydroforming formability", J. Mater. Process. Technol., Vol. 160, pp. 24-33, 2005.
[2] M. Strano, S. Jirathearanat, S. G. Shr, T. Altan, "Virtual process development in tube hydroforming", J. Mater. Process. Technol., Vol. 146, pp. 130-136, 2004.
[3] http://www.opton.co.jp
[4] Mori, K., Patwari, A.U., Maki, S., "Improvment of formability by oscillation of internal pressure in pulsating hydroforming of tubes", Ann. CIRP, Vol. 53, No. 1, pp. 215-218, 2004.
[5] K. Mori, T. Maeno, S. Maki, "Mechanism of improvement of formability in pulsating hydroforming of tube", Int. J. of Mach. Tools and Manu. 47, pp. 978-984, 2007.
[6] T. Hama, M. Asakawa, H. Fukiharu, A. Makinouchi, M., "Finite Element Simulation of Hammering Hydroforming of an Automotive Component", in Proc. TUBEHYDRO2003, Aichi, Japan, pp. 80-83.
[7] M. Loh-Mousavi, K. Mori, K. Hayashi, S. Maki, M. Bakhshi, "3-D finite element simulation of pulsating T-shape hydroforming of tubes", Key Engineering Materials, vol. 340, pp. 353-358, 2007. [8] M. Loh-Mousavi, K. Mori, K. Hayashi and M. Bakhshi,
"Improvement of filling of die corners in box-shaped tube hydroforming by control of wrinkling", Key Engineering Materials, vol. 344, pp. 461-467, 2007.
[9] M. Suetake, K. Manabe, S. Miyamoto, H. Koyama, T. Yagami, M. Yang, "Development of tube hydroforming with intelligent process control system", in Proc. TUBEHYDRO 2003, Aichi, Japan, pp. 7-14.
[10] G.T. Kridli, L. Bao, P. K. Mallick, Y. Tian, "Investigation of thickness variation and corner filling in tube hydroforming", J. Mater. Process. Technol., Vol. 133, pp. 287-296, 2003.