Experimental Study & Modeling of Surface Roughness
in Turning of Hardened AISI 4340 Steel Using
Coated Carbide Inserted
S. R. Das1*, D. Dhupal2, A. Kumar3
1
Research Scholar,3 Associate. Professor, Dept. of Production & Industrial Eng., NIT, Jamshedpur-831014, Jharkhand, India.2Professor, Department of Manufacturing Science & Engineering, VSSUT, Burla-768018, Odisha, India. *[email protected]
Abstract
Turning of hardened steels using a single point cutting tool has replaced the cylindrical grinding now as it offers attractive benefits in terms of lower equipment costs, shorter set up time, fewer process setups, higher material removal rate, better surface quality and elimination of cutting fluids compared to cylindrical grinding. In order to obtain desired surface quality by machining, proper machining parameters selection is essential. This can be achieved by improving quality and productivity in metal cutting industries. The present study is to investigate the effect of machining parameters such as cutting speed, feed and depth of cut on surface roughness during dry turning of hardened AISI 4340 steel with CVD (TiN+TiCN+Al2O3+ZrCN) multilayer coated carbide inserts. A full factorial design of experiment is selected for experimental planning and the analysis of variance (ANOVA) has been employed to analyze the significant machining parameters on surface roughness during turning. The results showed that feed (60.85%) is the most influencing parameter followed by cutting speed (24.6%) at 95% confidence level. And the two-level interactions of feed-cutting speed (F*V), depth of feed (D*F) and depth of cut-cutting speed (D*V) are found the significant effects on surface roughness in this turning process. Moreover, the relationship between the machining parameters and performance measure i.e. surface roughness has been modeled using multiple regression analysis.
Keywords: AISI 4340 steel, Surface roughness, Factorial design, ANOVA..
1. Introduction
The achievement of high quality, in terms of work piece dimensional accuracy, surface finish, high production rate, less wear on the cutting tools, economy of machining in terms of cost saving and increase the performance of the product with reduced environmental impact are the main and effective challenges of modern metal cutting and machining industries [1]. Traditionally, hardened steels are machined by grinding process due to their high strength and wear resistance properties but grinding operations are time consuming and limited to the range of geometries to be produced. In recent years, machining the hardened steel in turning which uses a single point cutting tool has replaced grinding to some extent for such application. This leads to reduced the number of setup changes, product cost
and ideal time without compromising on surface quality to maintain the competiveness [2,3]. The improve technological process, proper tool selection, determination of optimum machining parameters (cutting speed, feed, depth of cut, etc.) or tool geometry (nose radius, rake angle, edge geometry, etc.) are necessary in order to obtain the desired surface finish comparable to grinding [4,5,6].
In order to decide the surface quality the statically design of experiment is used extensively. Design of experiment refers to the process of planning the experiments so that appropriate data can be analyzed by statistical methods, resulting valid and objective conclusions [7]. Design and methods such as factorial design, Taguchi design and response surface methodology (RSM) are now widely used in place of one factor at a time experimental approach which is time consuming and exorbitant in cost. This method has been used by some researchers for surface
285 Experimental Study & Modeling of …………
International Journal of Automotive Engineering Vol. 3, Number 1, March 2013
roughness [8], statistical methods and full factorial design of experiments has been used for mach inability [9] and surface roughness [10]. J.S. Senthikumar et al.[11] conducted the experiments as per full factorial design of experiments under dry cutting condition in machining i.e. finish turning and facing of Income 718, and optimized the machining parameters on surface roughness & flank wear using Taguchi technique. M. Kaladhar et al.[12] determined the best levels of machining parameters such as cutting speed, feed, depth of cut and nose radius to obtain the minimum surface roughness during turning of AISI 202 austenitic stainless steel using full factorial design of experiment.
The paper presents the experimental study; to investigate the performance of ZrCN coated insert and influence of machining parameters under the surface roughness in dry turning of hardened AISI 4340 steel. Full factorial experimental design and analysis of variance (ANOVA) has been employed to determine the best combination of machining parameters such as depth of cut, feed and cutting speed for obtaining the minimum surface roughness value. The regression model between the machining parameters and the performance measure (surface roughness) has been developed by second order multiple regression equation.
2. Design of Experiment (DOE)
Design of experiment is a powerful tool for modelling and analysis of process variables over some specific variable which is an unknown function of the process variables [13]. Design of experiments (DOE);
•Useful in process development and
troubleshooting.
•Indentifies magnitude and direction of important process variables effects.
•Greatly reduces the number of runs required to perform an experiment.
•Indentifies interaction among process variables. •Useful in engineering design and development.
•Focuses on optimizing process performance.
Since process variables of a product or a process is a large part of discussion relative to quality, analysis of variance (ANOVA) is the statistical method used to interpret experimental data and make a necessary discussions regarding which parameters affect the performance of the product/process [14].
3. Experimental Details
3. 1 Work Materials
AISI 4340 steel is a difficult to machine material because of its high hardness, low specific heat and tendency to get strain hardened. It is known for its toughness and capability of developing high strength in the heat treated condition while retaining good fatigue strength. Machining is best done with this alloy in the annealed or normalized and tempered condition. AISI 4340 has good ductility in the annealed condition and most forming operations are carried out in that condition. It can be bent or formed by spinning or pressing in the annealed state. AISI 4340 is high tensile strength general engineering steel ideal for automotive and aircraft components. Axles & axle components, arbors, extrusion liners, lines extrusion, magneto drive coupling, shaft & wheels, pinions & pinion shafts are the application range of AISI 4340 alloy steel. AISI 4340 is a tougher and more ductile material than EN-19 due to the Ni and Chrome alloying additions.
The bars of 60mm in diameter and 100mm in length were heated to the proper austenitizing temperature of 9200C, holding at that temperature for 30 minute time to effect the desired change in crystalline structure and quenched in oil. After quenching, tempering was carried out i.e. the material is reheated to a predetermined temperature at about 4000C below the lower critical temperature range for two hours followed by air cooling to remove residual stresses in order to obtain a homogeneous structure. The hardness after heat treatment was obtained as 47±1HRC. The chemical compositions of AISI 4340 steel as received are given in Table 1.
Table 1 Chemical composition of AISI4340 steel in percentage (%)
C Mn Cr Mo Ni Si Fe 0.39 0.77 1.1 0.17 1.55 0.38 Balance
S. R. Das, D. Dhupal, A. Kumar 286
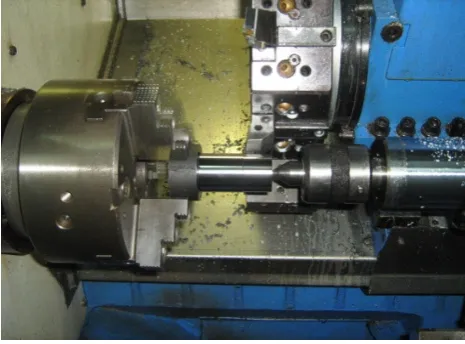
Fig1.View of cutting Zone
Table 2 Machining parameters and levels
Parameters Unit Levels
1 2 3 4 Depth of Cut (D) mm 0.2 0.3 0.4 0.5
Feed (F) mm/rev 0.05 0.1 0.15 0.2
Cutting speed (V) m/min 60 90 120 150
3.2 Cutting Inserts
In tests, coated carbide insert of ISO designation CNMG 120408 (800 diamond shaped insert), having completely the same geometry & substrate but different coating layers without chip breaker geometry, has been employed for experimentation. The 800diamond shaped insert is one of the popular inserts used with negative side cutting edge angle (SCEA). With this configuration it can be used for seven operations as compared to the square or triangular shape. TN7015 is a thick alumina-coated carbide grade with a moderately hard, deformation resistant substrate and it is CVD coated with TiCN under layer, followed by Al2O3 intermediate layer and ZrCN outer layer. CNMG is very versatile in application & has greater strength for maximum material removal. All the inserts used for the experiments had same geometry with negative rake angle. Multilayer coated carbide inserts ISO code CNMG 120408 mounted on a PCLNR 2525M12 tool
holder were used with a cutting geometry as follows: clearance angle =60, negative rake angle is =60, negative cutting edge inclination angle =−60 and major cutting edge angle =950& nose radius =0.8mm. In all instances, the back rake angle and the side rake angle is −50.
3.3 Experimental procedure
The experiment has been conducted to analyze the effect of depth of cut, cutting speed and feed on the surface roughness (Ra). The experiments were carried out with three parameters at four levels each, as shown in Table 2. The selected experimental design is 43 (= 64) full factorial design with one replicate and the design matrix is shown in Table 3. The turning experimental runs were carried out in order to obtain experimental data in the dry condition on a CNC lathe machine (Jobber XL, AMS India) which have a maximum spindle speed of 3500 rpm and a maximum power of 16 kW. Prior to actual machining, the skin
287 Experimental Study & Modeling of ………..
International Journal of Automotive Engineering Vol. 3, Number 1, March 2013
layers were removed by a new cutting edge of uncoated carbide insert of very small depth of cut. This was done in order to remove the rust layer or hardened top layer from the outside surface and to minimize any effect of in homogeneity on the experimental results. A hole was drilled on the face of the work piece to allow it to be supported at the tailstock (fig. 1). In attempts to evaluate the effects of machining parameters on surface roughness values in hard turning by using experimental data, the working range was decided on the basis of data given in the hand book [15]. The surface roughness of the turned surface was measured using a portable Mitutoyo surface roughness tester (Taylor Hobson, Surtronic 25) in terms of arithmetic average roughness (Ra). Typically, grinding or honing surface-finishing processes yield surfaces with a Ra in the range of 0.1– 1.6µm. We used 1.6µm as the control criterion for finish hard turning [16].
4. Result and Data Analysis
The plan of the experiment has developed for assessing the influence of the cutting speed (V), feed rate (F) and depth of cut (D) on the surface roughness (Ra). Table 3 illustrates the experimental results for surface roughness (Ra).
4.1 Analysis of Variance (ANOVA)
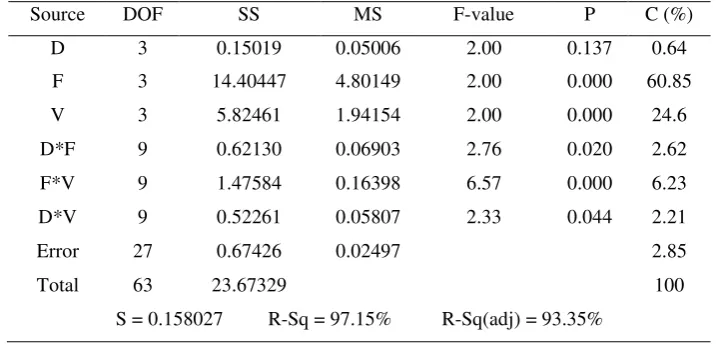
The experimental results are analyzed with analysis of variance (ANOVA), which is used for identifying the factors significantly affecting the performance measures. The results of the ANOVA with surface roughness are shown in Table 4. This analysis was carried out for significance level of
α=0.05, i.e. for a confidence level of 95%. The sources with a P-value less than 0.05 are considered to have a statistically significant contribution to the performance measures. It is observed from the ANOVA that feed (60.85%) is the most significant parameter followed by cutting speed (24.6%) and the two level interactions were also found to be significant between cutting speed-feed (6.23%) and depth of cut-feed (2.62%) on surface roughness.
4.2 Interpretation of Plots
The data are further analyzed to study the interact on amount machining parameters and the main effect plots, interaction plots, counter plots and surface plots are analyzed with the help of a software package MINITAB15 and shown in figure 2, 3, 4 and 5 respectively. The plots show the variation of individual response with the three parameters, i.e. cutting speed, feed and depth of cut separately.
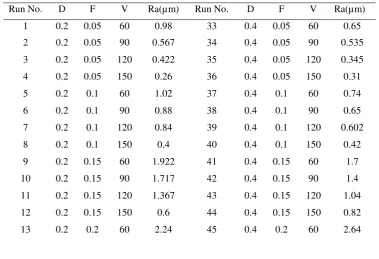
Table 3 Design matrix and experimental results for surface roughness (Ra)
Run No. D F V Ra(µm) Run No. D F V Ra(µm) 1 0.2 0.05 60 0.98 33 0.4 0.05 60 0.65 2 0.2 0.05 90 0.567 34 0.4 0.05 90 0.535 3 0.2 0.05 120 0.422 35 0.4 0.05 120 0.345 4 0.2 0.05 150 0.26 36 0.4 0.05 150 0.31 5 0.2 0.1 60 1.02 37 0.4 0.1 60 0.74 6 0.2 0.1 90 0.88 38 0.4 0.1 90 0.65 7 0.2 0.1 120 0.84 39 0.4 0.1 120 0.602 8 0.2 0.1 150 0.4 40 0.4 0.1 150 0.42 9 0.2 0.15 60 1.922 41 0.4 0.15 60 1.7 10 0.2 0.15 90 1.717 42 0.4 0.15 90 1.4 11 0.2 0.15 120 1.367 43 0.4 0.15 120 1.04 12 0.2 0.15 150 0.6 44 0.4 0.15 150 0.82 13 0.2 0.2 60 2.24 45 0.4 0.2 60 2.64
S. R. Das, D. Dhupal, A. Kumar 288
14 0.2 0.2 90 1.94 46 0.4 0.2 90 2.36 15 0.2 0.2 120 1.42 47 0.4 0.2 120 1.5 16 0.2 0.2 150 0.762 48 0.4 0.2 150 0.795 17 0.3 0.05 60 0.602 49 0.5 0.05 60 0.995 18 0.3 0.05 90 0.572 50 0.5 0.05 90 0.43 19 0.3 0.05 120 0.51 51 0.5 0.05 120 0.29 20 0.3 0.05 150 0.36 52 0.5 0.05 150 0.27 21 0.3 0.1 60 0.902 53 0.5 0.1 60 1.137 22 0.3 0.1 90 0.88 54 0.5 0.1 90 0.837 23 0.3 0.1 120 0.72 55 0.5 0.1 120 0.615 24 0.3 0.1 150 0.55 56 0.5 0.1 150 0.6 25 0.3 0.15 60 1.9 57 0.5 0.15 60 1.38 26 0.3 0.15 90 1.8 58 0.5 0.15 90 1.24 27 0.3 0.15 120 1.467 59 0.5 0.15 120 1.175 28 0.3 0.15 150 1.3 60 0.5 0.15 150 0.71 29 0.3 0.2 60 1.93 61 0.5 0.2 60 2.555 30 0.3 0.2 90 1.91 62 0.5 0.2 90 1.81 31 0.3 0.2 120 1.55 63 0.5 0.2 120 1.635 32 0.3 0.2 150 1.39 64 0.5 0.2 150 0.742
Table 4 Analysis of variance for surface roughness (Ra)
Source DOF SS MS F-value P C (%) D 3 0.15019 0.05006 2.00 0.137 0.64 F 3 14.40447 4.80149 2.00 0.000 60.85 V 3 5.82461 1.94154 2.00 0.000 24.6 D*F 9 0.62130 0.06903 2.76 0.020 2.62 F*V 9 1.47584 0.16398 6.57 0.000 6.23 D*V 9 0.52261 0.05807 2.33 0.044 2.21 Error 27 0.67426 0.02497 2.85
Total 63 23.67329 100
S = 0.158027 R-Sq = 97.15% R-Sq(adj) = 93.35%
DOF= Degree of freedom, SS= Sum of squares, MS= Mean squares, C= Contribution
289 Experimental Study & Modeling of ……….
International Journal of Automotive Engineering Vol. 2, Number 3, July 2012 Fig2.Main Effects Plots for surface roughness
Fig3.Interaction Plot for surface roughness (Ra)
Figure 2 shows the main effect plot for surface roughness. In the plots, the x-axis indicates the value of each process parameter at two level and y-axis the response value. Horizontal line indicates the mean value of the response. The main effects plots are used to determine the optimal design conditions to obtain the optimum surface finish. The results show that with the increase in feed there is a continuous increase in surface roughness value. Here also, the main effect plot shows the decrease in roughness with increased cutting speed. According to this main effect plot, the optimal conditions for surface roughness are: feed at level-1 (0.05 mm/rev) and cutting speed at level-4 (150 m/min).
4.3 Regression Analysis
Multiple second order regression equation has implemented to obtain the correlation between the machining parameters and the measured surface roughness. The obtained equation was as follows:
The layer value of R2 is always desirable. This confirms the suitability of the multiple regression equation and correctness of the calculated constants.
Ra = 0.0895+0.7428D+12.1729F+0.0053V - 1.7062D2+12.1625F2-0.0000V2+1.728DF-0.0005DV - 0.0709F (R2 = 0.84) (1)
S. R. Das, D. Dhupal, A. Kumar 290
Fig4.Counter Plots for surface roughness (Ra)
Fig5.Surface Plots for surface roughness (Ra)
Inspection of some diagnostic plots of the model was done to test the statistical validity of the models. The residuals could be said to follow a straight line in normal plot of residuals implying that the errors are distributed normally which is shown in fig. 6 and are randomly scattered within constant variance across the residuals versus predicted plot shown in fig. 7
5. Conclusion
The following conclusions are derived during turning of hardened AISI 4340 steel with CVD multilayer coated carbide insert. During experimentation the effect of various machining
291 Experimental Study & Modeling of ………..
International Journal of Automotive Engineering Vol. 2, Number 3, July 2012
parameters on surface roughness are studied with the help of full factorial design of experiments (DOE) and determined the best combination of machining parameters such as depth of cut, feed and cutting speed. It is observed from the ANOVA that feed (60.85%) is the most significant parameter followed by cutting speed (24.6%) and the two level interactions were also found to be significant between cutting speed-feed (6.23%) and depth of cut-feed (2.62%) on surface roughness. From the
experimentation it is found that, depth of cut did not impact the surface roughness in the studied range, significantly. The most optimal results for surface roughness were observed when cutting speed was set at 150 m/min and feed of 0.05 mm/rev. The present research work on turning of hardened AISI 4340 steel with CVD multilayer coated carbide insert will be useful for the advanced engineering industries those are working in the field of precision machining.
Fig6.Normal Probability of the residuals for surface roughness (Ra)
Fig7.Residuals versus the fitted values for surface roughness (Ra)
S. R. Das, D. Dhupal, A. Kumar 292
6. References
[1]. Thamizhmanii, S., Saparudin, S. and Hasan, S.,“Analyses of surface roughness by turning process using Taguchi method”, Journal of Achievements in Materials and Manufacturing Engineering, 20, 503-506, 2007.
[2]. Lalwani, D.I., Mehta, N.K., and Jain, P.K., “Experimental investigations of cutting parameters influence on cutting forces and surface roughness in finish hard turning of MDN250 steel”,Journal of Materials Processing Technology, 206, 167-179, 2008.
[3]. Hodgson, T., and Trendler, P.H.J.,“Turning hardened tool steels with cubic boron nitride insert”, Annals of the CIRP, 30,63-66, 1981. [4]. Sahin, Y.,“Comparison of tool life between
ceramic and cubic boron nitride (CBN) cutting tools when machining hardened steels”, Journal of materials processing technology, 209, 3478– 3489, 2009.
[5]. Gillibrand, D., Sarwar, M. and Pierce, C.T., “The economic benefit of finish turning with coated carbide”, Surface and Coatings Technology, 86, 809-813, 1996.
[6]. Shaw, M.C., “Metal cutting principles”, Oxford University Press, New York, 2005.
[7]. Jacques Masounave, Youssef A. Youssef, Yves Beauchamp and Marc Thomas,“An experimental design for surface roughness and built-up edge formation in lathe dry turning”, International Journal of Quality Science, 2(3), 167 – 180, 1997.
[8]. Ersan Aslan, Necip Camuscu and Burak Birgoren,“Design optimization of cutting parameters when turning hardened AISI 4140 steel (63 HRC) with Al2O3+TiCN mixed ceramic tool”, Journal of Materials and Design, 28, 1618–1622, 2007.
[9]. Davim, J.P., and Figueira, L.,“Machinability evaluation in hard turning of cold work tool steel (D2) with ceramic tools using statistical techniques”,Journal of Materials and Design, 28, 1186–1191, 2007.
[10].Marinkovic Velibor and Madic Milos,“Optimization of surface roughness in turning alloy steel by using Taguchi method”,Scientific Research and Essays, 6(16), 3474-3484, 2011.
[11].Senthilkumar, J.S., Selvarani, P., and Arunachalam, R.M.,“Selection of machining parameters based on the analysis of surface
roughness and flank wear in finish turning and facing of Inconel 718 using Taguchi technique”,Emirates Journal for Engineering Research, 15(2), 7-14, 2010.
[12].Kaladhar, M., Subbaiah, K.V., Rao, C. S. and Rao, K.N.,“Optimization of process parameters in turning of AISI202 austenitic stainless steel”, ARPN J. of Engineering and Applied Sciences, 5(9), 79-87, 2010.
[13].Montgomery D.C.,“Design and Analysis of Experiments”, John Wiley & Sons Inc, 2001. [14].Ross, P.J.,“Taguchi Techniques for Quality
Engineering”, 2nd Edition, McGraw-Hill Book Company, New York, 1996
[15].Isakov, E.,“Cutting data for turning steel”,Industrial press, New York, 2009.
[16].Noordin, M.Y., Tang, Y.C. and Kurniawan, D.,“The use of TiAlN coated carbide tool when finish machining hardened stainless steel”,International J. of Precision Technology, 1(1), 21-29, 2007.