PRIMARY RESEARCH
Effect of hyperoside on cervical cancer cells
and transcriptome analysis of differentially
expressed genes
Weikang Guo
1†, Hui Yu
2†, Lu Zhang
1, Xiuwei Chen
1, Yunduo Liu
1, Yaoxian Wang
1*and Yunyan Zhang
1*Abstract
Background: Hyperoside (Hy) is a plant-derived quercetin 3-d-galactoside that exhibits inhibitory activities on vari-ous tumor types. The objective of the current study was to explore Hy effects on cervical cancer cell proliferation, and to perform a transcriptome analysis of differentially expressed genes.
Methods: Cervical cancer HeLa and C-33A cells were cultured and the effect of Hy treatment was determined using the Cell Counting Kit-8 (CCK-8) assay. After calculating the IC50 of Hy in HeLa and C-33A cells, the more sensitive to Hy treatment cell type was selected for RNA-Seq. Differentially expressed genes (DEGs) were identified by comparing gene expression between the Hy and control groups. Candidate genes were determined through DEG analysis, pro-tein interaction network (PPI) construction, PPI module analysis, transcription factor (TF) prediction, TF-target network construction, and survival analysis. Finally, the key candidate genes were verified by RT-qPCR and western blot.
Results: Hy inhibited HeLa and C33A cell proliferation in a dose- and time-dependent manner, as determined by the CCK-8 assay. Treatment of C-33A cells with 2 mM Hy was selected for the subsequent experiments. Compared with the control group, 754 upregulated and 509 downregulated genes were identified after RNA-Seq. After functional enrichment, 74 gene ontology biological processes and 43 Kyoto Encyclopedia of Genes and Genomes pathways were obtained. According to the protein interaction network (PPI), PPI module analysis, TF-target network construc-tion, and survival analysis, the key genes MYC, CNKN1A, PAX2, TFRC, ACOX2, UNC5B, APBA1, PRKACA , PEAR1, COL12A1, CACNA1G, PEAR1, and CCNA2 were detected. RT-qPCR was performed on the key genes, and Western blot was used to verify C-MYC and TFRC. C-MYC and TFRC expressions were lower and higher than the corresponding values in the control group, respectively, in accordance with the results from the RNA-Seq analysis.
Conclusion: Hy inhibited HeLa and C-33A cell proliferation through C-MYC gene expression reduction in C-33A cells and TFRC regulation. The results of the current study provide a theoretical basis for Hy treatment of cervical cancer.
Keywords: Hyperoside, Cervical cancer, RNA-Seq, Differentially expressed genes, Gene ontology, Kyoto Encyclopedia of Genes and Genomes, Protein–protein interactions network, Survival analysis
© The Author(s) 2019. This article is distributed under the terms of the Creative Commons Attribution 4.0 International License (http://creat iveco mmons .org/licen ses/by/4.0/), which permits unrestricted use, distribution, and reproduction in any medium, provided you give appropriate credit to the original author(s) and the source, provide a link to the Creative Commons license, and indicate if changes were made. The Creative Commons Public Domain Dedication waiver (http://creativecommons.org/ publicdomain/zero/1.0/) applies to the data made available in this article, unless otherwise stated.
Open Access
*Correspondence: [email protected]; [email protected] †Weikang Guo and Hui Yu contributed equally to this article
1 Department of Gynecology, Harbin Medical University Cancer Hospital, No. 150 Haping Road, Nangang District, Harbin 150081, Heilongjiang Province, China
Background
Cervical cancer is a malignant epithelial tumor that occurs in the cervix. Most cervical cancers can be screened early by cervical cytology and virology. More-over, human papillomavirus (Hpv) vaccination has emerged as an effective method for cervical cancer prevention [1]. However, due to inadequate screening programs in many parts of the world, cervical cancer remains one of the most common cancer types in females [2, 3]. Surgery is the main method for early treatment. Radiotherapy and chemotherapy are further therapy options. Women with cervical, especially advanced or recurrent, cancer are commonly treated using chemo-therapy [4]. Recently, several reports have implicated traditional Chinese medicines in the treatment of cervi-cal cancer. For example, ferulic acid inhibits the prolifera-tion, invasion, and autophagy of cervical cancer cells, and induces cell cycle arrest [5]. Moreover, casticin induces G0/G1 cell cycle arrest and apoptosis in gallbladder can-cer [6]. Hyperoside (Hy) is a flavonoid found mainly in Chinese herbal medicines. It exhibits anti-inflammatory, anti-oxidative, and vascular protective effects. Several recent studies demonstrated an anticancer effect of Hy in a variety of tumor types. Thus, Hy increased apopto-sis and autophagy in pancreatic cancer cells [7]. Another study described Hy-mediated inhibition of human osteo-sarcoma cell proliferation and promotion of osteogenic differentiation [8]. Yet another study implicated Hy in the caspase-3, p53, and nuclear factor-kappa B (NF-κB) signaling pathways, which induce apoptosis and inhibit lung cancer cell proliferation [9, 10]. In gynecological oncology, Hy induces endometrial cancer cell apoptosis through the mitochondrial pathway [11]. However, Hy effect on cervical cancer development and the molecular mechanism implicated are unclear.
In the current study, the effect of Hy on two cervical cancer cell lines was determined using cytological meth-ods, to detect changes in the cell proliferation index. Dif-ferentially expressed genes (DEGs) were identified by RNA sequencing (RNA-seq), comparing untreated and Hy-treated cells. Further analyses of the DEGs were con-ducted to explore the specific mechanism of Hy action on cervical cancer cells.
Methods
Cell culture
HeLa and C-33A cells (both acquired from the Chinese Academy of Sciences Shanghai Cell Bank) were cultured in Dulbecco’s modified Eagle’s medium (Gibco,Waltham, MA, USA) supplemented with 10% fetal bovine serum. They were inoculated in 96-well plates, cultured at 37 °C for 24 h, and then divided into seven groups. One group was untreated, whereas the remaining groups were
treated with 0.25, 0.5, 1, 2, 4, or 8 mM Hy (Solarbio, Bei-jing, China) for 24, 48, or 72 h.
Cell viability and IC50 determination
Cell viability was determined using the Cell Counting Kit-8 (CCK-8) assay at 24, 48, and 72 h. At each time point, 100 µL CCK-8 (Beyotime Bio, Shanghai, China) was added to each well of a 96-well plate, which was then placed in a 37 °C, 5% CO2 incubator. HeLa and C-33A
cells were incubated for 0.5 and 2 h, respectively, in the dark. The absorbance of each well was measured at 450 nm using an EPOCH microplate reader (Gene Com-pany Limited). The half-inhibitory concentration (IC50) was calculated with GraphPad (version 5.0), and the cell line exhibiting higher sensitivity to Hy treatment was selected for follow-up experiments.
RNA‑Seq and data preprocessing
Cells were divided into two groups for this experiment: a Hy-treated and a blank control group; the experiment was repeated three times with independent biological samples. Total RNA was extracted using TRIzol (TaKaRa Bio, Dalian, China), and the extracted RNA was sent to Shanghai New Bioinformatics Co., Ltd. to construct a cDNA library using an Illumina HiSeqTM 2000 platform for double-end PE150 sequencing with 6G data per sam-ple. Unreliable bases and reads were filtered out to obtain clean data for the six samples. The TopHat software (ver-sion 2.1.0) was used to locate clean reads on the human reference genome (GENCODE download, GRCh38) [12]. The read count information on each gene alignment was obtained using the htseq-count tool (version 0.9.1) based on the human gene annotation information provided by GENCODE (Release 25).
Inter‑sample expression level and principal component analysis
The cor function of the R software (version: 3.4.1) was used to calculate the similarity between the two sam-ples in each experiment. The prcomp function of the R software was utilized to reduce the dimensionality of the data. The ggfortify package (version: 0.4.6) created PCA plots for principal component analysis.
DEG screening
expression threshold for DEGs was set to P < 0.05, |logFC| > 0.585.
Kyoto Encyclopedia of Genes and Genomes (KEGG) and Gene Ontology (GO)
GO [16] functional annotation and KEGG [17] enrich-ment analysis of the DEGs were performed using the DAVID (version 6.8, https ://david -d.ncifc rf.gov/) [18]. P < 0.05 and enrichment count of at least 3 were consid-ered thresholds for significant enrichment results.
Protein–protein interaction network (PPI) and PPI module analysis
The STRING (version 10.0, http://www.strin g-db.org/) database [19] was used to predict whether gene-encoded proteins interact with each other. A PPI network was constructed for the DEGs with the STRING database (parameter setting: species = homo; PPI score = 0.9). After obtaining the PPI relationship, a network diagram was constructed with Cytoscape (version 3.4.0, http:// chian ti.ucsd.edu/cytos cape-3.4.0/) [20]. CytoNCA plugin [21] (version 2.1.6, parameter setting: default) for Cytoscape was used to analyze the topological properties of the node network. The hub protein in the PPI network was obtained by ranking the network topology properties for each node.
The MCODE plugin [22] (version 1.5.1, parameter set-ting: default) for Cytoscape was used to screen protein complexes or functional modules. The modules with a score > 5 in the screening result were analyzed for KEGG path enrichment using the R package clusterProfiler [23] (version: 3.8.1).
Transcription factor prediction
The genes corresponding to the proteins identified in the PPI network were used as candidate genes, and tran-scription factors (TFs) were predicted with the TRRUST (version 2, http://www.grnpe dia.org/trrus t/, threshold setting: q-value < 0.05, number of target genes ≥ 2) [24]. The predicted TFs were compared with the DEGs to obtain differential TFs, and the transcription regulatory network (TF-target network) was constructed utilizing the Cytoscape software.
Survival analysis of key genes
The dataset for survival analysis was obtained from the UCSC database (http://xena.ucsc.edu/) [25], which contains TCGA-related data. Cancer samples with available patient survival information (n = 291) were
selected, and the TCGA cervical cancer clinical data were used to extract the clinical information related to prognosis. The genes corresponding to the hub proteins obtained from the PPI network and the TFs
in the TF-target regulatory network were utilized as candidate genes, and candidate gene expression val-ues were screened from the TCGA. The median valval-ues were divided into two groups (high expression and low expression). A log-rank statistical test was performed, and the threshold P value was set to < 0.05. The rela-tionship between candidate genes and patient progno-sis was analyzed, and a Kaplan–Meier survival curve was plotted.
RT‑qPCR analysis
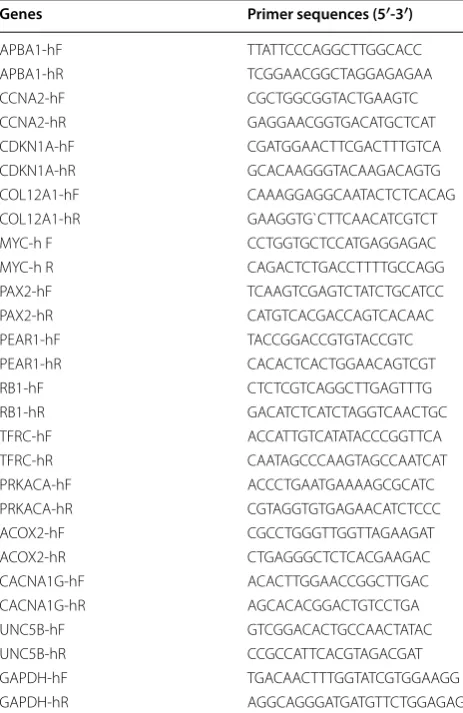
Key genes for RT-qPCR verification were selected based on the PPI networks, topological properties, TF analy-ses, logFC, and degree ranking data. RNA extraction was performed using Trizol (TaKaRa Bio, Dalian, China), and cDNA was synthesized with PrimeScript RT Master Mix (TaKaRa Bio, Tokyo, Japan). Subsequently, amplifi-cation was carried out based on the Power SYBR Green PCR Master Mix (Thermo Fisher Scientific, Waltham, MA, USA). After an initial denaturation step of 10 min at 95 °C, the product was routinely examined using a dis-sociation curve, and the amount of transcript was com-pared with the relative Ct method with glyceraldehyde 3-phosphate dehydrogenase (GAPDH) as an internal reference control. The 2−ΔΔ Cq method was utilized for
analysis of the experimental data. Primers and primer sequences for each gene are provided in Table 1.
Western blot analysis4
Statistical analysis
All experiments were replicated at least 3 times, and the data are presented as mean ± standard deviation. The results from CCK-8, IC50 values, qPCR, and west-ern blot were analyzed using GraphPad Prism 5.0 soft-ware (GraphPad Prism, San Diego, CA). Student’s t-test was utilized to compare differences between two groups. One-way ANOVA was applied for comparisons among three or more groups. Statistical signifcance was accepted for p < 0.05.
Results
Hy effect on HeLa and C‑33A cell proliferation
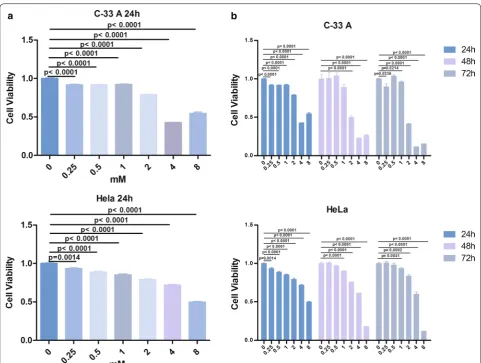
After 24 h in culture, the proliferation rate of HeLa cells decreased by 6.60%, 11.37%, 14.68%, 20.65%, 28.24%, and 50.16% (P < 0.01) in the presence of 0.25, 0.5, 1, 2, 4, and 8 mM Hy, respectively, compared to that of the control group (Fig. 1a). The respective rates for C-33A cells were 8.19%, 8.33%, 7.87%, 21.09%, 57.26%, and 45.4% (P < 0.01).
Furthermore, HeLa and C-33A cell viability decreased significantly with time (24, 48, and 72 h; Fig. 1b). Thus, Hy inhibited the proliferation of HeLa and C-33A cells in a dose- and time-dependent manner in vitro. The IC50 of Hy was 2 mM for C-33A cells and 4 mM for HeLa cells (Fig. 1b). Subsequent experiments included C-33A cells and 2 mM Hy.
Sequencing data analyses
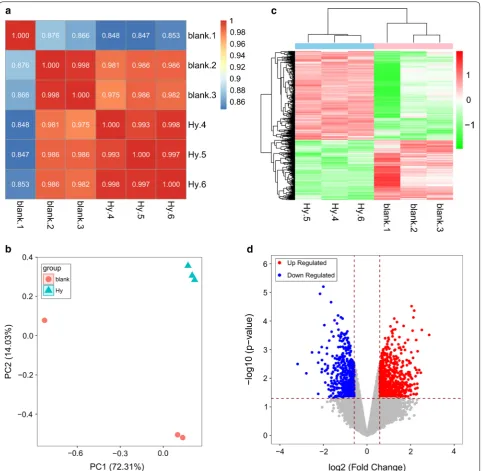
After data processing, 14,000 genes were finally obtained. Based on the expression levels in each provided sample, the Pearson correlation coefficient between two samples is represented by an (r) value (Fig. 2a). The closer an (r) value is to 1, the higher the expression pattern similarity between samples. The average intragroup sample similar-ity was 0.977, whereas the average between-group sample similarity was 0.93. These data indicated that the sam-ples were reasonable and the experimental results were reliable.
The results from a principal component analysis are shown in Fig. 2b. The Hy group was clearly distinct from the control group, with obvious DEGs in the Hy group and control group.
DEG analysis
Using the defined threshold, we obtained 1263 DEGs, including 754 upregulated and 509 downregulated genes. Based on a two-dimensional hierarchical clustering heat map of the 1263 DEG values (Fig. 2c), these genes clearly separated the samples in the pre-grouping (Fig. 2d).
Functional and pathway enrichment analysis
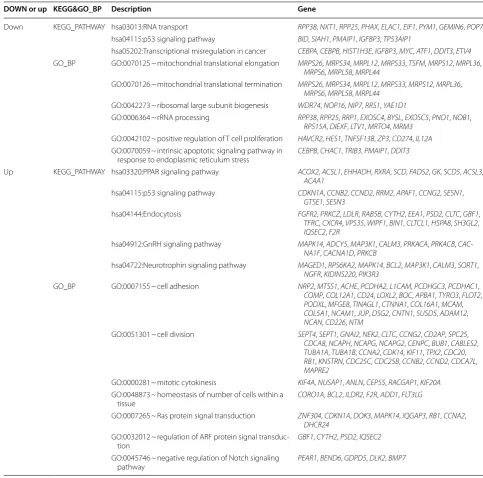
The 1263 DEGs were used for GO biological processes (BP) functional and KEGG pathway analyses (Table 2). The GO_BP functional analysis determined that the downregulated DEGs were mainly enriched in mitochon-drial translational elongation, mitochonmitochon-drial translational termination, ribosomal large subunit biogenesis, and rRNA processing, and so on. Upregulated DEGs were mainly enriched in cell adhesion, cell division, mitotic cytokinesis, and homeostasis of cell types within a tissue, etc. The KEGG pathway analysis revealed that the down-regulated DEGs were mainly enriched in RNA transport, p53 signaling pathway, and transcriptional misregulation in cancer. Upregulated DEGs were enriched in endocyto-sis and in the PPAR, p53, GnRH, and neurotrophin sign-aling pathways.
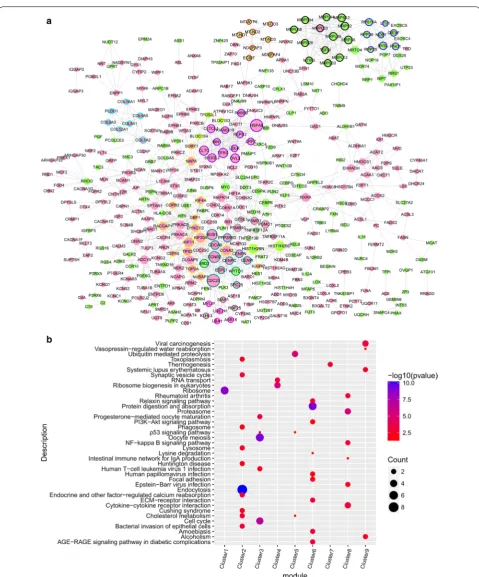
A PPI network and module mining of DEGs
A PPI network was obtained for a total of 435 nodes and 1130 relationship pairs (Fig. 3a). A Cytoscape software CytoNCA plug-in was used to analyze the topological properties of the DEGs in the network. The top 20 degree
Table 1 Primers and primer sequences for each gene analyzed with RT-qPCR
Genes Primer sequences (5′‑3′)
APBA1-hF TTA TTC CCA GGC TTG GCA CC
APBA1-hR TCG GAA CGG CTA GGA GAG AA
CCNA2-hF CGC TGG CGG TAC TGA AGT C
CCNA2-hR GAG GAA CGG TGA CAT GCT CAT
CDKN1A-hF CGA TGG AAC TTC GAC TTT GTCA
CDKN1A-hR GCA CAA GGG TAC AAG ACA GTG
COL12A1-hF CAA AGG AGG CAA TAC TCT CACAG
COL12A1-hR GAA GGT G`CTT CAA CAT CGT CT
MYC-h F CCT GGT GCT CCA TGA GGA GAC
MYC-h R CAG ACT CTG ACC TTT TGC CAGG
PAX2-hF TCA AGT CGA GTC TAT CTG CATCC
PAX2-hR CAT GTC ACG ACC AGT CAC AAC
PEAR1-hF TAC CGG ACC GTG TAC CGT C
PEAR1-hR CAC ACT CAC TGG AAC AGT CGT
RB1-hF CTC TCG TCA GGC TTG AGT TTG
RB1-hR GAC ATC TCA TCT AGG TCA ACTGC
TFRC-hF ACC ATT GTC ATA TAC CCG GTTCA
TFRC-hR CAA TAG CCC AAG TAG CCA ATCAT
PRKACA-hF ACC CTG AAT GAA AAG CGC ATC
PRKACA-hR CGT AGG TGT GAG AAC ATC TCCC
ACOX2-hF CGC CTG GGT TGG TTA GAA GAT
ACOX2-hR CTG AGG GCT CTC ACG AAG AC
CACNA1G-hF ACA CTT GGA ACC GGC TTG AC
CACNA1G-hR AGC ACA CGG ACT GTC CTG A
UNC5B-hF GTC GGA CAC TGC CAA CTA TAC
UNC5B-hR CCG CCA TTC ACG TAG ACG AT
GAPDH-hF TGA CAA CTT TGG TAT CGT GGA AGG
centrality (DC), betweenness centrality (BC), and close-ness centrality (CC) scores included CCNA2, CLTC, DVL2, HIST1H2BD, HIST1H2BN, HSPA8, PRKACA, and TFRC (Table 3), which were key node proteins in the PPI network.
In this network, a total of 32 functional sub-modules were identified, including nine with a score > 5 (Fig. 3a). KEGG_pathway enrichment was performed on the nine modules (Fig. 3b), which were enriched mainly in: module 1—ribosomes; module 2—endocytosis; module 3—oocyte meiosis; module 4—ribosome biogenesis in eukaryotes; module 5—ubiquitin-mediated proteolysis; module 6—protein digestion and absorption; module 7— thermogenesis; module 8—proteasome; and module 9— viral carcinogenesis.
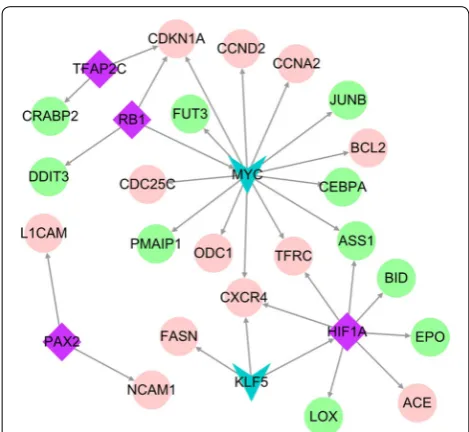
TF prediction
For TF prediction, a total of 67 TFs were obtained. With reference to the DEGs, six differentially regulated TFs
were identified, which included four upregulated and two downregulated TFs. They were combined with 24 upregulated genes. In the TF-target network, CDKN1A,
ASS1, CXCR4, and TFRC were coincidentally regulated by two or three TFs, which may be important for the transcriptional regulation (Fig. 4). Therefore, CDKN1A,
ASS1, CXCR4, and TFRC were identified as key genes.
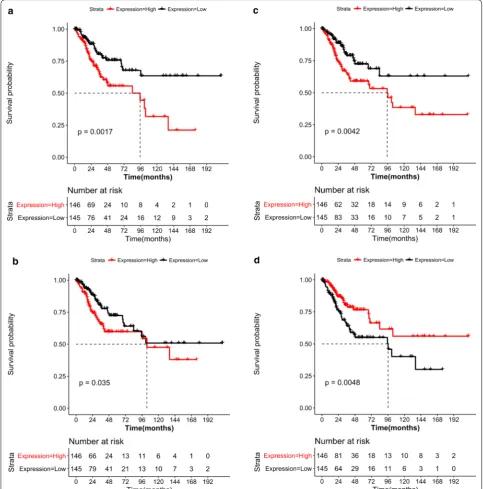
Survival analysis of key genes
Based on the gene expression values and the TCGA cervical cancer clinical information, four genes were significantly associated with disease progno-sis (P < 0.05). Among these, MYC was downregulated, whereas HSPA8, CLTC, and PRKACA were upregu-lated (Fig. 5). A survival curve analysis revealed that increased HSPA8, CLTC, and MYC expression and decreased PRKACA expression were associated with a worse prognosis.
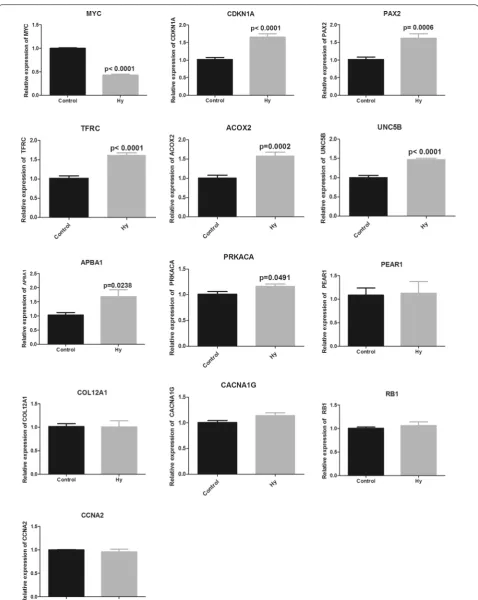
RT‑qPCR and western blot analysis of key genes
MYC gene expression in Hy-treated cells was signifi-cantly downregulated (P < 0.01), whereas CDKN1A,
PAX2, TFRC, ACOX2, and UNC5B gene
expres-sion was significantly upregulated (P < 0.01) in com-parison with the blank control group measured by
RT-qPCR. Moreover, APBA1 and PRKACA gene levels were increased (P < 0.05). However, PEAR1, CCNA2,
COL12A1, PEAR1, and CACNA1G did not exhibit sig-nificant changes (Fig. 6).
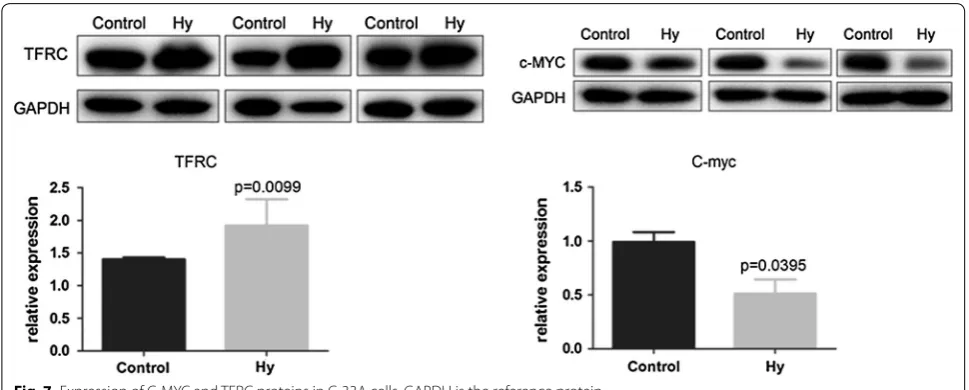
Western blot analysis revealed that Hy treatment significantly downregulated C-MYC protein levels (P < 0.01) and significantly increased TFRC protein
levels in C-33A cells compared to those in the control group (P < 0.01) (Fig. 7).
Discussion
Hy significantly inhibited C-33A and HeLa human cervi-cal cancer cell proliferation in a dose- and time-depend-ent manner. This finding is consisttime-depend-ent with the previously described Hy-induced inhibition of human non-small cell carcinoma [26]. The mechanism of cell prolifera-tion inhibiprolifera-tion was further investigated in C-33 A cells.
A total of 1263 DEGs were obtained by RNA-Seq and screening, indicating a significant effect of Hy on C-33A cell transcription. The identified DEGs were examined by GO_BP functional and KEGG pathway analyses. The upregulated genes were mainly enriched in cell adhe-sion [27], cell division and proliferation [28], peroxisome proliferator-activated receptor [29], p53 [30], and gonad-otropin-releasing hormone signaling pathways [31, 32]. These signaling pathways are closely related to tumor cell migration or invasion. The downregulated genes were
Table 2 Key GO biological processes and KEGG pathways
DOWN or up KEGG&GO_BP Description Gene
Down KEGG_PATHWAY hsa03013:RNA transport RPP38, NXT1, RPP25, PHAX, ELAC1, EIF1, PYM1, GEMIN6, POP7
hsa04115:p53 signaling pathway BID, SIAH1, PMAIP1, IGFBP3, TP53AIP1
hsa05202:Transcriptional misregulation in cancer CEBPA, CEBPB, HIST1H3E, IGFBP3, MYC, ATF1, DDIT3, ETV4
GO_BP GO:0070125 ~ mitochondrial translational elongation MRPS26, MRPS34, MRPL12, MRPS33, TSFM, MRPS12, MRPL36,
MRPS6, MRPL58, MRPL44
GO:0070126 ~ mitochondrial translational termination MRPS26, MRPS34, MRPL12, MRPS33, MRPS12, MRPL36,
MRPS6, MRPL58, MRPL44
GO:0042273 ~ ribosomal large subunit biogenesis WDR74, NOP16, NIP7, RRS1, YAE1D1
GO:0006364 ~ rRNA processing RPP38, RPP25, RRP1, EXOSC4, BYSL, EXOSC5, PNO1, NOB1,
RPS15A, DIEXF, LTV1, MRTO4, MRM3
GO:0042102 ~ positive regulation of T cell proliferation HAVCR2, HES1, TNFSF13B, ZP3, CD274, IL12A
GO:0070059 ~ intrinsic apoptotic signaling pathway in
response to endoplasmic reticulum stress CEBPB, CHAC1, TRIB3, PMAIP1, DDIT3
Up KEGG_PATHWAY hsa03320:PPAR signaling pathway ACOX2, ACSL1, EHHADH, RXRA, SCD, FADS2, GK, SCD5, ACSL3,
ACAA1
hsa04115:p53 signaling pathway CDKN1A, CCNB2, CCND2, RRM2, APAF1, CCNG2, SESN1,
GTSE1, SESN3
hsa04144:Endocytosis FGFR2, PRKCZ, LDLR, RAB5B, CYTH2, EEA1, PSD2, CLTC, GBF1,
TFRC, CXCR4, VPS35, WIPF1, BIN1, CLTCL1, HSPA8, SH3GL2,
IQSEC2, F2R
hsa04912:GnRH signaling pathway MAPK14, ADCY5, MAP3K1, CALM3, PRKACA , PRKACB, CAC-NA1F, CACNA1D, PRKCB
hsa04722:Neurotrophin signaling pathway MAGED1, RPS6KA2, MAPK14, BCL2, MAP3K1, CALM3, SORT1,
NGFR, KIDINS220, PIK3R3
GO_BP GO:0007155 ~ cell adhesion NRP2, MTSS1, ACHE, PCDHA2, L1CAM, PCDHGC3, PCDHAC1,
COMP, COL12A1, CD24, LOXL2, BOC, APBA1, TYRO3, FLOT2,
PODXL, MFGE8, TINAGL1, CTNNA1, COL16A1, MCAM,
COL5A1, NCAM1, JUP, DSG2, CNTN1, SUSD5, ADAM12,
NCAN, CD226, NTM
GO:0051301 ~ cell division SEPT4, SEPT1, GNAI2, NEK2, CLTC, CCNG2, CD2AP, SPC25,
CDCA8, NCAPH, NCAPG, NCAPG2, CENPC, BUB1, CABLES2,
TUBA1A, TUBA1B, CCNA2, CDK14, KIF11, TPX2, CDC20,
RB1, KNSTRN, CDC25C, CDC25B, CCNB2, CCND2, CDCA7L,
MAPRE2
GO:0000281 ~ mitotic cytokinesis KIF4A, NUSAP1, ANLN, CEP55, RACGAP1, KIF20A
GO:0048873 ~ homeostasis of number of cells within a tissue
CORO1A, BCL2, ILDR2, F2R, ADD1, FLT3LG
GO:0007265 ~ Ras protein signal transduction ZNF304, CDKN1A, DOK3, MAPK14, IQGAP3, RB1, CCNA2,
DHCR24
GO:0032012 ~ regulation of ARF protein signal
transduc-tion GBF1, CYTH2, PSD2, IQSEC2 GO:0045746 ~ negative regulation of Notch signaling
pathway
mainly involved in apoptosis [33], mitochondrial transla-tion [34], ribosome-related biological processes [35], the p53 signaling pathway [36], and transcriptional dysregu-lation pathway [37]. It should be noted that these genes are closely related to the occurrence and development of tumors. PPI network analysis identified CCNA2, CLTC,
DVL2, HIST1H2BD, HIST1H2BN, HSPA8, PRKACA, and
TFRC as candidate genes. Module analysis, transcrip-tion factor predictranscrip-tion, and TF-target regulatory network construction selected CDKN1A, ASS1, CXCR4, HIF1A,
KLF5, MYC, PAX2, RB1, and TFAP2C. Finally, key genes were identified by logFC, degree ranking, and survival analysis results. We selected MYC proto-oncogene (MYC), cyclin dependent kinase inhibitor 1A (CDKN1A), paired box 2 (PAX2), transferrin receptor (TFRC), acyl-CoA oxidase 2 (ACOX2), unc-5 netrin receptor B (UNC5B), amyloid beta precursor protein binding fam-ily A member 1 (APBA1), protein kinase cAMP-activated catalytic subunit alpha (PRKACA ), platelet endothe-lial aggregation receptor 1 (PEAR1), collagen type XII alpha 1 chain (COL12A1), CACNA1G antisense RNA 1 (CACNA1G), RB transcriptional corepressor 1 (RB1), and cyclin A2 (CCNA2) for RT-qPCR verification in the Hy and control groups. MYC, CNKN1A, PAX2, TFRC,
ACOX2, UNC5B, APBA1, and PRKACA exhibited signifi-cant differences and were consistent with previous gene screening analysis results. Then, we conducted in-depth research on MYC and TFRC. Western blot confirmed
Table 3 Top 20 PPI network topology property scores
Gene Degree Gene Betweenness Gene Closeness
CDC20 30 HSPA8 18026.846 CLTC 0.009112669
HSPA8 29 RXRA 15975.44 MYC 0.009111905
CCNB2 25 MAPK14 13874.259 TFRC 0.009106359
BUB1 23 MYC 12210.541 MAPK14 0.009104831
KIF11 22 CLTC 10207.014 CCNA2 0.009104831
KIF20A 22 TFRC 9083.066 RB1 0.00910025
CCNA2 22 DVL2 8572.19 SH3GL2 0.009099677
HIST1H2BD 21 CCNA2 8557.233 CEBPB 0.009098914
HIST1H2BN 20 MAP3K1 7784.2114 HIST1H2BD 0.009098342
CLTC 19 COL1A2 7332.0977 PRKACA 0.009098151
TFRC 19 PRKACA 7097.15 HIST1H2BN 0.009098151
DVL2 18 NAPA 6623.3286 HSPA8 0.009097007
PRKACA 18 HIST1H2BD 6509.3853 DVL2 0.009096816
CDCA8 17 CDC20 6327.5425 PRKACB 0.009096434
NAPA 17 NCAM1 6277.285 CEBPA 0.009096053
RACGAP1 17 PRKACB 6150.9224 SLC2A4 0.009095863
PPP2R5D 16 COL4A5 6065.6426 RXRA 0.009095673
DYNC1I2 16 L1CAM 5992.727 PSMC1 0.00909491
B9D2 16 HMGCS1 5969.1714 KIF4A 0.009094719
SH3GL2 16 HIST1H2BN 5857.3853 PSMB10 0.009094338
that the MYC gene was significantly downregulated and the TFRC gene was significantly upregulated.
The MYC gene encompasses a group of oncogenes including C-MYC, N-MYC, and L-MYC [38]. The MYC
gene family and its products promote cervical cancer cell proliferation, immortalization, dedifferentiation, and transformation [39, 40]; furthermore, they can be used as a potential diagnostic indicator for cervical
cancer. Increased C-MYC positive rate and correspond-ing histology findcorrespond-ings have been correlated with cancer diagnosis [41]. Presently, RNA-Seq and DEG screening identified MYC as a downregulated gene. Furthermore, MYC has been critically positioned in the constructed TF-target network; it has been implicated in the regu-lation of multiple genes, and is significantly associated with prognosis in survival analysis [42]. RT-qPCR and
western blot results further confirmed the decreased
MYC expression in Hy-treated C-33A cells. Thus, Hy has a significant inhibitory effect on the MYC gene in cervical cancer C-33A cells.
TFRC is the most important pathway for cellular iron absorption [43]. There is increasing evidence that TFRC
is involved in tumorigenesis and tumor progression, and its expression is significantly dysregulated in many cancer types [44]. Furthermore, TFRC has been closely related to human cervical cancer and is positively asso-ciated with the clinical stage and with the presence of pelvic lymph node metastases [45]. In the current study, we constructed a PPI network for DEGs and con-firmed the importance of TFRC in the PPI. RT-qPCR and western blot analyses revealed increased TFRC
expression after Hy treatment. The TF-target network analysis identified TFRC regulation by the hypoxia-inducible factor-1A (HIF-1A) signaling pathway, and elevated HIF-1A expression. Furthermore, prior studies have reported TFRC regulation by the HIF-1A signaling pathway. Under specific conditions, such as oxidative stress, inflammation, and hypoxia, HIF-1A expression induces binding of iron regulatory protein 1 and 2, and HIF-1A promotes TFRC transcription. Furthermore, HIF-1A regulates TFRC transcription by DNA binding, and the subsequent TFRC protein production promotes iron metabolism and increases oxygen exchange [44]. However, the mechanism by which Hy increases TFRC
expression remains elusive. It may be due to high HIF-1A levels caused by hypoxia. Perhaps Hy is unlikely to inhibit the TFRC-related HIF-1A signaling pathway in C-33A cell. The mechanism, by which Hy inhibits tumor proliferation, requires further experimentation and discussion.
Conclusions
In summary, Hy inhibits HeLa and C-33A cervical can-cer cell proliferation, and regulates the transcription process in C-33A cells. These findings provide a new avenue for the clinical treatment of cervical cancer and a theoretical basis for the clinical application of Hy.
Abbreviations
Hy: hyperoside; DEGs: differentially expressed genes; TF: transcription factor; GO: gene ontology; BP: biological processes; KEGG: Kyoto Encyclopedia of Gene and Genome; HPV: human papillomavirus; NF-κB: nuclear factor-kappa B; RNA-seq: RNA sequencing; IC50: half-inhibitory concentration; MYC: MYC proto-oncogene; CDKN1A: cyclin dependent kinase inhibitor 1A; PAX2: paired box 2; TFRC: transferrin receptor; ACOX2: acyl-CoA oxidase 2; UNC5B: unc-5 netrin receptor B; APBA1: amyloid beta precursor protein binding family A member 1; PRKACA : protein kinase cAMP-activated catalytic subunit alpha;
PEAR1: platelet endothelial aggregation receptor 1; COL12A1: collagen type XII
alpha 1 chain; CACNA1G: CACNA1G antisense RNA 1; RB1: RB transcriptional corepressor 1; CCNA2: cyclin A2; HIF-1A: hypoxia-inducible factor-1A.
Acknowledgements
Not applicable.
Authors’ contributions
WG, HY: data analysis, manuscript writing. YW, YZ: data analysis, project devel-opment. LZ: manuscript editing. XC, YL: data collection. All authors read and approved the final manuscript.
Funding
This work was supported by the National Natural Science Foundation of China (Program No. 81772274 and Program No. 81672584) and The General Program of Provincial Natural Science Foundation (Program No. H2017045 and Program No. ZD2016016).
Availability of data and materials
Not applicable.
Ethics approval and consent to participate
Not applicable.
Consent for publication
Competing interests
The authors declare that they have no competing interests.
Author details
1 Department of Gynecology, Harbin Medical University Cancer Hospital, No. 150 Haping Road, Nangang District, Harbin 150081, Heilongjiang Province, China. 2 Department of Cardiopulmonary Function, Harbin Medical University Cancer Hospital, Harbin 150081, Heilongjiang Province, China.
Received: 7 May 2019 Accepted: 29 August 2019
References
1. D’Addario M, Redmond S, Scott P, Egli-Gany D, Riveros-Balta AX, Henao Restrepo AM, Low N. Two-dose schedules for human papillomavirus vac-cine: systematic review and meta-analysis. Vaccine. 2017;35(22):2892–901. 2. Marth C, Landoni F, Mahner S, McCormack M, Gonzalez-Martin A,
Colombo N. Cervical cancer: ESMO clinical practice guidelines for diagno-sis, treatment and follow-up. Ann Oncol. 2018;29:262.
3. Peirson L, Fitzpatrick-Lewis D, Ciliska D, Warren R. Screening for cervical cancer: a systematic review and meta-analysis. Syst Rev. 2013;2:35. 4. Koh WJ, Abu-Rustum NR, Bean S, Bradley K, Campos SM, Cho KR, Chon
HS, Chu C, Clark R, Cohn D, Crispens MA, Damast S. Cervical cancer, ver-sion 3.2019, NCCN clinical practice guidelines in oncology. J Natl Compr Canc Netw. 2019;17:64–84.
5. Gao J, Yu H, Guo W, Kong Y, Gu L, Li Q, Yang S, Zhang Y, Wang Y. The anticancer effects of ferulic acid is associated with induction of cell cycle arrest and autophagy in cervical cancer cells. Cancer Cell Int. 2018;18:102. 6. Song XL, Zhang YJ, Wang XF, Zhang WJ, Wang Z, Zhang F, Zhang YJ, Lu
JH, Mei JW, Hu YP, Chen L, Li HF, Ye YY, Liu YB. Casticin induces apoptosis and G0/G1 cell cycle arrest in gallbladder cancer cells. Cancer Cell Int. 2017;17:9.
7. Boukes GJ, van de Venter M, Boukes GJ. The apoptotic and autophagic properties of two natural occurring prodrugs, hyperoside and hypoxoside, against pancreatic cancer cell lines. Biomed Pharmacother. 2016;83:617–26.
8. Zhang N, Ying MD, Wu YP, Zhou ZH, Ye ZM, Li H, Lin DS. Hyperoside, a flavonoidcompound, inhibits proliferation and stimulates osteogenic dif-ferentiation of human osteosarcoma cells. PLoS ONE. 2014;9:98973. 9. Liu YH, Liu GH, Mei JJ, Wang J. The preventive effects of hyperoside on lung cancer in vitro by inducing apoptosis and inhibiting proliferation through Caspase-3 and P53 signaling pathway. Biomed Pharmacother. 2016;83:381–91.
10. Lü P. Inhibitory effects of hyperoside on lung cancer by inducing apop-tosis and suppressing inflammatory response via caspase-3 and NF-κB signaling pathway. Biomed Pharmacother. 2016;82:216–25.
11. Li FR, Yu FX, Yao ST. Hyperin extracted from Man-churian rhododendron leaf induces apoptosis in human endome-trial cancer cells through a mitochondrial pathway. Asian Pac J Cancer Prev. 2012;13:3653–6. 12. Harrow J, Frankish A, Gonzalez JM, Tapanari E, Diekhans M, Kokocinski
F, Aken BL, Barrell D, Zadissa A, Searle S, et al. GENCODE: the reference human genome annotation for The ENCODE Project. Genome Res. 2012;22(9):1760–74.
13. Nikolayeva O, Robinson MD. edgeR for differential RNA-seq and ChIP-seq analysis: an application to stem cell biology. Methods Mol Biol. 2014;1150:45–79.
14. Robinson MD, McCarthy DJ, Smyth GK. edgeR: a Bioconductor package for differential expression analysis of digital gene expression data. Bioin-formatics. 2010;26:139–40.
15. Ritchie ME, Phipson B, Wu D, Hu Y, Law CW, Shi W, Smyth GK. limma pow-ers differential expression analyses for RNA-sequencing and microarray studies. Nucleic Acids Res. 2015;43:e47.
16. Kanehisa M. KEGG: kyoto encyclopedia of genes and genomes. Nucleic Acids Res. 2000;28:27–30.
17. Ashburner M, Ball CA, Blake JA, Botstein D, Butler H, Cherry JM, Davis AP, Dolinski K, Dwight SS, Eppig JT, Harris MA, Ashburner M, Ball CA, Blake JA, et al. Gene ontology: tool for the unification of biology. The Gene Ontol-ogy Consortium. Nat Genet. 2000;25:25–9.
18. Huang DW, Sherman BT, Lempicki RA. Systematic and integrative analysis of large gene lists using DAVID bioinformatics resources. Nat Protoc. 2008;4:44–57.
19. Szklarczyk D, Franceschini A, Wyder S, Forslund K, Heller D, Huerta-Cepas J, Simonovic M, Roth A, Santos A, Tsafou KP. STRING v10: protein-protein interaction networks, integrated over the tree of life. Nucleic Acids Res. 2015;43:447–52.
20. Shannon P, Markiel A, Ozier O, Baliga NS, Wang JT, Ramage D, Amin N, Schwikowski B, Ideker T. Cytoscape: a software environment for integrated models of biomolecular interaction networks. Genome Res. 2003;13:2498–504.
21. Tang Y, Li M, Wang J, Pan Y, Wu FX. CytoNCA: a cytoscape plugin for cen-trality analysis and evaluation of protein interaction networks. Biosystems. 2015;127:67–72.
22. Saito R, Smoot ME, Ono K, Ruscheinski J, Wang PL, Lotia S, Pico AR, Bader GD, Ideker T. A travel guide to cytoscape plugins. Nat Methods. 2012;9(11):1069–76.
23. Yu G, Wang LG, Han Y, He QY. clusterProfiler: an R package for comparing biological themes among gene clusters. OMICS. 2012;16:284–7. 24. Han H, Cho JW, Lee S, Yun A, Kim H, Bae D, Yang S, Kim CY, Lee M, Kim
E, Lee S, Kang B, Jeong D, Kim Y, Jeon HN, Jung H. TRRUST: TRRUST v2: an expanded reference database of human and mouse transcriptional regulatory interactions. Nucleic Acids Res. 2018;46(D1):D380–6. 25. Tyner C, Barber GP, Casper J, Clawson H, Diekhans M, Eisenhart C, Fischer
CM, Gibson D, Gonzalez JN, Guruvadoo L. The UCSC genome browser database: 2017 update. Nucleic Acids Res. 2017;45:D626–34. 26. Yang Y, Tantai J, Sun Y, Zhong C, Li Z. Effect of hyperoside on the
apop-tosis of A549 human nonsmall cell lung cancer cells and the underlying mechanism. Mol Med Rep. 2017;16:6483–8.
27. Kim DH, Wirtz D. Predicting how cells spread and migrate: focal adhesion size does matter. Cell Adh Migr. 2013;7:293–6.
28. Martin GS. Cell signaling and cancer. Cancer Cell. 2003;4:167–74. 29. Misra P, Viswakarma N, Reddy JK. Peroxisome proliferator-activated
receptor-α signaling in hepatocarcinogenesis. Subcell Biochem. 2013;69:77–99.
30. Xiao S, Zhou Y, Yi W, Luo G, Jiang B, Tian Q, Li Y, Xue M. Fra-1 is down-regulated in cervical cancer tissues and promotes cervical cancer cell apoptosis by p53 signaling pathway in vitro. Int J Oncol. 2015;46:1677–84. 31. Gründker C, Emons G. The role of gonadotropin-releasing hormone in
cancer cell proliferation and metastasis. Front Endocrinol. 2017;8:187. 32. Imai A, Horibe S, Takagi A, Ohno T, Tamaya T. Frequent expression of Fas in
gonadotropin-releasing hormone receptor-bearing tumors. Eur J Obstet Gynecol Reprod Biol. 1997;74:73–8.
33. Green DR. Cancer and apoptosis: who is built to last? Cancer Cell. 2017;31:2–4.
34. Caudron-Herger M. Mitochondrial mutations in human cancer: curation of translation. RNA Biol. 2018;15:62–9.
35. Pelletier J, Thomas G, Volarević S. Ribosome biogenesis in cancer: new players and therapeutic avenues. Nat Rev Cancer. 2018;18:51–63. 36. Rhee JK, Lee S, Park WY, Kim YH, Kim TM. Allelic imbalance of somatic
mutations in cancer genomes and transcriptomes. Sci Rep. 2017;7:1653. 37. Rosario SR, Long MD, Affronti HC, Rowsam AM, Eng KH, Smiraglia DJ.
Pan-cancer analysis of transcriptional metabolic dysregulation using The Cancer Genome Atlas. Nat Commun. 2018;9:5330.
38. Dang CV. MYC on the path to cancer. Cell. 2012;149:22–35.
39. Cui F, Hou J, Huang C, Sun X, Zeng Y, Cheng H, Wang H, Li C. C-Myc regu-lates radiation-induced G2/M cell cycle arrest and cell death in human cervical cancer cells. J Obstet Gynaecol Res. 2017;43:729–35.
40. Liao LM, Sun XY, Liu AW, Wu JB, Cheng XL, Lin JX, Zheng M, Huang L. Low expression of long noncoding XLOC_010588 indicates a poor prognosis and promotes proliferation through upregulation of c-Myc in cervical cancer. Gynecol Oncol. 2014;133:616–23.
41. Ji W, Lou W, Hong Z, Qiu L, Di W. Genomic amplification of HPV, h-TERC and c-MYC in liquid-based cytological specimens for screening of cervical intraepithelial neoplasia and cancer. Oncol Lett. 2019;17:2099–106. 42. Alves Rde C, Meurer RT. MYC amplification is associated with poor
sur-vival in small cell lung cancer: a chromogenic in situ hybridization study. J Cancer Res Clin Oncol. 2014;140:2021–5.
•fast, convenient online submission •
thorough peer review by experienced researchers in your field • rapid publication on acceptance
• support for research data, including large and complex data types •
gold Open Access which fosters wider collaboration and increased citations maximum visibility for your research: over 100M website views per year •
At BMC, research is always in progress.
Learn more biomedcentral.com/submissions
Ready to submit your research? Choose BMC and benefit from:
44. Shen Y, Li X, Dong D, Zhang B, Xue Y, Shang P. Transferrin receptor 1 in cancer: a new sight for cancer therapy. Am J Cancer Res. 2018;8:916–31. 45. Xu X, Liu T, Wu J, Wang Y, Hong Y, Zhou H. Transferrin receptor-involved
HIF-1 signaling pathway in cervical cancer. Cancer Gene Ther. 2019. https
://doi.org/10.1038/s4141 7-019-0078-x.
Publisher’s Note