R E S E A R C H A R T I C L E
Open Access
Long noncoding RNA expression profile in
HLE B-3 cells during TGF-
β
2
-induced
epithelial-mesenchymal transition
Bingyu Zhang
1, Yang Chen
1, Meiyuan Qiu
2and Zhixiang Ding
2*Abstract
Background:Recent evidence has shown that long noncoding RNAs (lncRNAs) are involved in the process of epithelial-mesenchymal transition (EMT). However, little research has focused on the expression profile of lncRNAs during EMT in human lens epithelial cells (LECs) and their functions have not yet been described.
Methods:Dysregulated lncRNAs and mRNAs in normal human lens epithelial B-3(HLE B-3) cells and during transforming growth factorβ2(TGF-β2)-induced EMT were analyzed via lncRNA microarray. Gene Ontology (GO) and Kyoto Encyclopedia of Genes and Genomes (KEGG) Pathway analyses of differentially expressed mRNAs were performed to identify their functions and pathologic pathways. Six candidate lncRNAs were validated via quantitative real-time reverse transcription polymerase chain reaction(qRT-PCR) to confirm the microarray data. Results:A total of 775 lncRNAs (325 up-regulated and 450 down-regulated) and 935 mRNAs (329 up-regulated and 606 down-regulated) were differentially expressed in HLE B-3 cells during TGF-β2-induced EMT compared to normal HLE B-3 cells. GO and KEGG Pathway analyses indicated the functions of differentially expressed mRNAs in the TGF-β2-induced EMT in HLE B-3 cells. qRT-PCR confirmed the trends indicated in microarray analysis for all 6 candidate lncRNAs. Conclusion:Our study lays the foundation for future research in lncRNAs related to EMT in HLE B-3 cells and could provide new avenues for the prevention and treatment of posterior capsule opacification (PCO).
Keywords:LncRNA, Microarray, HLE B-3 cells, Epithelial-mesenchymal transition, Posterior capsule opacification
Background
Cataracts are the leading cause of blindness, and account for 51% of blindness, about 20 million people, and 33% of visual impairment worldwide, according to the latest assessment (2010) [1]. Surgery is an effective treatment for cataracts, however, complications can arise [2]. Posterior capsule opacification (PCO) is the most common complication after cataract surgery [3]. The residual lens epithelial cells (LECs) in the anterior capsule after cataract surgery, over proliferate, and migrate to the posterior capsule, and then epithelial-mesenchymal transition (EMT) takes place. This dynamic process is the main mechanism of PCO [4–6]. EMT is an abnormal differenti-ation of epithelioid cells to myofibroblast cells and is
central to the development of PCO [7]. Inhibition of EMT has emerged as an option for treating PCO.
Transforming growth factor β2 (TGF-β2) is a signaling
molecule, that plays a crucial role in activating and promot-ing EMT in LECs. Recent studies have shown that TGF-β2
can induce EMT in LECs through the Smads pathway, PI3K/Akt pathway, and other pathways [8, 9]. TGF-β2
-in-duced EMT is a proper model for studying PCO [10]. Long noncoding RNAs (lncRNAs) are transcripts of more than 200 nucleotides, that do not have the ability to encode proteins, but participate in transcriptional, post-transcriptional and epigenetic regulation of gene expres-sion [11, 12]. The expresexpres-sion, mechanism, and function of lncRNAs have attracted attention in recent years [13]. However, it’s not clear how lncRNAs are related to the TGF-β2-induced EMT in LECs.
To understand the functions of lncRNAs in TGF-β2
-induced EMT in LECs, we performed lncRNA and
* Correspondence:[email protected]
2Department of Ophthalmology, Guilin Medical University Affiliated Hospital, Guangxi Zhuang Autonomous Region, Guilin 541001, China
Full list of author information is available at the end of the article
mRNA microarray analysis in normal LECs and those in TGF-β2-induced EMT. Gene Ontology (GO) analysis
[14, 15] and Kyoto Encyclopedia of Genes and Genomes (KEGG) pathway analysis [16, 17] were performed to identify the functions of differentially expressed genes. The results of our study indicate that dysregulated ex-pression of lncRNAs may influence the development and progression of EMT in LECs and that studying these lncRNAs may introduce new avenues for the prevention and treatment of PCO.
Methods
Cell culture and treatment
The human lens epithelial B-3 (HLE B-3) cell line, a type of LEC, was purchased from the Institute of Biochemistry and Cell Biology, SIBS, CAS (Shanghai, China). It was cultured in Dulbecco’s modified Eagle’s medium (Gibco, GranIsland, NY, USA) supplemented with 15% fetal bo-vine serum (Gemini, West Sacramento, CA, USA). Cells were maintained in humidified air with 5% CO2at 37 °C
before use. For further experiments, cells were trypsinized and seeded in 6 wells plates. When cell cultures reached 70% confluence, 3 wells of cells were stimulated with 10 ng/ml recombinant human TGF-β2 (Peprotech, Inc.,
Rocky Hill, NJ, USA) for 24 h, while the other 3 wells of cells were incubated in DMEM for 24 h. Following treat-ment, phase-contrast micrographs were used to observe morphology change of cells. Then the cells were collected for quantitative real-time reverse transcription polymerase chain reaction (qRT-PCR), western blot analysis, and im-munofluorescence assay.
qRT-PCR of cells
Total RNA was extracted using TRIZOL Reagent (Cat#15596-018,Life Technologies, Carlsbad, CA, US), and then reverse transcribed using Prime Script RT Master Mix (TaKaRa, Dalian, China) according to the manufacturer’s instructions. qRT-PCR was performed using SYBR Green PCR Master Mix (ABI Applied Biosystems, Foster City, CA, USA) in the ABI 7900HT sequence detection system (ABI Applied Biosystems, Foster City, CA, USA) following the manufacturer’s instructions, and beta-actin was used as an internal control. All the genes were amplified in separate wells in triplicate. The following primer pairs were used:
E-cadherin (F 5′- AGCAGAACTAAACACACGGGG -3′, R
5′- ACCCA CCTCTAAGGCCATCT -3′), vimentin (F 5′
-GACGCCATCAACACCG AGTT-3′, R 5′- GTTTGTCG
TTGGTTAGCTGGT -3′),α-SMA (F 5′- GTGTTGCCCC
TGAAGAGCAT -3′, R 5′- GCTGGGACATTGAAAGT
CT CA -3′), and beta-actin (F 5′- CTGGAACGGTGA
AGGTGA CA -3′, R 5′- CGGCCACATTGTGAACTTTG
-3′). Gene expression was calculated using the 2-ΔΔCT method [18].
Western blot
The cells were collected and lysed in lysis buffer on ice, and the proteins were quantified using a Pierce BCA Protein Assay kit (Thermos Fisher Scientific, Inc., Waltham, MA, USA). Cell lysates were separated by 8-12% sodium dodecyl sulfate polyacrylamide gel electro-phoresis, and proteins were transferred to polyvinylidene difluoride membranes. The membranes were subsequently incubated with the following primary antibodies overnight at 4 °C: E-cadherin (1:1000; cat. no. 3195; Cell Signaling Technology, Inc.), α-SMA (1:1000; cat. no. 4691; Cell Signaling Technology, Inc.), and vimentin (1:1000; cat. no. 5741; Cell Signaling Technology, Inc.). The mem-branes were washed three times with TBS/T and then incubated for 1 h in IRDye®680RD goat anti-rabbit immunoglobulin G (H + L) diluted at 1:5000 in TBST. Protein levels were visualized and quantified using the LI-COR Odyssey scanner and software (LI-COR Biosciences).
Immunofluorescence assay
After specific treatment, HLE B-3 cells were fixed with ice-cold methanol for 10 min. After washed with PBS for three times, non-specific binding sites were blocked with 4% bovine serum albumin for 30 min at room temperature. Cells were incubated with the primary anti-bodies (E-cadherin, 1:100; cat. no. 3195; Cell Signaling Technology, Inc. α-SMA, 1:100; cat. no. 4691; Cell Signaling Technology, Inc. vimentin, 1:100; cat. no. 5741; Cell Signaling Technology, Inc.) overnight at 4 °C, and then incubated with the FITC-conjugated secondary antibody for 1 h at room temperature. After counterstained with 4,6-diamidino-2-phenylin-dole (DAPI) for 3 min, these cells were subsequently observed under a confocal microscope(Carl Zeiss, LSM710, Jena, Germany).
Microarray
The microarray (SBC Human lncRNA microarray v6.0, Shanghai Biotechnology Corporation, Shanghai, China) used in this study detects approximately 77,103 lncRNAs and 18,853 coding transcripts. The lncRNAs were carefully constructed using the most highly respected public tran-scriptome databases including Ensembl (http://www.ensem-bl.org/index.html), LNCipedia (http://www.lncipedia.org/), Lncrnadb (http://lncrnadb.org/), Noncoder (http://www.no ncode.org/), and UCSC (http://genome.ucsc.edu/index. html). 6 sets of microarray assay were done, including 3 for the control group, and 3 for the TGF-β2 group.
RNA extraction
integrity number was calculated using an Agilent Bioanaly-zer 2100 (Agilent Technologies, Santa Clara, CA, US). Qualified total RNA was further purified via an RNeasy micro kit (cat. No. 74004, QIAGEN, GmBH, Germany) and RNase-Free DNase Set (cat. No. 79254, QIAGEN, GmBH, Germany).
RNA labeling and array hybridization
Total RNA was amplified and labeled using a Low Input Quick Amp WT Labeling Kit (cat. no. 5190-2943, Agilent Technologies, Santa Clara, CA, US), according to the manufacturer’s instructions. Labeled cRNAs were purified using an RNeasy mini kit (cat. no. 74106, QIAGEN, GmBH, Germany).
Each slide was hybridized with 1.65μg Cy3-labeled cRNA using a Gene Expression Hybridization Kit (cat. no. 5188-5242, Agilent Technologies, Santa Clara, CA, US) in a Hybridization Oven (cat. no. G2545A, Agilent Technolo-gies, Santa Clara, CA, US). After 17 h of hybridization, slides were washed in staining dishes (cat. no. 121, Thermos Shandon, Waltham, MA, US) with a Gene Expression Wash Buffer Kit (cat. no. 5188-5327, Agilent Technologies, Santa Clara, CA, US).
Data analysis
Slides were scanned with an Agilent Microarray Scanner (cat. no. G2565CA, Agilent Technologies, Santa Clara, CA, US). Data were extracted with Feature Extraction software v10.7 (Agilent Technologies, Santa Clara, CA, US). Raw data were normalized using the Quantile
algorithm, GeneSpring software v12.6.1 (Agilent
Technologies, Santa Clara, CA, US). Fold Change filtering and Student’s t test were used to identify differentially
expressed lncRNAs and mRNAs (fold change ≥2.0,
P< 0.05).
Gene function analysis
To identify the functions of lncRNAs, target genes of differentially expressed lncRNAs were predicted via cis- or trans-regulatory effects. GO analysis was performed to analyze the functions of differentially expressed mRNAs by using the Database for Annotation, Visualization, and Inte-grated Discovery (http://david.abcc.ncifcrf.gov/) [14, 15]. Pathway analysis was used to determine the significant bio-logical pathways of these differentially expressed mRNAs according to KEGG, (http://www.genome.jp/eg/) [16, 17]. The threshold of significance was defined by the P-value (recommendedP< 0.05).
qRT-PCR validation
qRT-PCR was used to validate the microarray data. The method was the same as that described in section "qRT-PCR of cells". The following primer pairs were
used: NR-015410 (F 5′- CTGTCTAATTTTCCA
GAGCCCCT -3′, R 5′- GTCATCTCTCCCCCA CAT
ACC -3′), ENST00000618591 (F 5′- GGGAGAGCA
TTCTTCCAG GT -3′, R 5′-
GGACACTGTGAACGGA-GACA -3′), ENST00000512323 (F 5′- ATCTGCAC
TGGTGTGAGGTTT -3′, R 5′- GTACTGCTCTTCC
TGGTGCTG -3′), ENST00000528717 (F 5′- GTTT
CTTGGAATGTGAAAGTCG -3′, R 5′- CCATAGGCA
GTAGTAGCCC AAC -3′), lnc-PF4-1:1 (F 5′- AAC
TGCCTTGCCAGTGCTT -3′, R 5′- A GGGGACTT
CACGTTCACAC -3′), NR-034138 (F 5′- TTGGAA
GAAT CCTGGAAGCA -3′, R 5′- CAGAAGAAAGA
GACCCTCATGG -3′), and beta-actin (F 5′- CTGG
AACGGTGAAGGTGACA -3′, R 5′- CGGCCA CATT
GTGAACTTTG -3′). Gene expression was calculated using the 2-ΔΔCTmethod.
Statistical methods
All statistical data were analyzed using SPSS software v18.0 s (SPSS Inc., Chicago, IL, USA). The threshold value we used to screen differentially expressed lncRNAs and mRNAs was a fold change ≥2.0 (P < 0.05). LncRNAs and mRNAs expressed differentially in the TGF-β2
group compared to the control group were analyzed using Student’s t tests.P< 0.05 was considered statistically significant. The false discovery rate was calculated to correct the P-value.
Results
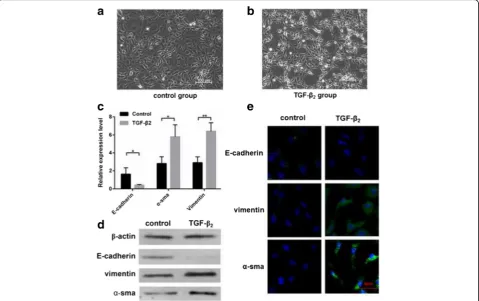
QRT-PCR/Western blot/Immunofluorescence of cells Phase-contrast micrographs showed, after stimulated with 10 ng/ml TGF-β2, cells were transformed from
single polygonal to long and spindle-shaped (Fig. 1).
To confirm EMT in TGF-β2 group, we detected 3
typical EMT-related biomarkers including E-cadherin,
α-SMA, and vimentin [19] by qRT-PCR, Western
blot, and immunofluorescence. All experiments
showed that E-cadherin was reduced, while α-SMA
and vimentin expression was increased (Fig. 1c-e). In
conclusion, HLE B-3 cells in TGF-β2 group were
undergoing EMT.
Differentially expressed lncRNAs and mRNAs
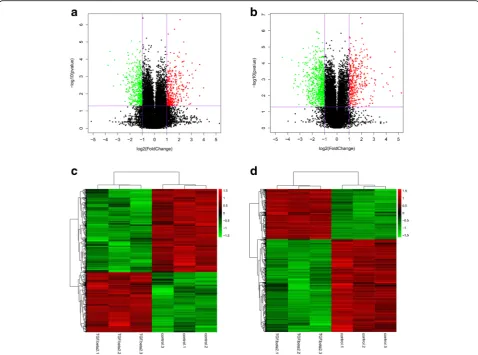
To screen the differentially expressed lncRNAs and mRNAs with statistical significance (fold change ≥2.0, P < 0.05) between TGF-β2group and control group,
vol-cano plots were constructed (Fig. 2a, b). Furthermore, the lncRNA and mRNA expression patterns across the samples were distinguishable in the heat map generated by hierarch-ical clustering (Fig. 2c, d).
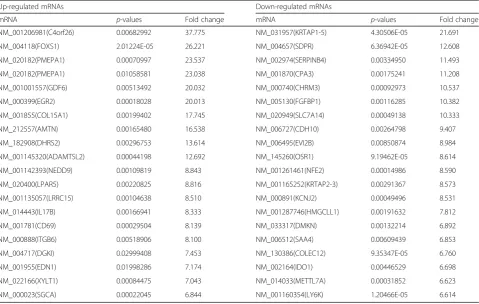
groups are listed in Table 1. Lnc-PMEPA1-2:1 (fold change: 15.830) was the most significantly upregulated lncRNA, and NR-033931 (fold change: 13.756) was the most significantly downregulated lncRNA. Down-regulated lncRNAs were found to be more common than upregulated lncRNAs in these microarray data.
Using the same criteria for lncRNAs, we identified 935 mRNAs that were differentially expressed (fold change ≥2.0, P < 0.05), including 329 upregulated mRNAs and 606 downregulated mRNAs. The top 20
upregulated and top 20 downregulated mRNAs
between the two groups are listed in Table 2. C4orf26 (fold change: 37.775) was the most significantly upregulated mRNA, and KRTAP1-5 (fold change: 21.691) was the most significantly downregulated mRNA.
LncRNA target prediction
To identify the potential function of differentially expressed lncRNAs, we predicted the target genes by target prediction programs. 565 lncRNAs had cis target genes, and 213 lncRNAs had trans genes.
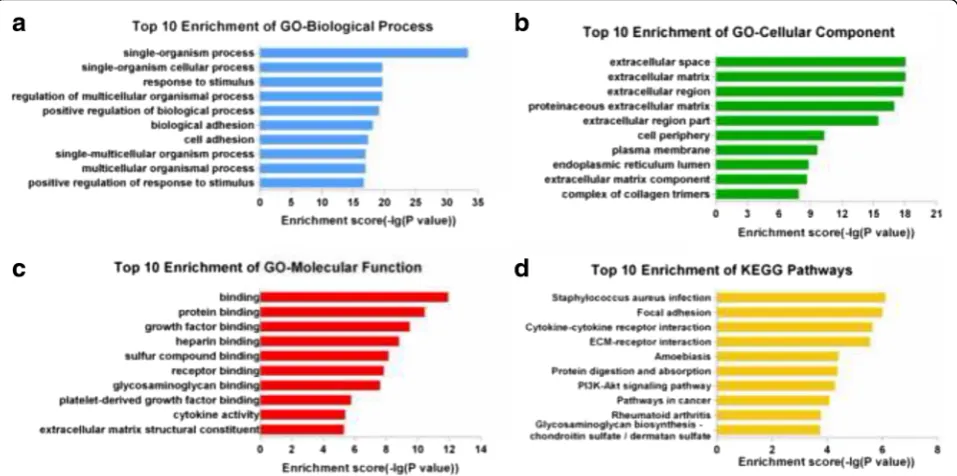
GO and KEGG pathway analysis of differentially expressed mRNAs
To determine the potential roles of differentially expressed lncRNAs, GO analysis and KEGG pathway analysis were applied to the differentially expressed mRNAs. The GO categories comprised 3 structured networks: biological processes, cellular components and molecular function. We found the most enriched GO terms associated with differentially expressed mRNAs were “single-organism process” (biological process) (Fig. 3a), “extracellular space” (cellular com-ponent) (Fig. 3b), and “binding” (molecular function) (Fig. 3c).
KEGG Pathway analysis indicated that 36 pathways were significantly enriched among the differentially expressed mRNAs (P < 0.05) (Fig. 3d). The most enriched pathway was“Staphylococcus aureusinfection”, which was associated with 13 differentially expressed genes. Many of these pathways were linked to EMT, such as the PI3K-Akt signaling pathway (associated with 32 genes), TGF-β signaling pathway (associated with 11 genes), ECM-receptor interaction (associated with 15 Fig. 1TGF-β2group cells compared to control group cells. Phase-contrast micrographs were used to observe cells in the control group (a) and
TGF-β2group (b). The single polygonal cells changed into long, spindle-shaped cells.cTotal RNAs were extracted from the control group(n= 3)
and TGF-β2group(n= 3), qRT-PCRs were conducted to detect the expression of E-cadherin,α-SMA, and vimentin(*P< 0.05, **P< 0.01).dThe
proteins were collected from the control group(n= 3) and TGF-β2group(n= 3), western blot was conducted to detect the expression of
genes), regulation of actin cytoskeleton (associated with 17 genes), and cell adhesion molecules (associated with 15 genes).
qRT- PCR validation
To confirm the validity of the microarray data, we ran-domly selected 6 differentially expressed lncRNAs for qRT-PCR. These included 3 upregulated lncRNAs (NR-015410, ENST00000618591, and ENST00000512323) and 3 downregulated lncRNAs (ENST00000528717, lnc-PF4-1:1, NR-034138). qRT-PCR was carried out to confirm the expression of the selected lncRNAs in LECs
during TGF-β2-induced EMT. qRT-PCR showed the
same trend for the 6 lncRNAs that were shown in the microarray analysis (Fig. 4a). The changes were statisti-cally different for only 4 of the 6 lncRNAs (Fig. 4b). ENST00000618591 was upregulated, while ENST0000 0528717, lnc-PF4-1:1, and NR-034138 were downregu-lated (P< 0.05).
Discussion
LncRNAs are among the least well-understood of non-protein-coding RNAs. They were previously considered merely transcriptional “noise” [11] but have increasingly garnered attention in recent years. Newer studies have shown that lncRNAs are involved in EMT. For example, several lncRNAs can be involved in the regulation or acti-vation of the WNT signaling pathway in the Twist-induced EMT process [20]. H19 can promote pancreatic cancer metastasis by derepressing let-7’s suppression on its target HMGA2-mediated EMT [21]. However, to our knowledge, no previous study has focused on the micro-array expression profile of lncRNAs in LECs during EMT. Thus, we conducted the current study to assess the role of lncRNAs in the development and progression of EMT in LECs from the perspective of lncRNA.
In this study, we chose the HLE B-3 cell line. It is a primary cell line of LECs that is immortalized via infection with an adenovirus 12-SV40 virus, and can be used to Fig. 2Gene expression profile differences between the TGF-β2group compared to the control group. Volcano plots were used to distinguish the
differentially expressed lncRNAs (a) and mRNAs (b). The vertical lines correspond to 2.0-fold up and down and the horizontal line represents a
Table 1Top 20 differentially expressed lncRNAs in TGF-β2group compared to control group
Up-regulated lncRNAs Down-regulated lncRNAs
LncRNA Source p-values Fold change LncRNA Source p-values Fold change
lnc-PMEPA1-2:1 Lncipedia 0.00455517 15.830 NR_033931 RefSeq 0.00022164 13.756
ENST00000597865 GENCODE 0.00020187 12.737 ENST00000582120 GENCODE 0.00308787 12.854
lnc-ZNF737-1:1 Lncipedia 0.01317849 12.647 lnc-FAIM3-2:1 Lncipedia 3.51412E-05 12.313
lnc-PCK1-2:1 Lncipedia 0.00250698 12.061 ENST00000580242 GENCODE 0.00355059 10.021
lnc-RIOK2-5:1 Lncipedia 4.6625E-06 10.882 NR_110260 RefSeq 0.00718676 9.901
lnc-ABCA12-5:2 Lncipedia 0.00043109 10.147 ENST00000508352 GENCODE 0.00010915 9.486
lnc-SMAD5-7:1 Lncipedia 1.89988E-05 9.649 lnc-SIX3-3:1 Lncipedia 0.00093703 8.399
ENST00000558888 GENCODE 0.00121548 8.765 NR_033888 RefSeq 0.00173551 5.851
ENST00000606197 GENCODE 0.00469381 8.533 NR_033931 RefSeq 0.00080852 5.791
ENST00000591217 GENCODE 0.00195645 8.503 lnc-PSG6-3:1 Lncipedia 0.00369578 5.391
NR_125383 RefSeq 0.00016452 8.302 ENST00000562459 GENCODE 0.00108506 5.383
NR_033957 RefSeq 0.00071386 8.289 ENST00000513853 GENCODE 0.02789757 5.259
ENST00000540392 GENCODE 0.00051516 7.495 NR_110294 RefSeq 0.02014080 5.164
ENST00000603720 GENCODE 0.00085945 7.098 NR_038929 RefSeq 0.00114790 4.993
lnc-ABCA12-6:1 Lncipedia 0.00232021 7.083 NR_049793 RefSeq 0.00317515 4.978
ENST00000508884 GENCODE 0.00243957 6.931 NR_027995 RefSeq 0.00158735 4.929
ENST00000557900 GENCODE 0.00351377 6.719 lnc-PSG4-1:1 Lncipedia 0.00025116 4.855
ENST00000606197 GENCODE 0.01581059 6.615 ENST00000508352 GENCODE 0.00557057 4.814
NR_015410 RefSeq 0.00494265 6.552 ENST00000605586 GENCODE 0.00670910 4.800
NR_109998 RefSeq 0.00169954 6.531 lnc-ABCD3-1:2 Lncipedia 0.00791576 4.786
Table 2Top 20 differentially expressed mRNAs in TGF-β2group compared to control group
Up-regulated mRNAs Down-regulated mRNAs
mRNA p-values Fold change mRNA p-values Fold change
NM_001206981(C4orf26) 0.00682992 37.775 NM_031957(KRTAP1-5) 4.30506E-05 21.691
NM_004118(FOXS1) 2.01224E-05 26.221 NM_004657(SDPR) 6.36942E-05 12.608
NM_020182(PMEPA1) 0.00070997 23.537 NM_002974(SERPINB4) 0.00334950 11.493
NM_020182(PMEPA1) 0.01058581 23.038 NM_001870(CPA3) 0.00175241 11.208
NM_001001557(GDF6) 0.00513492 20.032 NM_000740(CHRM3) 0.00092973 10.537
NM_000399(EGR2) 0.00018028 20.013 NM_005130(FGFBP1) 0.00116285 10.382
NM_001855(COL15A1) 0.00199402 17.745 NM_020949(SLC7A14) 0.00049138 10.333
NM_212557(AMTN) 0.00165480 16.538 NM_006727(CDH10) 0.00264798 9.407
NM_182908(DHRS2) 0.00296753 13.614 NM_006495(EVI2B) 0.00850874 8.984
NM_001145320(ADAMTSL2) 0.00044198 12.692 NM_145260(OSR1) 9.19462E-05 8.614
NM_001142393(NEDD9) 0.00109819 8.843 NM_001261461(NFE2) 0.00014986 8.590
NM_020400(LPAR5) 0.00220825 8.816 NM_001165252(KRTAP2-3) 0.00291367 8.573
NM_001135057(LRRC15) 0.00104638 8.510 NM_000891(KCNJ2) 0.00049496 8.531
NM_014443(IL17B) 0.00166941 8.333 NM_001287746(HMGCLL1) 0.00191632 7.812
NM_001781(CD69) 0.00029504 8.139 NM_033317(DMKN) 0.00132214 6.892
NM_000888(ITGB6) 0.00518906 8.100 NM_006512(SAA4) 0.00609439 6.853
NM_004717(DGKI) 0.02999408 7.453 NM_130386(COLEC12) 9.35347E-05 6.760
NM_001955(EDN1) 0.01998286 7.174 NM_002164(IDO1) 0.00446529 6.698
NM_022166(XYLT1) 0.00084475 7.043 NM_014033(METTL7A) 0.00031852 6.623
investigate HLE physiology and cataracts [22]. We chose 3 typical biomarkers: E-cadherin, α-SMA, and vimentin to confirm EMT in LECs [19]. E-cadherin is the prototypical epithelial cell marker of EMT. It is expressed in epithelial cells, and its expression is decreased during EMT.
Vimentin and α-SMA are mesenchymal markers, and
their expression is increased during EMT [6, 7]. The re-sults of qRT- PCR, western blot and immunofluorescence suggested that the cells in the TGF-β2group were
under-going EMT.
The findings of our study indicate that lncRNAs play a potential role in the EMT pathogenesis of PCO. A total of
325 upregulated lncRNAs and 450 downregulated
lncRNAs were differentially expressed in the TGF-β2
group compared to the control group. Furthermore, we used GO and KEGG pathway analyses to identify potential functions of the differentially expressed mRNAs. GO ana-lysis revealed the dysregulation of 1165 mRNAs involved in biological processes, 72 mRNAs involved in cellular components, and 112 mRNAs involved in molecular func-tions. Many items were involved in critical processes in EMT, such as protein binding, growth factor binding, cell proliferation. KEGG Pathway analysis indicated that 36 pathways were significantly enriched, many of which are related to EMT, including the PI3K-Akt signaling pathway [8, 23], TGF-β signaling pathway, and ECM-receptor Fig. 3Enrichment analysis of GO terms and pathways for differentially expressed mRNAs. GO analysis according to 3 GO categories:abiological process,bcellular component, andcmolecular function.dPathway analysis based on the KEGG database
Fig. 4qRT-PCR validation of 6 differentially expressed lncRNAs.aComparison of fold change of lncRNAs between microarray and qRT-PCR results.
interaction [24, 25]. These results indicated the general functional roles of the differentially expressed lncRNAs and also confirmed the reliability of our microarray data.
Although huge numbers of lncRNAs have been found, the functions of most lncRNAs remain unknown. Previous reports have suggested that lncRNAs can guide gene expression either in cis (on neighboring genes) or in trans (on distantly located genes) manner [26, 27]. We can pre-dict the functions of lncRNA via the cis/trans genes. We chose the top 4 up and down lncRNAs to analyze. The upregulated lnc-PMEPA1-2:1 is a 361 bp sense-overlapping lncRNA and was predicted to have a cis target gene, prostate transmembrane protein, androgen-induced 1(PMEPA1), which is important in cancer development. PMEPA1 encodes a transmembrane protein that contains a Smad-interacting motif [28]. PMEPA1 expression is induced by androgens and TGF-β, and can suppress the androgen receptor and TGF-β signaling pathways by interacting with Smad proteins. In breast cancer cells, PMEPA1 could be upregulated by classical TGF-β/Smad signaling pathway, and silencing of PMEPA1 significantly could inhibit the migration ability of MDA-MB-231 cells and promoted the process of EMT. Previous studies also showed that PMEPA1 can regulate EMT in lung cancer cells by modulating the ROS and IRS-1 signaling pathways [28]. Lnc-PMEPA1-2:1 may regulate EMT in PCO by PMEPA1 via the signaling pathways. NR-033931, also known as linc01085, is a 1984 bp intergenic lncRNA, of which little is known. ENST00000597865 is a 520 bp antisense lncRNA, and have a cis genes Neurotro-phin 4(NTF4), which is a member of the nerve growth factor family of neurotrophins, that control survival and differentiation of mammalian neurons. Kim et al. reported that NTF4 receptor TrkB could induce EMT through activation of the JAK2/STAT3 pathway and PI3K/AKT pathway in breast cancer [29]. NTF4 may have the similar function in EMT of PCO. ENST00000582120 is a 673 bp sense lncRNA. It had a cis gene: collectin subfamily member 12 (COLEC12). COLEC12 is a scavenger receptor, a cell sur-face glycoprotein that displays several functions associated with host defense. According to the GO analysis, COLEC12 plays roles in biological process(single-organism process, response to stimulus, and positive regulation of biological process) and cellular component(extracellular region, cell periphery, and plasma membrane). ENST00000582120 may play roles in EMT via regulating COLEC12. Further researches are needed to confirm the functions of these differentially expressed lncRNAs and their potential target genes.
Despite these promising findings, the current study did have some limitations. First, the sample size in the micro-array analysis was small, as was the number of candidate lncRNAs, and these might limit the validity of the array results. Second, the results were not validated in animal or
tissue experiments. Moreover, more experiments should be performed in future work to confirm and illustrate the detailed functional roles of the dysregulated lncRNAs by using RNA interference approaches in vitro and in vivo.
Conclusions
In conclusion, this is the first report of microarray analysis of lncRNA and mRNA differential expression in LECs dur-ing TGF-β2-induced EMT compared to normal LECs. These
differentially expressed lncRNAs and mRNAs likely play im-portant roles in the development and progression of EMT in LECs. Our study lays the foundation for future research on lncRNAs related to EMT in LECs and could introduce new avenues for the prevention and treatment of PCO.
Abbreviations
EMT:Epithelial-mesenchymal transition; GO: Gene ontology; HLE B-3: Human lens epithelial B-3; KEGG: Kyoto Encyclopedia of Genes and Genomes; LECs: Lens epithelial cells; lncRNAs: Long noncoding RNAs; PCO: Posterior capsule opacification; qRT-PCR: Quantitative real-time reverse transcription polymerase chain reaction; TGF-β2: Transforming growth factorβ2
Acknowledgements
Not applicable.
Funding
This study was supported by Guangxi natural science foundation (No: 2015GXNSFAA139179), Guilin scientific research and technological development project(No:20,130,120-4), and Guangxi health appropriate technology research and development program (No: S201407-08).
Availability of data and materials
The microarray data discussed in this article have been deposited in National Center for Biotechnology Information (NCBI) Gene Expression Omnibus (GEO) and are accessible through GEO Series accession number GSE98225.
Authors’contributions
ZXD and MYQ were responsible for the conception and design of this study. BYZ and YC acquired the data. BYZ analyzed and interpreted the data, and drafted the manuscript. ZXD revised the manuscript critically for important intellectual content. All authors read and approved the final version of the manuscript.
Competing interests
The authors declare that they have no competing interests.
Consent for publication
Not applicable.
Ethics approval and consent to participate
Not applicable.
Publisher’s Note
Springer Nature remains neutral with regard to jurisdictional claims in published maps and institutional affiliations.
Author details
1
Received: 17 October 2016 Accepted: 8 May 2017
References
1. Global Data On Visual Impairments 2010. Geneva: World Health Organization; 2012.
2. Facts About Cataract. National Eye Institute: National Eye Institute, 2015. 3. Awasthi N, Guo S, Wagner BJ. Posterior capsular opacification a problem
reduced but not yet eradicated. Arch Ophthalmol. 2009;127:555–62. 4. Greenburg G, Hay ED. Epithelia suspended in collagen gels can lose polarity
and express characteristics of migrating mesenchymal cells. J Cell Biol. 1982; 95:333–9.
5. Wormstone IM. Posterior capsule opacification: a cell biological perspective. Exp Eye Res. 2002;74(3):337–47.
6. Wormstone IM, Wang L, Liu CS. Posterior capsule opacification. Exp Eye Res. 2009;88(2):257–69.
7. Raj SM, Vasavada AR, Johar SR, Vasavada VA, Vasavada VA. Post-Operative Capsular Opacifiation : A Review. Int J Biomed Sci. 2007;3(4):237–50. 8. Yao K, Ye PP, Tan J, Tang XJ, Shen T. X. C. Involvement of PI3K/Akt pathway
in TGF-beta2-mediated epithelial mesenchymal transition in human lens epithelial cells. Ophthalmic Res. 2008;40(2):69–76.
9. Saika S, Kono-Saika S, Ohnishi Y, Sato M, Muragaki Y, Ooshima A, et al. Smad3 signaling is required for epithelial-mesenchymal transition of lens epithelium after injury. Am J Pathol. 2004;164(2):651–63.
10. de Iongh RU, Wederell E, Lovicu FJ, McAvoy JW. Transforming growth factor-beta-induced epithelial-mesenchymal transition in the lens: a model for cataract formation. Cells Tissues Organs. 2005;179(1-2):43–55. 11. Ponting CP, Oliver PL, Reik W. Evolution and functions of long noncoding
RNAs. Cell. 2009;136(4):629–41.
12. Wilusz JE, Sunwoo H, Spector DL. Long noncoding RNAs: functional surprises from the RNA world. Genes Dev. 2009;23(13):1494–504. 13. Rinn JL, Chang HY. Genome regulation by long noncoding RNAs. Annu Rev
Biochem. 2013;81:145–66.
14. Ashburner M, Ball CA, Blake JA, Botstein D, Butler H, Cherry JM, et al. Gene ontology: tool for the unification of biology. The Gene Ontology Consortium. Nat Genet. 2000;25(1):25–9.
15. Gene Ontology C. The Gene Ontology (GO) project in 2006. Nucleic Acids Res. 2006;34(Database issue):D322–6.
16. Draghici S, Khatri P, Tarca AL, Amin K, Done A, Voichita C, et al. A systems biology approach for pathway level analysis. Genome Res. 2007;17(10):1537–45. 17. Kanehisa M, Goto S, Kawashima S, Okuno Y, Hattori M. The KEGG resource
for deciphering the genome. Nucleic Acids Res. 2004;32(Database issue): D277–80.
18. Livak KJ, Schmittgen TD. Analysis of relative gene expression data using real-time quantitative PCR and the 2(−Delta Delta C(T)) Method. Methods. 2001;25(4):402–8.
19. Zeisberg M, Neilson EG. Biomarkers for epithelial-mesenchymal transitions. J Clin Invest. 2009;119(6):1429–37.
20. Hu P, Yang J, Hou Y, Zhang H, Zeng Z, Zhao L, et al. LncRNA expression signatures of twist-induced epithelial-to-mesenchymal transition in MCF10A cells. Cell Signal. 2014;26(1):83–93.
21. Ma C, Nong K, Zhu H, Wang W, Huang X, Yuan Z, et al. H19 promotes pancreatic cancer metastasis by derepressing let-7’s suppression on its target HMGA2-mediated EMT. Tumour Biol. 2014;35(9):9163–9. 22. Andley UP, Rhim JS, Chylack LT Jr, Fleming TP. Propagation and
immortalization of human lens epithelial cells in culture. Invest Ophthalmol Vis Sci. 1994;35(7):3094–102.
23. Guo R, Meng Q, Guo H, Xiao L, Yang X, Cui Y, et al. TGF-β2 induces epithelial-mesenchymal transition in cultured human lens epithelial cells through activation of the PI3K/Akt/mTOR signaling pathway. Mol Med Rep. 2016;13(2):1105–10.
24. Meacock WR, Spalton DJ, Stanford MR. Role of cytokines in the pathogenesis of posterior capsule opacification. Br J Ophthalmol. 2000;84(3):332–6. 25. Saika S, Ohmi S, Kanagawa R, Tanaka S, Ohnishi Y, Ooshima A, et al. Lens
epithelial cell outgrowth and matrix formation on intraocular lenses in rabbit eyes. J Cataract Refract Surg. 1996;22(Suppl 1):835–40. 26. Roberts TC, Morris KV, Weinberg MS. Perspectives on the mechanism of
transcriptional regulation by long non-coding RNAs. Epigenetics. 2014;9(1):13–20. 27. Prensner JR, Chinnaiyan AM. The emergence of lncRNAs in cancer biology.
Cancer discovery. 2011;1(5):391–407.
28. Hu Y, He K, Wang D, Yuan X, Liu Y, Ji H, et al. TMEPAI regulates EMT in lung cancer cells by modulating the ROS and IRS-1 signaling pathways. Carcinogenesis. 2013;34(8):1764–72.
29 Kim MS, Lee WS, Jeong J, Kim SJ, Jin W. Induction of metastatic potential by TrkB via activation of IL6/JAK2/STAT3 and PI3K/AKT signaling in breast cancer. Oncotarget. 2015;6(37):40158–71.
• We accept pre-submission inquiries
• Our selector tool helps you to find the most relevant journal
• We provide round the clock customer support
• Convenient online submission
• Thorough peer review
• Inclusion in PubMed and all major indexing services
• Maximum visibility for your research Submit your manuscript at
www.biomedcentral.com/submit