Damage Detection in a Plate Structure based on FBG
sensing Technique under a Single-Mode Lamb Wave
https://doi.org/10.3991/ijoe.v14i07.8965
Cai Li !!"
Wuhan Donghu University,Wuhan, China
Huang Xiao
Wuhan University of Technology, Wuhan, China
Zuo Xiaoqiong
Wuhan Donghu University, Wuhan, China
Abstract—Lamb wave is widely acknowledged as one of the most encour-aging tools for damage identification in plate structures, and relevant research has been conducted intensively. However Lamb wave modes have different wave structure, frequency dispersion and attenuation characteristics, which are sensitivity to different types of damages and it is difficult to solve such engi-neering problems by conventional techniques. Although the single pattern de-tection method has been researched by piezoelectric wafers, there is little re-search about FBG sensing detection under single-mode ultrasonic Lamb wave technique currently. So this paper puts forward a single-mode Lamb wave tech-nique for crack detection based on Fiber Bragg Grating sensor, which is used to receive the waves in the plate. First of all, measuring principle of single-mode ultrasonic Lamb technique and demodulation principle of the FBG sensor are introduced. And simulation analysis in the acoustic field is devoted, whose re-sults lay the foundation for the damage detection in the plate. Then, the experi-mental system is built by a single-mode Lamb wave excitation, and the feasibil-ity of fiber Bragg grating sensors in single-mode excitation method is verified by experiments.
Keywords—Lamb Wave; Damage Detection; Fiber Bragg Grating(FBG)
1
Introduction
methods of the single mode Lamb wave. Su et al. arranged two sensors in the upper and lower surfaces of the plate like structure, and obtained a relatively single mode Lamb wave by enhancing a certain mode and weakening the other modes. They have used this method to detect the delamination in the isotropic laminates[4]. Clarke et al. studied a new type of piezoelectric sensor by adding the front liner matching layer and the backing layer respectively in the front and back of a circular piezoelectric chip to make the piezoelectric sensor capable of motivating a single modality at low frequencies [5]. Now there are many studies on signal extraction, such as Wang etc. obtained damage index of ultrasonic guided wave in each propagation path based on correlation analysis and the defect imaging map represented by probability values, and realized positioning and identification of artificial defects in the plate [6]. Most damage detection and localization methods that have been proposed are based upon comparing monitored signals to baselines recorded from the structure prior to initia-tion of damage. Michaels proposed a two-step process whereby damage is first de-tected and is then localized and characterized, taking into account any conditions other than damage that have changed the ultrasonic signals [7]. Xiaole Liu presented a new model with periodic potential to induce the adaptive model, by which the system parameters were simultaneously optimized. In order to eliminate interference to ob-tain more useful information, the signals were preprocessed by Hilbert transform and High-pass filter before being input to the adaptive system and the improved signal-to-noise ratio was set as the evaluation index [8]. Aldo Baccigalup investigated Huang Hilbert Transform for evaluating the instantaneous frequency evolution in non-linear systems by comparing the different traditional approaches. In order to evaluate its performance, the proposed approach had been firstly applied to a synthesized signal with known instantaneous amplitude and frequency evolution [9]. Irene Buj-Corral studied acoustic emission by comparing two methods to treat the sound signal emitted during the machining process: Fast Fourier Transform and Hilbert Huang Transform [10]. But most of these methods are based on the piezoelectric film to motivate and receive. The attempt of the fiber grating in the single mode scheme is still rare.
2
Excitation and reception principle
2.1 Excitation principle of Lamb wave
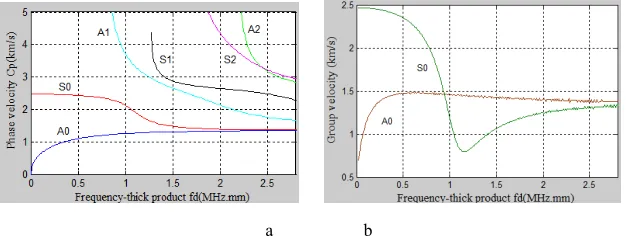
Lamb wave on the plate structure has many modal characteristics, containing at least two kinds, namely basic symmetric mode and basic antisymmetric mode. It can be seen from the figure 1, multimodal form will produce if the frequency is above the first order modal cutoff frequency, and affect the detection accuracy of lamb wave. So according to the dispersion property, we need select the reasonable incentive parame-ters and sensing element to reduce the modes, and improve detection accuracy of the lamb wave. The dispersion curves associated with the propagation of Lamb waves in the organic glass having the same mechanical and geometric properties of the test samples used in this study are presented in Fig. 1, in which the modes S0 and A0 at 0.5MHzmm are highlighted by blue curve and red curve respectively.
a b
Fig. 1. Dispersion curves of the organic glass plate a-phase velocity; b-group velocity
surface. The stress of each particle such as is shown in the formula (1) and the formu-la (2)[8] .
Fig. 2. Excitation principle diagram of double piezoelectric wafers
2
1
,
2
1 1 11
d
z
z
d
i
x
=
"
!
!
"
(1) 2 2 2 1 1 1 22
A
E
E
2
d
z
1
E
v
,
1
z
d
i
x
!
!
"
"
=
$
#
$
(2) Where
!
x1,!
x2 are the stress of the plate and PZT ;E
1,E
2 are the elasticmodu-lus of the plate and PZT respectively
v
2 is Poisson's ratio. And the strain betweenthe plate and the PZT produced by excitation signal is obtained as followed.
2 31
d
V
d
x=
!
(3) When the voltages are applied on the upper and lower of two piezoelectric chips to make simultaneous radial vibration, which can produce symmetric fluctuations by driving the particles on the plate. In this way, the Lamb mode S0 wave is generated. On the contrary, when the voltage is applied to make simultaneous reverse vibration, which can produce symmetric fluctuations in the opposition , and the Lamb mode A0 wave is obtained.2.2 Demodulation of the reception principle
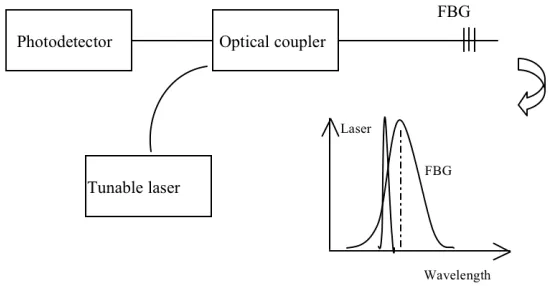
Sensing principle of FBG is based on the Bragg wavelength reflection or transmis-sion spectrum detection. In general, the speed range of fiber Bragg grating demodula-tion devices is 1kHz-4kHz, which do not enough to satisfy the high demodulademodula-tion speed for ultrasonic signals. So the fiber grating demodulation system need adopt new demodulation methods. The following demodulation system is one of these methods which can satisfy this condition, as shown in figure 2. The wavelength demodulation system for the FBG sensor is composed of a wavelength tunable laser, an optical coupler and a photodetector. The tunable laser as a light source inspires a beam of light to the FBG through an optical coupler. Then the reflected light from the FBG
propagates to the photodetector through the coupler. If the central wavelength of the laser beam is tuned to be a little shorter than that of the FBG at free strain, the power relationship between laser and FBG is shown in figure 3[8][9].
Fig. 3. The demodulation principle of FBG sensor
The optical intensity received by the photodetector is given as following:
!
"
" #
=
M
R
$
S
$
d
$
P
1 s(
)
(
)
(4)where Rs(!) is the reflectivity function of the FBG, S(!) is the spectrum function of the laser source, M1 is the efficiency for light energy utilization, which
can be regarded as constant if no energy loss. The reflection spectrum of the FBG sensor can be modeled as a Gaussian type to simplify the analysis according to the related model .And the laser beam can also be modeled as Gaussian Beam. So the optical power of photodetector can be derived as following:
]}
)
(
2
ln
4
exp[
)
(
{
2
ln
2
2 0 2 2 2 1 2 2 0 0 0 0 1!
!
!
!
!
!
!
!
"
#
+
#
$
$
%
#
+
#
#
#
=
S S S S sI
R
M
P
(5) where Rs0 is the maximum reflectivity,!
s is the center wavelength of theFBG,
"
!
s ,"
!
0is its spectral full width at half maximum.I
0 is the peak power,0
3
Simulation analysis
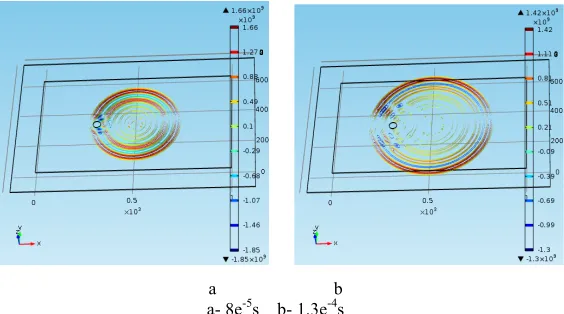
Sugarcane sowing According to the above analysis in part II, in order simplifies the calculation, we assume that one excitation is placed directly on the plate without the adhesive layers. First, a geometric model is built in COMSOL software, model size of the plate is 1000*600*5mm3(as shown in figure 4 and figure 5). The material
pa-rameters of the plate are specified: elastic modulus is 6.4 GPa , poisson coefficient is 0.3, density is 1190 g/cm3.In figure 4, one excitation signal is applied on ‘P’. Here we
use a modulation force directly instead of the piezoelectric excitation effect, whose center frequency is 100kHz, and the amplitudes is 100N. In this way, the calculation results can be obtained after the mesh processing, such as the acoustic field distribu-tion, from which we can observe the variation of the acoustic field at different time, such as 8e-5s, 1.3e-5s. In these moments wave packets have spread to damage hole,
where the interaction produces between them. From figure 4b,we can see that the hole is as the second source to launch.
a b a- 8e-5s b- 1.3e-4s
Fig. 4. The acoustic pressure field on at different time
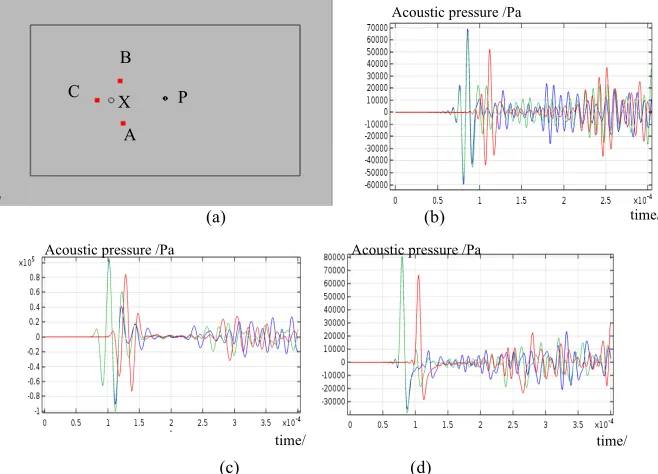
transmis-sion speed is 2500m/s, AP is 180mm, so it spends the longest time 0.18/2500=72us. This result is consistent with the simulation result, as shown in figure 5b, in which the arrival time of the first wave packet is 0.8*10-4s. Meanwhile, CP is 240mm, so it
spends the longest time 0.24/2500=96us, which is approximately consistent with the simulation result 1*10-4s. The distance XB is closer to the injury, which is far away
from point A. So the wave packet of point B reflected by the injury may be sub-merged in the direct wave packet. Overall, the simulation results(as shown in figure 5c,5d) show that the wave number of the modulation wave is more, the energy is stronger. Thus it is easy to cause the signal aliasing and is more difficult to further identify the damage signal. So we need to select the modulation wave number.
(a) (b)
(c) (d)
a- Monitoring point arrangement ; b-Three peak modulation wave with 100kHz; c-Three peak modulation wave with 50kHz; d-One peak modulation wave with 50kHz
Fig. 5. The acoustic pressure field under different incentives
4
Experiment based on FBG sensor
The Ultrasound strain on the metal plate is usually only a few microstrains, so the fiber grating demodulation system should satisfy the high demodulation speed to measure ultrasonic signals ensuring accuracy at the same time. In order to demon-strate high sensitivity of the cross modulation effect to the defects in a plate sample, we use adjustable laser edge filter demodulation as new demodulation system. Princi-ple diagram is shown in figure 6 (a), where piezoelectric wafers are used for the exci-tation, while FBG sensors are used for detection response. The tuning range of
tuna-B C
A
P
X
time/ Acoustic pressure /Pa
Acoustic pressure /Pa Acoustic pressure /Pa
ble laser light source with typical line width of 200 kHz is 1260 -1630 nm. And the object of study is organic glass plate whose dimension is 1000mm* 600mm *5mm, and incentive layout is shown in figure 6 (b).
(a) Principle diagram
(b) Incentive layout Fig. 6. xperimental equipment
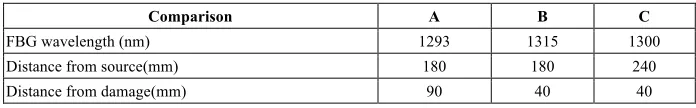
more than 100 kHz, so the length of FBG with 5 mm can satisfy with this condition. Due to the temperature influence, we keep temperature 20 degrees based on the tem-perature measurement during the experiment. In this way, it can eliminate the influ-ence of temperature factor. Due to the strain sensitivity of the optical fiber grating and the acoustic axis of the ultrasonic energy, we firstly study the basic characteristics of FBG sensors in ultrasonic excitation with different incentive parameters. On the basis of this, we can further study the response analysis of FBG under multi-excitation and subsequent damage assessment. The relevant parameters such as wavelength and position parameters of FBG sensors are as shown in table 1.
Table 1. Wavelength and position parameters of FBG sensors
Comparison A B C
FBG wavelength (nm) 1293 1315 1300
Distance from source(mm) 180 180 240
Distance from damage(mm) 90 40 40
4.1 Response analysis of FBG on different positions
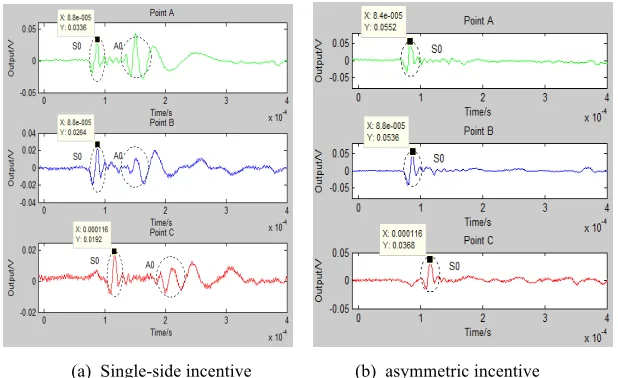
We know that under single excitation it will appear at least two modes of the wave packet, S0 and A0. Here, in order to facilitate the detection, the wave packet can be suppressed by inhibiting one of the modes allowing a single mode wave packet, as shown in figure 7, in which response waveforms of different points A, B, C in differ-ent excitation modes are compared. According to the simulation results, excitation source is used by half-peak modulated wave, whose frequency is 100 kHz and the voltage amplitude is 150 V(as shown in figure 8). Figure 7(a) is one-side incentive and figure 6b is asymmetric incentive. It can be seen from figure 7 that the peak times of the detection point A are basically same as that of the detection point B and the magnitudes are roughly equivalent. According to figure 7(b) and table 2, we can draw the conclusion that the waveform pattern of the symmetrical excitation is relatively simple, and the amplitude of the S0 model is significantly higher than that of single side excitation , which is nearly 2 times.
According to the frequency dispersion characteristic curve, we can get the speed parameters. When the excitation frequency is 100k and the thickness of the glass plate is 5mm, the frequency thick product parameter is 0.5MHz!mm. So the corresponding speed is respectively as follows:VS0=2349m / s, VA0=1474m / s. According to the
(a) Single-side incentive (b) asymmetric incentive Fig. 7. Response on different positions under different incentives
Table 2. Test amplitude of FBG sensors on different positions
Detection peak(mV) A B C
Single-side incentive 33.6 26.4 19.2
40.8 11.2 6.4
asymmetric incentive 55.2 53.6 36.8
Antisymmetry incentive 40.8 34.4 14.4
Table 3. Test time of FBG sensors on different positions
Detection
times Test Calcula-A B C
tion Error Test Calcula-tion Error Test Calcula-tion Error asymmetric
incentive 78 77 1% 82 77 6% 110 93 18%
Antisymmetry
incentive 128 122 5% 127 122 4% 170 150 13%
In the process of the experiment, the initial excitation signal has a delay time. So the experimental detection time is needed to subtract the delay time of the excitation source 6e-6s. After subtracting the delay time it can be used as the test time. By
excita-tion is higher than that of the single side excitaexcita-tion. So it is not suitable for testing point. In addition, point B is closer to the damage, so damage signals are likely to be submerged in the direct wave packet easily. This conclusion is in agreement with the simulation results. So next we mainly focus on point A to extract damage infor-mation.
4.2 Response analysis of FBG under different frequencies
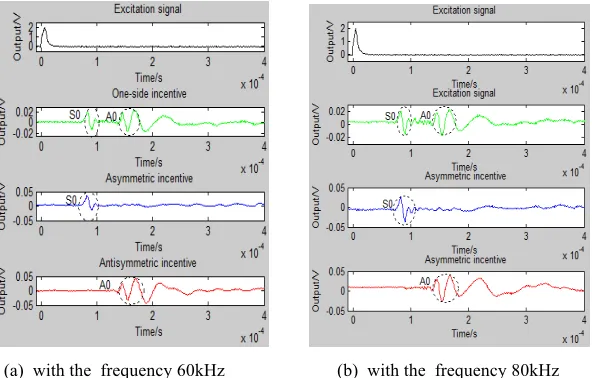
Figure 8 is the responses of the point A under different frequencies, such as 60kHz, 80kHz. Black curve indicates incentive, green curve represents the response under single incentive, blue curve represents the response under symmetric incentive, and red curve is for the antisymmetric excitation response.
(a) with the frequency 60kHz (b) with the frequency 80kHz Fig. 8. Response of detection point A at different frequencies
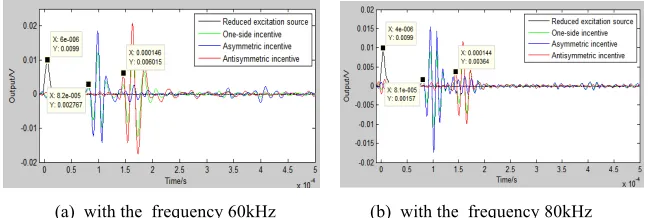
Figure 9 is responses of detection point A at different frequencies after filtering. According to the waveforms as shown in figure 8 and 9, under the antisymmetry in-centive with the frequency 60kHz or 80kHz , A0 mode and S0 mode have reflected wave packet , but these reflective waves reflected by the damage are very small. So it is appropriate to compare the relative changes. In this case, here S0 mode has better detection effect than A0 mode.
(a) with the frequency 60kHz (b) with the frequency 80kHz Fig. 9. Response at different frequencies after filtering
5
Conclusion
This work focuses on the single-mode ultrasonic Lamb wave technique for crack detection by FBG, which is combined the advantage of fiber grating sensing tech-nique. In this paper, taking the plate structure as the object, a new attempt by single-mode ultrasonic Lamb detection with FBG sensors has been investigated. First, sin-gle-mode ultrasonic Lamb technique and the strain characteristics of FBG sensors are introduced. Second, the simulation analysis of the ultrasonic Lamb wave signals are carried out and time domain simulation of the plate structure are performed, which reveal various ultrasonic Lamb wave signals on different detection positions. Third, the experimental system based on ultrasonic Lamb wave technique-fiber Bragg grat-ing detection is built and response analysis of FBG sensors under the different excita-tions is given. The results reveal an extremely efficient single-mode ultrasonic Lamb wave technique. And it shows that this single-mode ultrasonic Lamb wave technique-FBG sensing system is feasible and it is sensitive to crack damage by comparison of the signals in healthy area and damaged area.
6
Acknowledgment
This work is supported the following fund:
2017 The project of Hubei Province Natural Science Foundation for Youths (No.2017CFC890).
2017 the Science Research Project of Hubei Province Education Department (No.B2017298).
7
References
[1]Wilcox P D, Lowe M J S, Cawley P: The effect of dispersion on long-range inspection us-ing ultrasonic guided waves[J]. NDT&E International, 34 (1),1~9, (2001).
[2]Wieslaw Ostachowicz, PawelKudela, PawelMalinowski, TomaszWandowski: Damage lo-calisation in plate-like structures based on PZT sensors. Mechanical Systems and Signal Processing ,vol.23, 1805-1829, (2009). https://doi.org/10.1016/j.ymssp.2008.10.011
[3]Kim S B, Sohn H: Instantaneous reference-free crack detection based on polarization char-acteristics of piezoelectric materials[J]. Smart Materials and Structures,16(6): 2375~2387,(2007). https://doi.org/10.1088/0964-1726/16/6/042
[4]Su Z, Ye L: Selective generation of Lamb wave modes and their propagation characteris-tics in defective composite laminates[J]. Journal of Materials: Design and Applications, 218(2), 95~110, (2004). https://doi.org/10.1109/TUFFC.2009.1201
[5]Clarke T, Simonetti F, Rohklin S et al. Development of a low-frequency high purity A0 mode transducer for SHM applications[J]. IEEE Transactions on Ultrasonics, Ferroelec-trics, and Frequency Control,56(7), 1457~1468, (2009).
[6]Wang D, Ye L, Lu Y, et al: A damage diagnostic imaging algorithm based on the quantita-tive comparison of Lamb wave signals[J]. Smart Materials and structures, 19(6), 065008-1~12, (2010).
[7]Michaels J E: Detection, location and characterization of damage in plates with an in situ array of spatially distributed ultrasonic sensors[J]. Smart Materials and Structures, 17(3), 035035-1~15, (2008).
[8]Xiaole Liu, Houguang Liu, Jianhua Yang, Grzegorz Litak,Gang Cheng, Shuai Han: Im-proving the bearing fault diagnosis efficiency by the adaptive stochastic resonance in a new nonlinear system. Mechanical Systems and Signal Processing. 58-76,(2017).
https://doi.org/10.1016/j.ymssp.2017.04.006
[9]Aldo Baccigalupi, Annalisa Liccardo: The Huang Hilbert Transform for evaluating the in-stantaneous frequency evolution of transient signals in non-linear systems. Optik Interna-tional Journal for Light and Electron Optics. 3417-3422, (2016)..
[10]Irene Buj-Corral, Jesús Álvarez-Flórez, Alejandro Domínguez-Fernández: Acoustic emis-sion analysis for the detection of appropriate cutting operations in honing processes. Me-chanical Systems and Signal Processing. 873-885, (2018).
8
Authors
Cai Li (1980-),come from Wuhan, Hubei province. Ph.D.degree, the main
re-search direction for equipment detection and diagnosis.(e-mail: [email protected], affiliation: School of Mechanical and Electronic Engineering, Wuhan Donghu Uni-versity,Wuhan,430070, China).
Huang Xiao (1982-), come from Wuhan, Hubei province. Ph.D.degree, the main
research direction for fiber Bragg grating detection technology.(e-mail: [email protected], affiliation: School of Mechanical and Electronic Engineering, Wuhan University of Technology, Wuhan, 430070, China).
Zuo Xiaoqiong (1978-), come from Wuhan, Hubei province. master degree, the
main research direction for electrical engineering management.(e-mail: [email protected], affiliation: School of Mechanical and Electronic Engineering, Wuhan Donghu University, Wuhan, 430070, China).