R E S E A R C H
Open Access
Development and validation of RP-HPLC-PDA
method for the quantification of eugenol in
developed nanoemulsion gel and nanoparticles
Kannissery Pramod
1, Ura Kottil Ilyas
2, Yoonuskunju Thajudeenkoya Kamal
2, Sayeed Ahmad
2,
Shahid Hussain Ansari
2and Javed Ali
1*Abstract
Background:Eugenol is a potent phytochemical, and a plethora of delivery systems for this bioactive agent is being developed. Reversed-phase high-pressure liquid chromatography equipped with photodiode array detector (RP-HPLC-PDA) method is very useful in the quantification of the phytochemicals.
Methods:The RP-HPLC-PDA system with C18 reversed-phase column (250 × 4.6 mm, particle size 5μm) was used in this study. Acetonitrile and water in 1:1 (v/v) ratio was chosen as the mobile phase under a column temperature of 25°C. The detection wavelength was set at 280 nm with a flow rate of 1 mL/min. Method validation was performed according to the International Conference on Harmonization guidelines.
Results:HPLC method for the quantification of eugenol was successfully developed and validated. The method was validated in terms of linearity and range, accuracy, precision, specificity, robustness, detection limit, and quantitation limit.
Conclusions:The developed RP-HPLC-PDA could be successfully employed for the quantification of eugenol in nanoemulsion gel and nanoparticles.
Keywords:Accuracy; Precision; Specificity; Robustness; ICH guidelines
Background
A good number of novel delivery systems of eugenol (Chen et al. 2009; Gomes et al. 2011; Jadhav et al. 2004; Kriegel et al. 2010; Pokharkar et al. 2011) have been reported owing to its potent bioacitivity. Anti-inflammatory and anti-microbial actions are among other major pharmacological actions of eugenol (Pramod et al. 2010). Development of a suitable analytical method will be needed when eugenol is formulated in nanocarriers for targeted delivery.
Quantification of the pharmacologically active compo-nent in a dosage form is indispensable to the quality control of these systems. Quality control checks the suitability of a drug delivery system for the intended application. It serves as a marker for the consistency
and predictability of the performance of dosage forms (Levi et al. 1964). High-pressure liquid chromatography (HPLC) methods are widely reported for the quantitative estimation of bioactive phytochemicals, but to this day, no reports are available on reversed-phase HPLC equipped with photodiode array detector (RP-HPLC-PDA) methods for the quantification of eugenol in nano-structured delivery systems such as nanoemulsion gel and nanoparticles. Besides this, none of the methods are available for eugenol quantification from formulations where a high specificity is required to overcome the probable interference of the excipients.
Nanoemulsion gel and nanoparticles have been deve-loped as novel drug delivery systems of eugenol (Pramod et al. 2012, 2013). The major aim of the present work was to develop a RP-HPLC-PDA method for the quanti-tative estimation of eugenol in these drug delivery sys-tems for anti-inflammation and periodontal infection. * Correspondence:[email protected]
1Department of Pharmaceutics, Faculty of Pharmacy, Jamia Hamdard, Hamdard Nagar, New Delhi–110 062, India
Full list of author information is available at the end of the article
© Pramod et al.; licensee Springer. This is an open access article distributed under the terms of the Creative Commons Attribution License (http://creativecommons.org/licenses/by/2.0), which permits unrestricted use, distribution, and reproduction in any medium, provided the original work is properly cited.
Methods
Chemicals and reagents
Eugenol (pure) was purchased from Central Drug House (Delhi, India). Poly-ε-caprolactone (MW 14,000), chitosan, sodium alginate and Pluronic F-68 were purchased from Sigma-Aldrich Co. (MO, USA). Tween 80 and polyvinyl alcohol were purchased from Central Drug House (New Delhi, India). Carbopol 940 was a gift sample from Noveon Corporation (Cleveland, OH, USA). Tween 80 and triethanolamine were purchased from S D Fine-Chem Ltd. (Mumbai, India). Ethanol (99.9%) was purchased from Jiangsu Huax Co., Ltd. (Jiangsu, China). HPLC-grade water and acetonitrile were purchased from Merck (Mumbai, India).
Preparation of eugenol-loaded nanoemulsion gel and nanoparticles
Aqueous titration method was employed for the pre-paration of eugenol-loaded nanoemulsion. The formu-lated eugenol-loaded nanoemulsion was converted to nanoemulsion gel by dispersing 1% (w/w) Carbopol 940 in it. Tween 80 and ethanol were used as surfactant and co-surfactant, respectively. For Smix, a specific volume ratio of 4:1 (Tween 80/ethanol) was used (Pramod et al. 2012). For the preparation of the sample solution of nanoemulsion gel, an accurately weighed gel sample was taken in methanol, sonicated (Altrasonics, Mumbai, India) for 20 min, and filtered using a 0.2-μm syringe fil-ter (Axiva Sichem Biotech, New Delhi, India).
Solvent displacement method was employed for the preparation of eugenol-loaded nanoparticles (Reis et al. 2006). Polycaprolactone (encapsulating polymer) and eu-genol were dissolved in acetone (organic solvent phase) by mild heating. The solution of eugenol and poly-mer was injected dropwise into aqueous Pluronic F-68 (stabilizer) solution under magnetic stirring, and stirring was continued until complete evaporation of acetone oc-curred. Centrifugation of the suspension of nanoparticles thus obtained was carried out at 15,000 rpm for 1 h. The obtained nanoparticles were washed twice with dis-tilled water and then freeze-dried (Pramod et al. 2013). For the preparation of the sample solution from nano-particles, accurately weighed sample of dried nanoparti-cles was dissolved in 1 mL of acetone and then was added to 5 mL of methanol. Acetone was then evapo-rated. The sample was sonicated (Altrasonics, Mumbai, India) for 20 min, then was made up to 10 mL with methanol, and was filtered using a 0.2-μm syringe filter (Axiva Sichem Biotech, New Delhi, India) (Pramod et al. 2013).
HPLC instrumentation and chromatographic conditions
The HPLC method for the determination of eugenol was carried out on a Waters Alliance e2695 separating
module (Waters Co., MA, USA) using a photodiode array detector (Waters 2998) with autosampler and col-umn oven. The instrument was controlled by Empower 2 software (Europa Science, Ltd., Cambridge, UK) in-stalled with equipment for data collection and acquisition. Compounds were separated on a C18 reversed-phase col-umn (250 × 4.6 mm, particle size 5μm; Merck, Darmstadt, Germany) maintained at room temperature.
Mobile phase
Acetonitrile and water in the ratio of 1:1 (v/v) was chosen as the mobile phase.
Chromatographic system
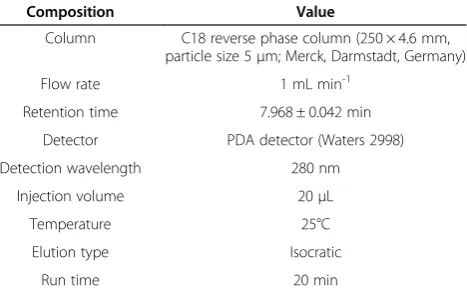
The chromatographic system is composed of the follow-ing (Table 1): Chromatographic conditions.
Preparation of the mobile phase
HPLC-grade water was mixed with HPLC-grade aceto-nitrile in the volume ratio of 1:1. The prepared mobile phase was then filtered through a 0.45-μm nylon filter and sonicated in an ultrasonic bath for 15 min.
Method validation
Linearity and range
A stock solution of eugenol (10 mg mL−1) was pre-pared in methanol. Standard calibration solutions (5 to 1,000μg mL−1) for the assessment of linearity were pre-pared from this stock solution using the mobile phase. The solutions were filtered through a 0.45-μm nylon fil-ter. The filtered solution was then injected into the HPLC system. The data of peak area versus drug con-centration were treated by linear least square regression.
Accuracy as recovery
Accuracy was determined by recovery studies using stan-dard addition method. The pre-analyzed samples were spiked with extra 50%, 100%, and 150% of the standard
Table 1 Chromatographic conditions
Composition Value
Column C18 reverse phase column (250 × 4.6 mm, particle size 5μm; Merck, Darmstadt, Germany)
Flow rate 1 mL min-1
Retention time 7.968 ± 0.042 min
Detector PDA detector (Waters 2998)
Detection wavelength 280 nm
Injection volume 20μL
Temperature 25°C
Elution type Isocratic
Run time 20 min
Pramodet al. Journal of Analytical Science and Technology 2013, 4:16 Page 2 of 6
eugenol, and the mixtures were analyzed by the proposed method. The experiment was conducted in triplicate.
Precision
The intraday (repeatability) and interday (intermediate precision) variations for the determination of eugenol was carried out at three concentration levels of 20, 100, and 600 μg mL−1. The determinations were carried out in triplicate.
Specificity
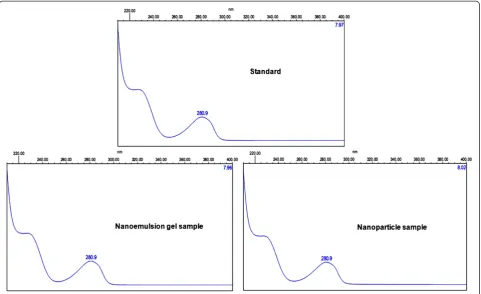
The specificity of the method was ascertained by analy-zing the standard drug and sample. The band for eu-genol in nanoemulsion gel and nanoparticle samples was confirmed by comparing theRfvalues and spectra of the band with that of the standard. The peak purity of eu-genol was assessed by comparing the spectra at three different levels, that is, peak start, peak apex, and peak end positions of the spectrum.
Robustness
Robustness of the method was carried out by introdu-cing very small changes in the analytical methodology at
a single concentration level (100 μg mL−1). Robustness of the proposed method was determined in two different ways, i.e., by making deliberate changes in the mobile phase ratio, flow rate, and detection wavelength of analysis. The percentage of relative standard deviation (%RSD) of the experiment was calculated to assess the robustness of the method.
Detection and quantitation limits
The detection limit (DL) is the lowest amount of analyte in a sample, which can be detected but not necessarily quantitated. The quantitation limit (QL) is the lowest amount of analyte in a sample, which can be quantita-tively determined with suitable precision and accuracy. The limit of quantification and limit of detection were determined based on the technique of signal-to-noise ratio (ICH Guidelines Q2(R1) 2005) using Equations 1 and 2:
QL¼10σ=S ð1Þ
DL¼3:3σ=S ð2Þ
where σ is the standard deviation of the intercept of the calibration plot andS is the slope of the calibration curve.
Results and discussion
Although limited HPLC methods for the determination of eugenol have been reported (Dighe et al. 2005; Li Figure 1HPLC chromatogram of eugenol.
Figure 2Calibration curve of eugenol by HPLC method.
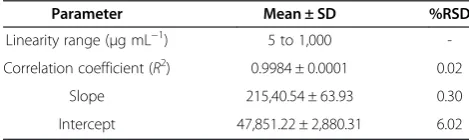
Table 2 Linear regression data for the calibration curve (n= 3)
Parameter Mean ± SD %RSD
Linearity range (μg mL−1) 5 to 1,000
-Correlation coefficient (R2) 0.9984 ± 0.0001 0.02
Slope 215,40.54 ± 63.93 0.30
et al. 2004), none of them reported their specificity in quantifying eugenol in nanostructured delivery systems. Moreover, the application of PDA detector is an added advantage for the developed method. Detection of an entire spectrum simultaneously is possible with PDA de-tector. While UV–vis detectors visualize the obtained re-sult in two dimensions (light intensity and time), only PDA adds the third dimension (wavelength). This is convenient to determine the most suitable wavelength without repeating analyses. No methods are available for eugenol quantification from formulations where a high specificity is required to overcome the probable interfe-rence of the excipients.
Calibration curve
A representative chromatogram of eugenol in the deve-loped HPLC method is shown in Figure 1. A retention time of 7.923 min can be observed from the HPLC chro-matogram in Figure 1. The calibration curve for eugenol by the developed HPLC method is shown in Figure 2. The linear regression data for the calibration curve dem-onstrated a good linear relationship over the concen-tration range of 5 to 1,000 μg mL−1. A good linearity was established by a correlation coefficient (R2) value of 0.9984 ± 0.0001 (Table 2). Correlation coefficient is a statistical tool used to measure the degree or strength of this type of relationship, and here, a high correlation co-efficient value (a value very close to 1.0) indicates a high level of linear relationship between the concentration of eugenol and peak area. No significant differences were observed in the slopes of standard curves as indicated by the low %RSD of 0.30. Table 2 displays the linear regres-sion data for the calibration curve of eugenol.
Accuracy as recovery
Accuracy was investigated by analyzing three concentra-tions of the standard drug solution previously analyzed
using standard addition technique. The recovery studies were carried out to check the sensitivity of the method to estimate eugenol. The standard addition technique was carried out by adding 50%, 100%, and 150% of eu-genol concentration in the sample. The percentage re-coveries of the three concentrations were found to be 99.60% to 101.07%, which is indicative of high accuracy. The values of percentage recovery and %RSD are dis-played in Table 3. The mean percentage recovery values, close to 100%, and their low %RSD values indicated high accuracy of the analytical method.
Precision
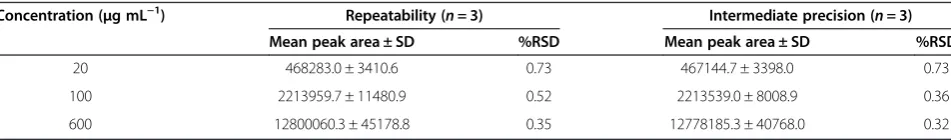
The repeatability of developed HPLC method, by intra-day assay, is expressed in the terms of %RSD, and the re-sults (Table 4) demonstrated the repeatability of the method. The interday variation of eugenol at three dif-ferent concentration levels of 20, 100, and 600 μg mL−1 establishes the intermediate precision of the method. The low values of %RSD for repeatability and intermedi-ate precision suggested an excellent precision of the de-veloped HPLC method.
Specificity
The specificity of the developed method for the analysis of eugenol in the nanoemulsion gel and nanoparticle samples was confirmed by comparing the spectra ob-tained in the standard and sample analyses (Figure 3). The peak start, peak apex, and peak end positions of these spectra were matching.
Robustness
Robustness was studied by introducing small changes in the mobile phase ratio, flow rate, and detection wave-length of analysis. The standard deviation and %RSD of peak area and retention time (Rt) was calculated and
Table 3 Recovery data for the accuracy of the HPLC method
Excess of eugenol added (%)
Concentration of
sample (μg mL−1) of spiked sample (Theoretical concentration
μg mL−1) sample ± SD (Concentration of spiked
μg mL-1) (n = 3) Recovery ± SD (%) %RSD
50 100 150 149.41 ± 1.87 99.60 ± 1.24 1.25
100 100 200 202.15 ± 1.36 101.07 ± 0.68 0.67
150 100 250 252.01 ± 1.82 100.80 ± 0.73 0.72
Table 4 Repeatability and intermediate precision of HPLC method
Concentration (μg mL−1) Repeatability (n= 3) Intermediate precision (n= 3)
Mean peak area ± SD %RSD Mean peak area ± SD %RSD
20 468283.0 ± 3410.6 0.73 467144.7 ± 3398.0 0.73
100 2213959.7 ± 11480.9 0.52 2213539.0 ± 8008.9 0.36
600 12800060.3 ± 45178.8 0.35 12778185.3 ± 40768.0 0.32
Pramodet al. Journal of Analytical Science and Technology 2013, 4:16 Page 4 of 6
listed in Table 5. The low values of %RSD show the ro-bustness of the method.
Detection and quantitation limits
The DL and QL were determined as per the ICH Guide-lines Q2(R1) (2005) and were found to be 0.44 and 1.34μg mL−1, respectively.
Conclusions
The RP-HPLC-PDA system with C18 reversed-phase column (250 × 4.6 mm, particle size 5 μm) was used in this study. Acetonitrile and water in the ratio of 1:1 (v/v) was chosen as the mobile phase, and a detection wavelength of 280 nm was used with a flow rate of 1 mL min−1. The method validation was performed according to the guidelines of the Figure 3UV absorption spectra of eugenol in standard, nanoemulsion gel sample, and nanoparticle sample.
Table 5 Robustness data of the HPLC method
Parameter Study condition Mean area ± SD %RSD of area Rt± SD % RSD of Rt
Original Used Level
Mobile phase ratio (ACN/water) 50:50 48:52 −1 2218634.9 ± 6686.7 0.30 7.968 ± 0.024 0.30
50:50 0
52:48 +1
Flow rate (mL min−1) 1.0 0.9 −1 2216384.3 ± 8147.4 0.37 7.958 ± 0.068 0.85
1.0 0
1.1 +1
Detection wavelength (nm) 280 278 −1 2214941.3 ± 13356.9 0.60 7.967 ± 0.030 0.38
280 0
282 +1
International Conference on Harmonization (ICH). HPLC method for the quantification of eugenol was successfully developed and validated. The method was validated in terms of linearity and range, accur-acy, precision, specificity, robustness, detection limit, and quantitation limit. The DL and QL were deter-mined as per the ICH guidelines and were found to be 0.44 and 1.34 μg mL−1, respectively. The devel-oped RP-HPLC-PDA could be successfully employed for the quantification of eugenol in its nanoemulsion gel and nanoparticles.
Competing interests
The authors declared that they have no competing interests.
Authors’contributions
KP, SHA and JA proposed the idea and design the experiment. KP and JA carried out the preparation of nanoemulsion and nanoparticles. UKI assisted in framing the experiments. UKI prepared standards and samples for analysis. YTK and SA carried out the HPLC analysis of the samples and standard. All authors participated in the preparation of the manuscript. All authors read and approved the final manuscript.
Acknowledgements
Pramod K gratefully acknowledges Indian Council of Medical Research (ICMR), New Delhi, India, for providing Senior Research Fellowship (No. 35/3/ 10/NAN/BMS).
Author details
1Department of Pharmaceutics, Faculty of Pharmacy, Jamia Hamdard, Hamdard Nagar, New Delhi–110 062, India.2Department of
Pharmacognosy & Phytochemistry, Faculty of Pharmacy, Jamia Hamdard, Hamdard Nagar, New Delhi–110 062, India.
Received: 18 May 2013 Accepted: 10 October 2013 Published:
References
Chen F, Shi Z, Neoh KG, Kang ET (2009) Antioxidant and antibacterial activities of eugenol and carvacrol-grafted chitosan nanoparticles. Biotechnol Bioeng 104(1):30–39
Dighe VV, Gursale AA, Sane RT, Menon S, Patel PH (2005) Quantitative determination of eugenol fromCinnamomum tamalaNees and Eberm: leaf powder and polyherbal formulation using reverse phase liquid
chromatography. Chromatographia 61:443–446
Gomes C, Moreira RG, Castell-Perez E (2011) Poly (DL-lactide-co-glycolide) (PLGA) nanoparticles with entrapped trans-cinnamaldehyde and eugenol for antimicrobial delivery applications. J Food Sci 76(2):N16–N24 ICH Guidelines Q2(R1) (2005) Validation of analytical procedures: text and
methodology, http://www.ich.org/fileadmin/Public_Web_Site/ICH_ Products/Guidelines/Quality/Q2_R1/Step4/Q2_R1__Guideline.pdf. Accessed 10 Mar 2011
Jadhav BK, Khandelwal KR, Ketkar AR, Pisal SS (2004) Formulation and evaluation of mucoadhesive nanocapsules containing eugenol for the treatment of periodontal diseases. Drug Dev Ind Pharm 30:195–203
Kriegel C, Kit KM, McClements DJ, Weiss J (2010) Nanofibers as carrier systems for antimicrobial microemulsions: II: release characteristics and antimicrobial activity. J Appl Polym Sci 118:2859–2868
Levi L, Walker GC, Pugsley LI (1964) Quality control of pharmaceuticals. Can Med Assoc J 91(15):781–785
Li Y, Sun Z, Zheng P (2004) Determination of vanillin, eugenol and isoeugenol by RP-HPLC. Chromatographia 60:709–713
Pokharkar VB, Shekhawat PB, Dhapte VV, Mandpe LP (2011) Development and optimization of eugenol loaded nanostructured lipid carriers for periodontal delivery. Int J Pharm Pharm Sci 3:138–143
Pramod K, Ansari SH, Ali J (2010) Eugenol: a natural compound with versatile pharmacological actions. Nat Prod Commun 5(12):1999–2006
Pramod K, Shanavas S, Ansari SH, Ali J (2012) Eugenol nanodroplet gel as novel biomaterial in nanomedicine. Adv Sci Lett 10:1–13
Pramod K, Ansari SH, Ali J (2013) Fabrication and tailoring of eugenol loaded polycaprolactone nanoparticles using response surface methodology. Adv Sci Eng Med 5(11):1166-1175
Reis CP, Neufeld RJ, Ribeiro AJ, Veiga F (2006) Nanoencapsulation I: methods for preparation of drug-loaded polymeric nanoparticles. Nanomedicine 2:8–21
Cite this article as:Pramodet al.:Development and validation of RP-HPLC-PDA method for the quantification of eugenol in developed nanoemulsion gel and nanoparticles.Journal of Analytical Science and Technology
Submit your manuscript to a
journal and benefi t from:
7Convenient online submission 7Rigorous peer review
7Immediate publication on acceptance 7Open access: articles freely available online 7High visibility within the fi eld
7Retaining the copyright to your article
Submit your next manuscript at 7 springeropen.com
Pramodet al. Journal of Analytical Science and Technology Page 6 of 6
28 Oct 2013
10.1186/2093-3371-4-16
2013, 4:16 2013, 4:16