SRef-ID: 1684-9973/ars/2005-3-227
© Copernicus GmbH 2005
Advances in
Radio Science
Computation of currents induced by ELF electric fields in
anisotropic human tissues using the Finite Integration Technique
(FIT)
V. C. Motrescu and U. van Rienen
Institute of General Electrical Engineering, University of Rostock, Albert-Einstein-Str. 2, 18059 Rostock, Germany
Abstract. In the recent years, the task of estimating the currents induced within the human body by environmental electromagnetic fields has received increased attention from scientists around the world. While important progress was made in this direction, the unpredictable behaviour of liv-ing biological tissue made it difficult to quantify its reaction to electromagnetic fields and has kept the problem open. A successful alternative to the very difficult one of performing measurements is that of computing the fields within a hu-man body model using numerical methods implemented in a software code. One of the difficulties is represented by the fact that some tissue types exhibit an anisotropic character with respect to their dielectric properties. Our work consists of computing currents induced by extremely low frequency (ELF) electric fields in anisotropic muscle tissues using in this respect, a human body model extended with muscle fibre orientations as well as an extended version of the Finite In-tegration Technique (FIT) able to compute fully anisotropic dielectric properties.
1 Introduction
Simulations that take into account the anisotropy of mus-cle tissue were already performed by (Dawson and Stuchly, 1998). This paper reports a number of other authors that ear-lier incorporated anisotropic tissue properties within numer-ical methods like FD, FDTD and FEM. Dealing with SPFD and magnetically induced fields and currents, the paper of (Dawson and Stuchly, 1998) presents plenty of results for miscellaneous exposure conditions under the limitation of considering all the muscle fibers oriented parallel or perpen-dicular to the longitudinal axis of the body. These hypotheses can offer an image of the limits of induced current densities
Correspondence to: V. C. Motrescu
as they represent extreme cases, however as mentioned in the paper, the anisotropy of muscle tissue changes the cur-rent paths giving thus importance to the real fiber orientation especially for organ dosimetry.
In order to present our method for computation of electri-cally induced currents in the human body accounting for the anisotropy of skeletal muscles, we perform some simulations with a realistic human body model standing under a trans-mission power line employing the algorithm of the Finite In-tegration Technique (FIT) – a numerical method which dis-cretizes Maxwell’s equations on a grid pair preserving the an-alytical properties of the original equations (Weiland, 1977). The human body model known as HUGO is based on the cryosection images provided by the Visual Human Project of the National Library of Medicine, Maryland, USA, which were assembled in a 3-D voxel model and then extended with muscle fiber orientations by a working group at the Institute of Biomedical Engineering, University of Karlsruhe, Ger-many (Sachse, 1998). It is known that muscle tissues present a transversal isotropic anisotropy with regard to their dielec-tric properties (Sachse, 1997). This property leads to diag-onal material tensors in a local coordinate system aligned to the main directions of the fibers, while in a global coordinate system the anisotropy of muscle tissue is depicted by a full and symmetric tensor.
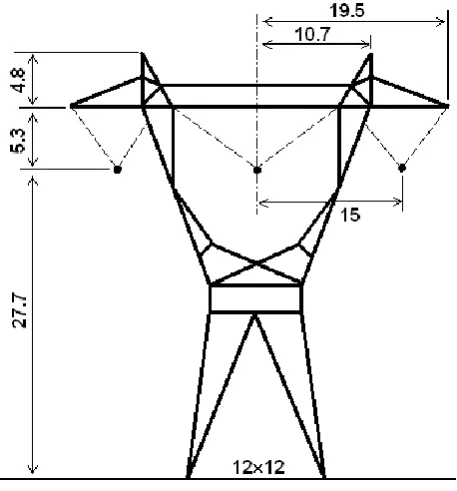
Fig. 1. Tower geometry (All dimensions are given in meters).
In this paper we publish results from electro-quasistatic simulations with a model which includes the anisotropy of both conductivity and permittivity, the latter expressing the capacitive effect at the separation plane between different tis-sue types.
2 Materials
As already mentioned, the electric field source chosen for our simulations is represented by a high voltage transmission power line operating at 765 kV and 50 Hz with parameters taken from EPRI (1982). Within an electromagnetic simula-tion software package based on the Finite Integrasimula-tion Tech-nique (CST EMStudioT M), a high voltage tower of lattice type, made of steel, for a single horizontal circuit, was mod-elled with the main dimensions given in Fig. 1.
The power line consists of two such towers situated at a distance of 408 m from each other such that the conductors in between have a length of 396 m corresponding to the av-erage span length provided in EPRI (1982). For each phase consisting of four conductors with a diameter of 4 cm, spaced 60.96 cm from each other, we calculated an equivalent diam-eter of 43.63 cm with the formula given in Eq. (1) which is valid for conductors structured in regular bundles and calcu-lation of fields that are far from the conductor surface (Deno and Zaffanella, 1982).
deq =Dn r
nd
D (1)
In Eq. (1),Dis the bundle diameter,nis the number of sub-conductors andd is the diameter of the subconductors.
Table 1. Minimum clearances for the 765 kV transmission power line.
Distance Value in meters
Phase to tower 4.2 Phase to ground 16.2 Phase to phase 13.8
Fig. 2. Human body standing under the power line. Perspective view of the computational domain.
Shield wires were omitted considering that because they are positioned above the phase conductors, their influence is very small near the ground level. All the insulators were modeled as simple insulating rods while the ground was as-signed to a perfect electric conductor (PEC) layer in gal-vanic contact with both towers assigned to the same layer. The ground was assumed to be perfect electric conductor based on the fact that earth surface charges redistribute very fast (0.1 to 100 ns) under a change in the applied field com-pared to the period of power frequency (Deno and Zaffanella, 1982). The power line configuration does not exceed min-imum clearances recommended by the designers and pro-vided in Table 1. At midspan the conductors reach the level of 16.2 m above ground which is equivalent to the mini-mum phase to ground clearance. The entire computational domain shown in Fig. 2 where the human body is stand-ing under the power line, has the followstand-ing dimensions: 414 m×52 m×40 m.
3 Methods
The potential value found at the level of two meters above ground, is imposed in a second step as a boundary condition in an electro-quasistatic simulation with a much finer grid and fully anisotropic material properties, with the computa-tional domain consisting of the human body surrounded by air. The second step computation is performed within a C++ software code (implemented by us for this purpose) that uses the CST EMStudioT Monly for the visualization of the com-puted fields.
3.1 Electrostatic simulation
Since electrostatic fields exist only in non-conductive media, there are no conduction, convection, or impressed currents in the mathematical model of electrostatics (van Rienen, 2001). The electric fields and displacement currents are calculated by solving in conjunction with the potential theory, a Poisson type equation of the form:
div (ε grad ϕ)= −ρ (2)
where εis the rank two tensor of dielectric permittivity, ϕ is the electric potential andρthe charge density. When dis-cretized with FIT, the formula in Eq. (2) becomes:
˜
SMεS˜T8E=q (3)
with the discrete divergence operatorS, the material operator˜ Mεand the discrete gradient operator G=− ˜ST. The discrete potential is denoted by8E and the discrete charge density byq.
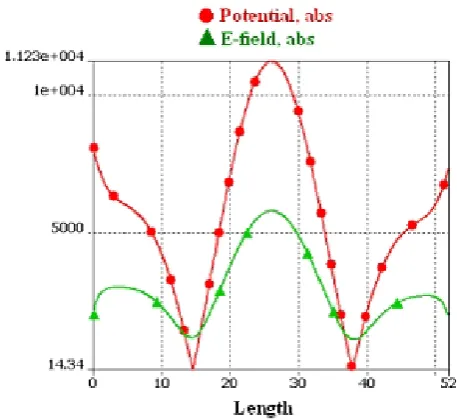
The electric fields arising from a power line over a flat ground are practically vertical near the ground level (Deno and Zaffanella, 1982) reaching the maximum values at midspan. Figure 3 shows the lateral profile of the power line taken at two meters above the ground level in the midspan. Maximum values of both, potential (11.230 kV) and electric field (5.796 kV/m) were found under the midphase. This con-forms to the potentials allocated on the phase conductors i.e. 441.672 kV on the midphase B and a negative potential of –220.836 kV on both lateral phases, A and C. The situation corresponds to the time t=0, (origin of the time axis) in Fig. 4 where the three-phase harmonic voltage system was repre-sented. The phases were considered in a “wye” configura-tion. The ground potential was set to zero volt.
3.2 Electro-quasistatic simulation
At the frequency of 50 Hz the electromagnetic field has a wavelength of 6000 km which is very large compared to the size of a person so that the quasistatic assumption is fulfilled. For a predominantly electric field (electro-quasistatic, EQS), the time-derivative of the magnetic flux is negligible while the displacement currents have to be taken into account. Re-garding the time harmonic EQS fields, these assumptions re-duce the Maxwell’s equations to the following complex Pois-son type equation:
div ((iωε+σ )grad ϕ)=div(J
i) (4)
Fig. 3. Lateral profile of the power line at the level of two meters above ground (Markers have only an identification role).
Fig. 4. Three-phase system of 50 Hz voltages.
The propagation medium is considered anisotropic described by the rank two symmetric tensorsσ andεhaving no elec-tric charges in motion. The complex amplitude of the elecelec-tric field is defined as the gradient of the complex scalar poten-tialE=−grad ϕ. The complex impressed current density is denoted byJi.
With FIT, the continuous equation in Eq. (4) is discretized into the following one:
˜
S(iωMε+Mσ)S˜T8E = ˜Sji (5)
orientation was imported within the software code in a box with sizes: 592 mm×336 mm×1872 mm. At left, right, front and back we added on each side 72 mm of air. On the top-bottom direction, the air was added such that for different positions of the human body on this direction, the compu-tational domain has always a height of two meters. This restriction comes from the fact that at the top side we im-pose through the Dirichlet boundary conditions, the maxi-mum value of the unperturbed potential computed within the electrostatic simulation at the level of two meters above the ground, i.e. 11.230 kV. At bottom side we impose the corre-sponding ground potential from the electrostatic simulation i.e. zero volt. The left-right and front-back sides were treated conveniently with Neumann boundary conditions. This set of boundary conditions enforces the fields to be parallel to the longitudinal axis of the human body keeping thus the di-rection of the unperturbed electric fields under the power line near the ground level. The entire domain is discretized with a number of approximately 1.4 million mesh-nodes when the mesh is regular having the same size with the human body model resolution i.e. 8 mm. With respect to the position of the human body relative to the bottom boundary of the com-putational domain, we imagined three situations:
– Both feet touching the ground;
– Only one foot touching the ground;
– Both feet in the air.
With respect to the dielectric properties of tissues we imag-ined the following five situations:
– All tissues are isotropic;
– Anisotropic muscle with realistic fibre orientation;
– Anisotropic muscle with all fibres oriented on the top-bottom direction of the body;
– Anisotropic muscle with all fibres oriented on the left-right direction of the body;
– Anisotropic muscle with all fibres oriented on the front-back direction of the body.
Combining the two sets from above, we run a number of fifteen simulations. The dielectric properties of the isotropic tissues used in simulations were taken mainly from (Andreuccetti et al., 1997) which is a web server application calculating the dielectric properties of human body tissues using the parameters published by (Gabriel et al., 1996a). The anisotropic properties of muscles, in a ratio of 1.17 for the conductivity, and 2.27 for the permittivity, were taken directly from (Gabriel et al., 1996b).
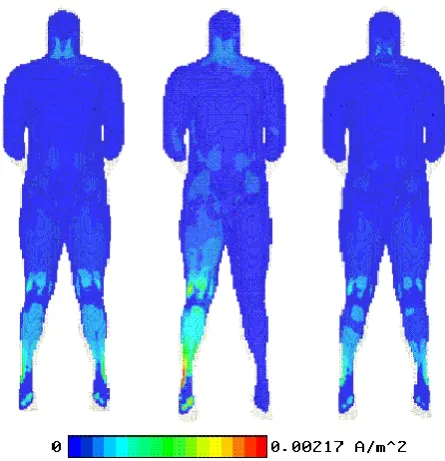
Fig. 5. Differences between real parts of the induced current densi-ties in a section of the body computed with isotropic and anisotropic (natural orientation) muscles for the cases: left – both feet touch the ground, middle – only one foot touches the ground, right – both feet isolated from ground.
4 Results
As results from the electro-quasistatic simulations we pro-vide a scalar plot of the difference between real parts of the induced current densities in a section of the body computed with isotropic and anisotropic (natural orientation) muscles for the cases when both feet touch the ground, only one foot touches the ground, and both feet isolated from ground.
Maximum values of the current density in different parts of the body are tabulated in Appendix A.
5 Discussions
The current density values from Table A1 show that the ba-sic restriction for human exposure to ELF electric fields, of 2 mA/m2 (for the general public, in head, neck and trunk) established by ICNIRP (1998) are not exceeded under the power lines.
6 Conclusion
Appendix A
Table A1. Maximum current densites found in different parts of the body expressed as rms values in [mA/m2] for the situation when the human model touches the ground with both feet, with only one foot or is isolated from ground and muscle tissues are considered isotropic or anisotropic with fibres orientation specified in the left column.
Ankles Head Neck Trunk
Both feet touching the ground
Isotropic 2.296 0.779 0.463 0.485 Anisotropic natural 3.682 0.845 0.679 0.587 Anisotropic front-back 2.315 0.887 0.454 0.483 Anisotropic left-right 2.421 0.819 0.492 0.492 Anisotropic top-bottom 3.690 0.849 0.671 0.605
One foot touching the ground
Isotropic 4.590 0.851 0.505 0.512 Anisotropic natural 7.106 0.923 0.741 0.615 Anisotropic front-back 4.733 0.969 0.496 0.568 Anisotropic left-right 5.601 0.895 0.537 5.385 Anisotropic top-bottom 7.100 0.928 0.733 0.646
Both feet in the air
Isotropic 1.553 0.649 0.385 0.399 Anisotropic natural 2.444 0.705 0.565 0.484 Anisotropic front-back 1.604 0.740 0.378 0.397 Anisotropic left-right 1.503 0.683 0.409 0.410 Anisotropic top-bottom 1.553 0.649 0.385 0.399
Acknowledgements. The authors are grateful to M. Clemens (Helmut-Schmidt-Universit¨at der Bundeswehr Hamburg) as well as to H. De Gersem (TU Darmstadt) for many useful discussions. V. Motrescu was supported by DFG under the contract (RI 814/12-1) and by CST GmbH.
References
Andreuccetti, D., Fossi, R., and Petrucci, C.: An Internet re-source for the calculation of the dielectric properties of body tis-sues in the frequency range 10 Hz–100 GHz, Insitute for applied physics “Nello Carrara”, Florence, Italy, http://niremf.ifac.cnr.it/ tissprop/, 1997.
Balay, S., Gropp, W. D., McInnes, L. C., and Smith, B.: PETSc – Efficient Management of Parallelism in Object Oriented Nu-merical Software Libraries, Modern Software Tools in Scientific Computing, Birkhauser Press, 163–202, 1997.
CST EMStudio™, CST GmbH, Bad Neuheimer Str. 19, D-64289, Darmstadt, Germany.
Dawson, T. W. and Stuchly, M.: Effects of skeletal muscle anisotropy on human organ dosimetry under 60 Hz uniform mag-netic field exposure, Phys. Med. Biol. 43, 1059–1074, 1998. Deno, D. and Zaffanella, L.: Field effects of overhead
transmis-sion lines and stations, in: Transmistransmis-sion Line Reference Book: 345 kV and Above, 2nd edn., (Palo Alto, CA: EPRI), 365–79, 1982.
EPRI: EHV tower geometries and line characteristics, in: Transmis-sion Line Reference Book: 345 kV and Above, 2nd edn., (Palo Alto, CA: EPRI), 30–168, 1982.
Gabriel, S., Lau, R. W., and Gabriel, C.: The dielectric properties of biological tissues: II. Measurements in the frequency range 10 Hz to 20 GHz., Phys. Med. Biol. 41, 2251–2269, 1996a. Gabriel, S., Lau, R. W., and Gabriel, C.: The dielectric properties of
biological tissues: III. Parametric models for the dielectric spec-trum of tissues, Phys. Med. Biol. 41, 2271–2293, 1996b. ICNIRP: Guidelines for limiting exposure to time-varying electric,
magnetic, and electromagnetic fields (up to 300 GHz), Health Physics Vol. 74, No 4, 494–522, 1998.
Motrescu, V. C. and van Rienen, U.: Computation of electrostatic fields in anisotropic human body tissues using the Finite Integra-tion Technique (FIT), Kleinheubacher Berichte, Ad. Radio Sci., 2, URSI, 309–313, 2004.
Sachse, F. B., Werner, C., Meyer-Waarden, K., and D¨ossel, O.: Comparison of Solutions to the Forward Problem in Electro-physiology with Homogeneous, Heterogeneous and Anisotropic Impedance Models, Biomedizinische Technik, vol. 42, 277–280, 1997.
Sachse, F. B., Wolf, M., Werner, C., and Meyer-Waarden, K.: Extension of Anatomical Models of the Human Body: Three-Dimensional Interpolation of Muscle Fiber Orientation Based on Restrictions, Journal of Computing and Information Technology, vol. 6 no. 1, 95–101, 1998.
van Rienen, U.: Numerical Methods in Computational Electrody-namics, Linear Systems in Practical Application, Lecture Notes in Computational Science and Engineering, Vol. 12, Springer Verlag, Berlin Heidelberg, 2001.
![Table A1. Maximum current densites found in different parts of thebody expressed as rms values in [mA/m2] for the situation whenthe human model touches the ground with both feet, with only onefoot or is isolated from ground and muscle tissues are consideredisotropic or anisotropic with fibres orientation specified in the leftcolumn.](https://thumb-us.123doks.com/thumbv2/123dok_us/9659970.1948628/5.595.49.284.152.402/different-expressed-situation-consideredisotropic-anisotropic-orientation-specied-leftcolumn.webp)
