R E S E A R C H
Open Access
Structure of pauses in speech in the
context of speaker verification and
classification of speech type
Magdalena Igras-Cybulska
1*, Bartosz Zió
ł
ko
1,2, Piotr
Ż
elasko
1,2and Marcin Witkowski
1,2Abstract
Statistics of pauses appearing in Polish as a potential source of biometry information for automatic speaker recognition were described. The usage of three main types of acoustic pauses (silent, filled and breath pauses) and syntactic pauses (punctuation marks in speech transcripts) was investigated quantitatively in three types of spontaneous speech
(presentations, simultaneous interpretation and radio interviews) and read speech (audio books). Selected parameters of pauses extracted for each speaker separately or for speaker groups were examined statistically to verify usefulness of information on pauses for speaker recognition and speaker profile estimation. Quantity and duration of filled pauses, audible breaths, and correlation between the temporal structure of speech and the syntax structure of the spoken language were the features which characterize speakers most. The experiment of using pauses in speaker biometry system (using Universal Background Model and i-vectors) resulted in 30 % equal error rate. Including pause-related features to the baseline Mel-frequency cepstral coefficient system has not significantly improved its performance. In the experiment with automatic recognition of three types of spontaneous speech, we achieved 78 % accuracy, using GMM classifier. Silent pause-related features allowed distinguishing between read and spontaneous speech by extreme gradient boosting with 75 % accuracy.
Keywords:Pauses, Fillers, Punctuation, Polish, Biometry, Spontaneous speech, Speech classification
1 Introduction
A set of common disfluencies interferes with discourse consistency in spontaneous speech. The most important ones are filled pauses, restarts, changes of syntax during the utterance, and inclusions of intervening sentences. Within words, the most frequent disfluencies are repeti-tions, repairs and prolongations of conjunctives, preposi-tions, and final syllables. As far as human perception can focus on the meaning of the utterance and extract the desired information, an automatic speech recognition system literally recognizes whole acoustic content of the speech signal. As a result, the transcription is redundant with notation of disfluencies or slips of the tongue but diminished of the other types of information present in a signal, like punctuation. Pause detection is usually used
only to extract voice activity regions for further process-ing or to remove undesirable disfluencies. On the other hand, the information on pauses properties patterns can significantly enrich high-level information of speech sig-nal. In recent years, analysis of multi-layered linguistic and paralinguistic metadata of recordings received focused attention [1].
We assume that the pauses properties in speech signal are strongly individualized between speakers and influ-enced by situational context and cognitive task. This study aims to verify if the information on pauses can be useful for speaker biometry systems (experiment 1) and for recognition of different types of spontaneous speech (experiment 2) as well as distinguishing between read and spontaneous speech (experiment 3).
The information is meaningful for creating a speaker psycho-social profile. Additionally, it helps in discourse analysis for different kinds of situational context or lin-guistic task [27]. The types of speech differ in situational context, the task involving a cognitive load as well as
* Correspondence:[email protected];http://www.dsp.agh.edu.pl;
http://techmo.pl
1Department of Computer Science, Electronics and Telecommunications,
AGH University of Science and Technology, Al. Adama Mickiewicza 30, 30-059 Kraków, Poland
Full list of author information is available at the end of the article
level of spontaneity and have direct impact on speech fluency. For the first type, presentations prepared on a given subject represent typical informative speech in a formal situation. For the second type, oral translations performed by professional interpreters are partly imita-tive against the original speech. Simultaneity of listening and speaking engages complex cognitive functions. For the third type, radio interviews represents spontaneous speech extracted from dialogues with slow turn-taking, mainly storytelling (indicating more informal situation). Although the pauses in each type of speech were charac-terized in numerous analyses (e.g., [33–35]), there has been a lack of automatic classification of speech type based on silent pause-related cues only. In a similar study dealing with three classes of spontaneous speech [32], a comparable accuracy was obtained, though much more features was utilized.
Research on the recognition of read and spontaneous speech can have an impact in the field of automatic as-sessment of speaker preparation for the task, and elocu-tion abilities. In this applicaelocu-tion, a feedback on similarity to fluent read speech would help speaker improve their level of oratorical skills.
Modeling of pauses in spoken language can be also ap-plied to a more natural-sounding speech synthesis sys-tems. The impact of pauses analysis for speech technology is particularly important for spontaneous speech recogni-tion, which remains a challenging task [28]. Some results of presented works have already been used for building pauses models for automatic speech recognition system which is developed in AGH University and Techmo [29].
The paper is organized as follows: in the rest of Section 1, the background of the pauses appearance and role in speech is presented and the state-of-the-art of speaker recognition systems is briefly discussed. Next, the collected database is described in Section 2. In Section 3, we summarize adopted method of data-base processing, features extraction and statistical tools. Section 4 contains results of our experiments, which are discussed in Section 5. The paper is con-cluded in Section 6.
1.1 Pauses
The research shows three types of acoustic pauses in spoken language. The most intuitive is silent pauses (s_p), as regions of signal where no voice activity is recorded.
The second types are filled pauses (f_p)— pseudo-words—that do not affect sentence meaning, like yyy, eee, hmm, mmm, ym, yh (in SAMPA notation: III, eee, xmm, mmm, Im, Ix) but perturb utterance fluency. The sounds of filled pauses are specific for language (in Pol-ish, the most common are yyy/yh and mmm, while for English—um) and specific for speaker’s habits. They can
appear even 10–20 per minute in case of inexperienced speakers.
The third sort of pauses that we consider are breath pauses (b_p). In case of normal physiological condition, the value of breath per minute is 12–20 while resting, and as prior work showed, it is 10–12 during speech production [2].
Considering the origin of the pause usage we marked out: (1) regular natural pauses caused by respiration ac-tivity (breath pauses), (2) irregular intentional pauses, purposely used as a stylistic form, especially by profes-sional speakers (silent pauses), and (3) irregular, uninten-tional disfluencies, effects of uncertainty, hesitations or short reflections (acoustic events like silent pauses or filled pauses).
1.2 Pauses vs. paralinguistic information
Depending on the speaker and situational/social context, pauses may be characterized by different properties. One of them is a type of personality of the speaker and his speaking habits. Another important factor is speaker preparation for the task, level of oratorical skills, and elocution abilities. Durations of pauses depend also on the kind of linguistic task. One can easily assume that stress during speaking is an important factor dictating the frequency and lengths of pauses. Pauses can be also considered in the terms of performative aspects of speech. Filled pauses, among other disfluencies, were successfully used for recognition of three levels of spontaneity and applied to speaker role recognition with over 70 % precision [32]. Pauses were also de-scribed as traces of cognitive activity or a mirror of cognitive processes. In the situation of simultaneous interpretation, they were studied in [33] and [34].
Pause duration was reported to correlate with social attributes of speaker, even ones such as region, ethni-city, age, and gender [3]. Cross-cultural study of silent pauses in selected European languages (Polish was not included) revealed differences in pause durations between languages [4], but their distribution is usually similar and can be well estimated by bi-Gaussian model [5].
Some medical aspects of different types of pauses were investigated in context of affective state [6] and physical [7] or mental [8] condition of the speaker, e.g. schizo-phrenics make pauses around 10 % more often, which are also around 10 % longer [8].
In speech technology, information on pauses is used in majority of algorithms of automatic punctuation detec-tion [9, 10]. It has been shown that 95 % of silent pauses longer than 350 ms are the sentence boundaries [11].
changed by learning. Nevertheless, the fact was proved only for the grammatical pauses, while for the ungram-matical ones the opposite was observed.
1.3 Speaker recognition
Speaker recognition is the process of analysis of the speaker identity based on voice characteristics. The main tasks of a speaker recognition system include verification and/or identification. The aim of identification is to choose one of many speakers based on a speech signal, whereas verification is the process of determination whether assigned speaker was chosen correctly. In line with the particular usage specification, those systems may be divided into text-dependent or text-independent. A text-dependent system assumes that recognition process is based on a specific fixed phrase, i.e., each ana-lyzed recording contains the same sentence. In text-independent scenario, speakers may be identified or verified by a random utterance [13]. The second system is more challenging, since it is much more complicated due to phonetically mismatched voice samples in train-ing and recognition phases.
Automatic speaker recognition systems consist of two main functionalities—enrollment and verification. During enrollment phase, voiceprint or model of a speaker is calculated based on extracted features from voice samples. Verification is based on comparison of processed input speech signal against the speaker model enrolled previously. There are many discriminative features that may be used to distinguish a speaker. Low-level features, like formants or energy, contain informa-tion connected with voice generainforma-tion. Mel-frequency cepstral coefficients (MFCCs) are used most frequently to parameterize voice signals [14, 21, 24].
1.4 Pause-related features in speaker recognition task
In past several years, there has been an observable tendency to include prosodic features to speaker recog-nition problem. High-level features are associated with linguistic and behavioral characteristics of each speaker [15]. In majority of approaches, features re-lated to pitch, energy, and segmental duration were investigated [16–18] and by including these parame-ters, the system accuracy increased by about 10 %. Peskin et al. [16] experimented also with pause dur-ation and frequency and found out that pause-related feature set was the least significant compared to other groups of prosodic features. In Sönmez et al. [17] ex-periment, pause duration was modeled with shifted exponential and together with voiced segments dur-ation gave 3.5 % improvement in speaker recognition task. It was also proved that patterns of pauses in network traffic introduced when encoding an audio signal are speaker-specific, and that they are sufficient
to weaken the anonymity of the speaker in encrypted voice communication [19].
Therefore, the goal of this research is to check if pauses may be used as one of the high-level factors and potentially improve existing systems. To the best of au-thors’ knowledge, the pauses features were not yet dir-ectly used in any speaker recognition system, in particular, in any Polish one.
2 Materials
The prepared corpus of spontaneous Polish speech con-sisted of different types of monologues in formal or semi-formal situations. Total duration of recordings is 120 min, including utterances of 30 speakers (16 male, 14 female). Among them, there are both experienced or professional speakers (politicians, professors, profes-sional translators, radio interviewees) and inexperienced speakers (students) [38].
The first group of recordings (30 min) is formed by utter-ances from orations or public presentations: speeches and reports from European Parliament [20], sessions of a faculty council, students’lectures, and reviews. All the speeches, al-though preceded by preparation of the speakers or sup-ported by slides, were not read and are characterized by all the typical features of spontaneous speech.
The second part of the corpus (30 min) consisted of recordings of real-time translation of orations during European Parliament sessions [20]. This sort of utter-ances is specific kind of spontaneous speech, where the speech rate of the translator is determined by the style of the speaker being translated. However, they are situa-tions of formularization of own utterance, which causes their spontaneous character and induces presence of im-perfections specific for spontaneous speech.
The third type of recordings (60 min) is radio broad-casts, which were prepared by removing the voice of inter-viewer, leaving only the expressions of interviewees. The length of recordings after preparation was 10 min for each speaker (three females and three males).
Another corpus of read speech was prepared, for com-parison with spontaneous speech and for evaluation tests. It consisted of recordings from audio books and AGH Audio-Visual Speech Database (50 speakers, 15 min of continuous speech for each speaker).
The recordings were labeled with P for presentations/ orations T for translations, R for radio dialogues, and A for audiobooks and other sources of read speech and de-scribed with number of the speaker and duration of ut-terance (in minutes).
3 Methods
3.1 Pauses tagging and annotation
First we transcribed orthographically the content of the recordings to clean (skipping disfluencies, filled pauses or repairs) and syntactically correct texts. On the basis of the observation of the process, the factors affecting the impre-cision and ambiguity of inserting punctuation in the
transcripts were collected. One of the impediments was ambiguous intonation, especially in case of inexperienced speakers. It manifested as “enumerating” tone of voice, which caused the speaker to preserve the same tone dur-ing commas and full stops. Another symptom was con-struction of multiple complex sentences with every clause starting with a conjunctive pronounced with extended phonation. In such cases, the decision of inserting comma or full stop remained subjective. When a speaker did not signalize the phrases and sentences border with their pro-nunciation, intonation or pauses, the punctuation was based on the meaning of the utterance. The last word of preceding sentence was often bonded with the first in
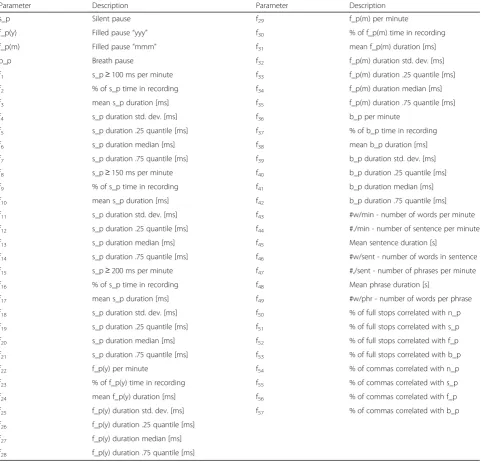
Table 1Explanation of adopted abbreviations
Parameter Description Parameter Description
s_p Silent pause f29 f_p(m) per minute
f_p(y) Filled pause“yyy” f30 % of f_p(m) time in recording
f_p(m) Filled pause“mmm” f31 mean f_p(m) duration [ms]
b_p Breath pause f32 f_p(m) duration std. dev. [ms]
f1 s_p≥100 ms per minute f33 f_p(m) duration .25 quantile [ms]
f2 % of s_p time in recording f34 f_p(m) duration median [ms]
f3 mean s_p duration [ms] f35 f_p(m) duration .75 quantile [ms]
f4 s_p duration std. dev. [ms] f36 b_p per minute
f5 s_p duration .25 quantile [ms] f37 % of b_p time in recording
f6 s_p duration median [ms] f38 mean b_p duration [ms]
f7 s_p duration .75 quantile [ms] f39 b_p duration std. dev. [ms]
f8 s_p≥150 ms per minute f40 b_p duration .25 quantile [ms]
f9 % of s_p time in recording f41 b_p duration median [ms]
f10 mean s_p duration [ms] f42 b_p duration .75 quantile [ms]
f11 s_p duration std. dev. [ms] f43 #w/min - number of words per minute
f12 s_p duration .25 quantile [ms] f44 #./min - number of sentence per minute
f13 s_p duration median [ms] f45 Mean sentence duration [s]
f14 s_p duration .75 quantile [ms] f46 #w/sent - number of words in sentence
f15 s_p≥200 ms per minute f47 #,/sent - number of phrases per minute
f16 % of s_p time in recording f48 Mean phrase duration [s]
f17 mean s_p duration [ms] f49 #w/phr - number of words per phrase
f18 s_p duration std. dev. [ms] f50 % of full stops correlated with n_p
f19 s_p duration .25 quantile [ms] f51 % of full stops correlated with s_p
f20 s_p duration median [ms] f52 % of full stops correlated with f_p
f21 s_p duration .75 quantile [ms] f53 % of full stops correlated with b_p
f22 f_p(y) per minute f54 % of commas correlated with n_p
f23 % of f_p(y) time in recording f55 % of commas correlated with s_p
f24 mean f_p(y) duration [ms] f56 % of commas correlated with f_p
f25 f_p(y) duration std. dev. [ms] f57 % of commas correlated with b_p
f26 f_p(y) duration .25 quantile [ms]
f27 f_p(y) duration median [ms]
the next one. In translators group we usually ob-served specific disorder of phonotactics involving arti-ficial prolongations of whole words. Transposals of functional elements of sentences and reorganization of the sentence were also frequent events. It is com-mon for inexperienced speakers to place intervening sentences during the speech or abusing certain words like let’s say, just, simply (language-specific conversa-tional fillers/discourse makers).
For each transcription, the number of words, full stops, and commas were counted. Then, the statistics of sentences and phrases lengths were computed: mean length of a sen-tence and a phrase, as well as a mean number of words in sentences and phrases. Then, in the places of punctuations signs, occurrences of pauses were verified. When a full stop was signalized by a silent pause, the time was tagged as s_p. (similarly for commas s_p,), filled pause f_p. (commas -f_p,), b_p. for a breath pause (b_p, for commas). When no type of pause appeared, the place was tagged as n_p. (n_p,). The parameters were included in the feature vectors (Table 1). Time annotation of breaths and filled pauses were prepared manually with half-automated Annotator software. As a result, Master Label Files (mlf, HTK stand-ard) were attached to each recording.
3.2 Feature extraction
In order to find silent pauses in all recordings, an ITU-T G.729b compliant voice activity detector (VAD) was used, which relies on full band energy, low band energy, zero-crossing rate and a spectral measure to decide whether a 10-ms segment contains voice. Silent pauses were detected with different lower thresholds: 100, 150, and 200 ms.
For each speaker, the amount and duration of each type of pauses were used to calculate number of pauses per minute, percentage of pause duration in the record-ing, and mean pause duration with its standard deviation
as well as its median and quartiles. The parameters are listed and explained in Table 1.
3.3 Statistical methods
Values of extracted features fn (where n = 1,…,P) were
standardized according to the equation
fn;s ¼
fn;s−μð Þfn
σð Þfn ; ð
1Þ
where fn;s is a normalized value of the featurefnfor sth
speaker,μandσare mean and standard deviation of the variablefnin the examined population.
The properties of speaker s are specified by vectorps
=f1,s,f2,s,…,fP,sof length P, and its distance to mean value
vectorpis computed as
γs¼ 1 P
XP
n¼1 fn;s
: ð2Þ
In order to investigate potential correlation between speakers and parameters describing pauses in their speech, we computed correlation matrix
Corr¼XN s¼1
p−ps
ð Þðp−psÞT; ð3Þ
where p is an average vector for all speakers, and ps
is a vector that characterizes sth speaker. In the
ex-periment number of speakers N is equal to 30. We
performed the operation for P= 57 parameters listed
in Table 1.
For the parameters which could be obtained for every speaker in our corpus, (i.e., b_p and f_p(y) durations), we concluded an analysis of variance (ANOVA) in order to check the statistical significance of differences between speakers based upon only one of these parameters at a
time. For clustering experiment, we used dendrogram method based on Euclidean metrics.
3.4 Evaluation methods
The scope of the first experiment was to verify if infor-mation on pauses can enhance a biometric verification system, therefore an i-vector based system was set up as a baseline to perform evaluation process. The i-vector approach assumes creation of a Universal Background Model (UBM) with a vast amount of data during setup phase. This process is performed by maximum likeli-hood estimation of a Gaussian Mixture Model (GMM), using an Expectation Maximization (EM) algorithm with K-Means initialization. The next stage of i-vector model-ing is transition from the GMM supervector space into a low dimensional subspace, which is able to represent a whole utterance as a vector of coordinates, called the i-vector. To that end, a transformation matrix, called Total Variability matrix (TV), is estimated also using a maximum likelihood algorithm [30].
The aim of UBM is to represent common characteristics of all possible speakers, and the role of dimensionality redu-cing transformation is to select only the relevant ones for a given speaker. In enrollment process in the baseline system, the recording is first segmented to 20-ms frames and pa-rameterized by Mel-frequency cepstral coefficients (MFCC), followed by feature warping [22]. Then, model of each system user is acquired by calculating frame posteriors using GMM-UBM and extracting i-vectors with a vari-ational Bayes algorithm [30]. The enrolled model represents unique biometrical features of a given speaker. The Pauses system models each user by extracting prosodic features from a larger recording segment, and thus requires at least 1 min of audio for enrollment and verification.
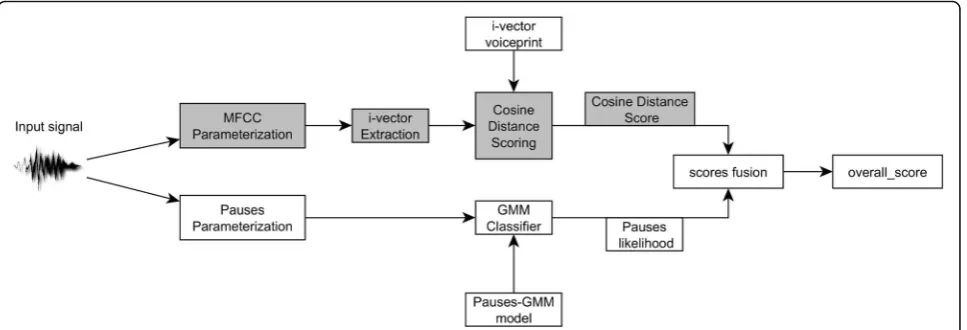
The final system is acquired by combining the final scores of i-vector/MFCC and Pauses systems in evaluation process. Because of that, parameterization based on pauses was added as a parallel to i-vector system. General verification method is presented in Fig. 1. MFCC features extracted from an input signal are forwarded into i-vector extractor. Cosine distance scoring
CDSðw1;w2Þ ¼ w1w2
w1
k kk kw2 ; ð4Þ
where w1 and w2 are i-vectors, was used to obtain a
likelihood measure between verified and tested i-vector. The final score of combined systems is computed with the Bosaris Toolkit [31].
Speaker verification system is a binary classifier, since it determines whether analyzed signal is or is not produced by user related to model stored in a system database. The output of the system is the information that user is a target (the analyzed model is the user model) or an impostor (the model was created in other user enrollment process). Evaluation is therefore based on analysis of target and impostor likelihood distributions. The more separated are those sets the better system works, since it is easier to choose a threshold that divides those sets. In general, ex-pected value of target distribution is greater than the impostor one. Basing on likelihood distributions, it is possible to calculate cumulative distribution functions for targets and impostors. Those functions may be used to determine false positive ratio (FPR) and false negative ratio (FNR) functions which determine respectively the probabil-ity that an impostor is classified as a target and a target is classified as an impostor for a particular likelihood. Deci-sion about particular threshold i.e. choice of operating point, is dependent on the use case of such system. Increas-ing the threshold results in lower FPR, but also means that more targets verification will fail. The value where FPR = FNR is called equal error rate (EER) and is widely used to determine performance of a verification system as a single
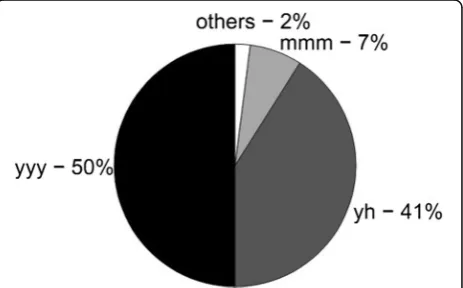
Fig. 2Different types of filled pauses and frequency of their occurrence in 1 h corpus [23]
Table 2Frequency of punctuation in transcripts: mean (standard deviation)
Recordings Words per minute
Sentences per minute
Sentence duration [s]
Words per sentence
Phrases per minute
Phrase duration [s]
Words per phrase
Type P 11,9 (24,3) 6,2 (2,4) 10,9 (3,7) 19,6 (5,8) 19,4 (6,0) 3,3 (0,8) 4,4 (1,0)
Type T 117,2 (20,1) 6,6 (2,0) 10,0 (3,2) 19,1 (4,7) 14,6 (3,3) 4,3 (1,0) 4,6 (0,8)
Type R 129,7 (29,1) 9,9 (3,3) 6,7 (2,3) 13,9 (3,3) 16,1 (4,2) 2,5 (0,8) 5,4 (0,8)
All speakers
parameter. Other operating points of a system, where FNR is not equal to FPR are commonly evaluated with detection error trade-off (DET) plots [39], which include miss prob-ability (FNR) at vertical axis and false alarm probprob-ability (FPR) at horizontal one.
In the second experiment, we verified if pause-related features are useful for automatic classification of three types of spontaneous speech—types P, T, and R. Classification is performed with 3-components GMMs. We applied leave-one-out cross-validation where each time one speaker's recording was the testing one and all the others formed the training set. The goal of the third experiment was to auto-matically distinguish two classes: read (50 audio books) and spontaneous speech (27 recordings of types P, T and R). Several classifiers were tested: decision tree, logistic regression, support vector machine (SVM), random forest classifier and Extreme Gradient Boosting (XGBoost) [36], using Scikit-learn toolkit [37]. Again, a leave-one-out cross-validation was applied.
4 Results
4.1 Overall analysis of pauses appearance in speech
Speech rate in spontaneous monologues is about 117 words per minute (with standard deviation between speakers is about 24 words/min). Mean length of a sen-tence (containing average 18 words) was about 10 s, while mean length of a speech unit divided by punctu-ation (average 5 words) - 3.5 s. The results were similar for both orations/ presentations, real time translations and interviews (more results are presented in Table 2).
The most commonly used types of filled pauses are: pro-longed“yyy”(50 %), short“yh”(41 %) and“mmm”(7 % of counts) (see Fig. 2). For the purpose of this research, we
grouped together the “yyy” and “yh” categories and skipped other fillers, which are very rare (2 %).
As for acoustically registered breath pauses, average for a speaker was about 11 breaths per minute. Quantity of filled pauses in a minute of recordings was often sur-prisingly high, especially for inexperienced speakers (even above 10 per minute). Mean frequency of different types of pauses are compared in Table 3.
4.2 Analysis of correlation of pauses and punctuation marks
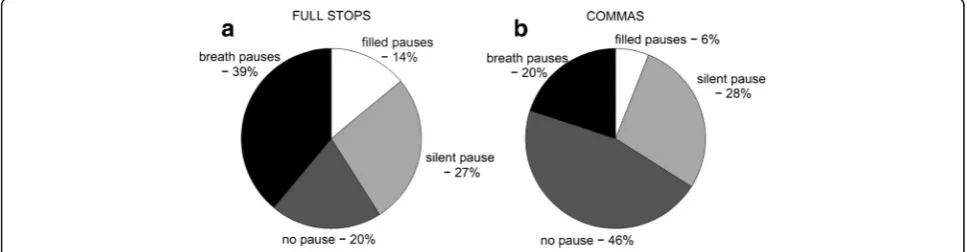
The information on frequency of using punctuation in spoken language was obtained by analyzing the quantity of full stops and commas in transcriptions. Figure 3 shows meaning of the pauses in determining punctuation in speech. Among all full stops in transcription, 39 % are cor-related with occurrences of a breath pause, 27 % a silent pause, and 20 % a filled pause (Fig 3a). Among all commas, 28 % are pointed by a silent pause, 20 % a breath pause, and 6 % a filled pause (Fig 3b). Lack of any kind of a pause (words bonding in pronunciation) was registered in 20 % occurrences of full stops and 46 % commas for spontaneous speech and only for 1.3 % full stops and 42 % commas for read speech (Fig. 4). Among all occurrences of filled pauses, 8 % indicate full stops and 6 % indicate commas; among breath pauses the proportions are, re-spectively, 10 and 11 % (Fig. 5).
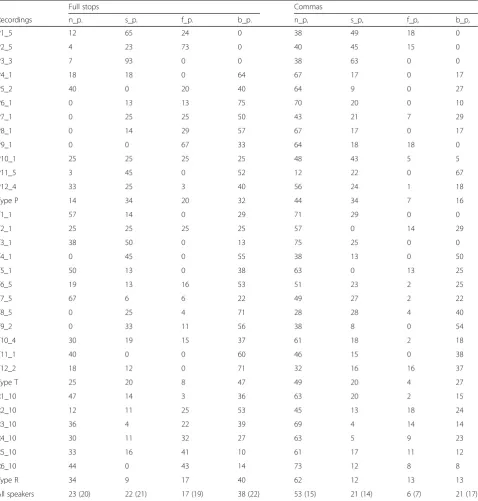
However, the usage of different types of pauses for sig-nalization of punctuation is strongly individualized be-tween speakers, as presented in Tab. 4. To facilitate the observation of inter-speaker differences, the intensity of connection between pauses and punctuation was graded with grayscale. Although the general tendency was
Fig. 3Different types of pauses determiningafull stops andbcommas in aspect of types of filled pauses signalizing punctuation [23]
Table 3Frequency of silent, breath, and filled pauses in recordings: mean (standard deviation)
Recordings #(s_p > 100 ms)/min #(s_p > 150 ms)/min #(s_p > 200 ms)/min #f_p(yyy)/min #f_p(mmm)/min #b_p/min
Type P 10,7 (7,5) 7,7 (6,1) 5,3 (4,7) 6,5 (5,5) 0,6 (0,9) 10,5 (3,9)
Type T 2,2 (2,4) 1,1 (1,1) 0,7 (0,9) 5,8 (3,5) 0,9 (1,0) 11,0 (3,8)
Type R 2,6 (3,9) 1,1 (1,8) 0,5 (0,9) 7,4 (3,6) 1,27 (1,14) 11,0 (1,7)
signalization of full stops with breaths and lack of any kind of a pause in the place of comma, the variation be-tween speakers is considerable.
4.3 Differences between speakers in quality and quantity of pauses
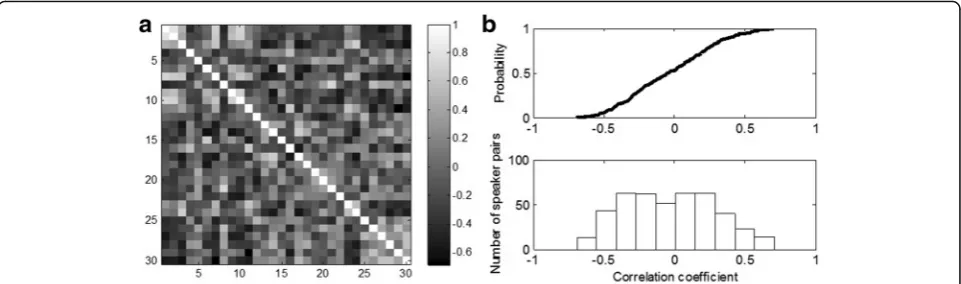
Using feature vectorspsspecific for each speakers, we
in-vestigated correlation of each pair of speakers (formula 3). The obtained correlation matrix is presented in Fig. 6. Distribution of correlation of the given speaker with the others is illustrated in Fig. 7.
As it is presented in Figs. 5 and 6, speakers vectors were usually correlated to a small extent or not correlated. Speakers’ distance from a mean vector was calculated according to formula (2). Distribution of results is presented in Fig. 8.
Having annotated a large quantity of breaths and filled pauses “yyy” for every speaker (with the latter not appearing only for 2 out of 30 speakers in our corpus), we decided to analyze inter-speaker differences. We ob-served that the durations of breaths in our corpus have mean 392 ms, standard deviation 118 ms, median
368 ms, and quantiles are as follows: 0.25 is 312 ms and 0.75 is 455 ms. For the filled “yyy” pauses, the mean is 398 ms, standard deviation is 183 ms, median is 362 ms, and quantiles are as follows: 0.25 is 278 ms and 0.75 is 484 ms. Analysis of variance showed, that both for breaths (p= 7.6E−50) and for filled “yyy” pauses (p= 7.62E−22) the mean duration differences between speakers are statistically significant.
Figure 9a shows the results of ANOVA of breath duration of different speakers, and Fig. 9b shows the same for filled “yyy” pause duration. Analysis of those plots leads to the conclusion that although the differ-ences are not statistically significant for every speaker pair, it makes sense to group the speakers into 2 or 3 categories, as in: speakers taking short breaths, speakers taking breaths of average length, speakers tak-ing long breaths, and the same for“yyy”fillers. If more recordings of a single speaker were available, similar analysis could be made for the frequency of pause occurrence.
For the parameters of breaths and fillers duration, Gaussian models were created (in Fig. 10, an example
Fig. 5Proportions of filled pauses and breath pauses occurrences correlated with full stops or commas [23]
for nine speakers is presented). The preliminary analysis suggests that the features can be used for classification with Gaussian Mixture Models (GMM).
An interesting observation is that 8 (out of 30) of the speakers in our corpus do not use “mmm” filled pauses at all, while most of them do it rarely (on average about 1 per minute, compared to almost 7 filled “yyy” pauses per minute). The most frequent use of them is made by speaker T9_2 at about 3.5
“mmm” pause per minute. This leads to a conclusion that frequent usage of “mmm” filled pause is a char-acteristic feature of a speaker.
In the next experiment, standardized values of each fea-ture were quantized into three values: low, medium and high, in reference to the distribution of each feature. For the quantized feature matrix (Fig. 11a), a clusterization was performed, using Euclidean distance measure. The obtained dendrograms with a heatmap representation
Table 4Percent of pauses events denoting full stops and commas for each speaker (Ppresentations/orations,Ttranslation,Rradio interviews)
Full stops Commas
Recordings n_p. s_p. f_p. b_p. n_p, s_p, f_p, b_p,
P1_5 12 65 24 0 38 49 18 0
P2_5 4 23 73 0 40 45 15 0
P3_3 7 93 0 0 38 63 0 0
P4_1 18 18 0 64 67 17 0 17
P5_2 40 0 20 40 64 9 0 27
P6_1 0 13 13 75 70 20 0 10
P7_1 0 25 25 50 43 21 7 29
P8_1 0 14 29 57 67 17 0 17
P9_1 0 0 67 33 64 18 18 0
P10_1 25 25 25 25 48 43 5 5
P11_5 3 45 0 52 12 22 0 67
P12_4 33 25 3 40 56 24 1 18
Type P 14 34 20 32 44 34 7 16
T1_1 57 14 0 29 71 29 0 0
T2_1 25 25 25 25 57 0 14 29
T3_1 38 50 0 13 75 25 0 0
T4_1 0 45 0 55 38 13 0 50
T5_1 50 13 0 38 63 0 13 25
T6_5 19 13 16 53 51 23 2 25
T7_5 67 6 6 22 49 27 2 22
T8_5 0 25 4 71 28 28 4 40
T9_2 0 33 11 56 38 8 0 54
T10_4 30 19 15 37 61 18 2 18
T11_1 40 0 0 60 46 15 0 38
T12_2 18 12 0 71 32 16 16 37
Type T 25 20 8 47 49 20 4 27
R1_10 47 14 3 36 63 20 2 15
R2_10 12 11 25 53 45 13 18 24
R3_10 36 4 22 39 69 4 14 14
R4_10 30 11 32 27 63 5 9 23
R5_10 33 16 41 10 61 17 11 12
R6_10 44 0 43 14 73 12 8 8
Type R 34 9 17 40 62 12 13 13
allow to easily observe in which features the most similar speakers were alike.
4.4 Group analysis
To investigate the influence of experience and oratorical abilities on pauses and speech rate, we divided a corpus of spontaneous monologues into recordings of experienced speakers (professors and politicians) and inexperienced speakers (mainly students). Average values of selected temporal features of each group are compared in Table 5.
As expected intuitively, professionals speak more slowly, with less disfluencies and formulate shorter sentences, which makes their speech more adjusted for efficient listen-ing and understandlisten-ing by recipients. Also their dynamic breathing rhythms are much more concordant with sen-tences boundaries (a half of full stops were correlated with breath pauses). Such conscious dynamic breathing (taking a breath before beginning of a sentence or phrase) is one of the basic voice emission principles, often emphasized by authors of handbooks on speaking skills and techniques.
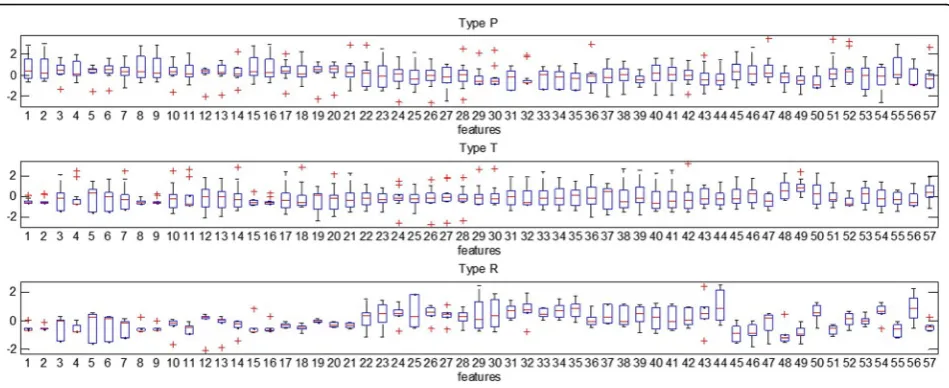
The comparison of presentations, translations and radio dialogues can be observed in Fig. 12. Some of differences are significant and can be interpreted in ac-cordance to intuitive situational context conditions. In radio interviews speakers tend to speak much faster, which is conditioned by the determined time for the
conversation. Surprisingly, their filled pauses are much longer than for the rest of analyzed recordings.
4.5 Using pauses for speaker recognition—evaluation results
For the experiment, recordings from audiobooks were used (50 speakers, 15 min for each speaker). The choice was made in order to obtain a regular set of long enough recordings in the same situational context (reading a story) from a similar group of speakers (professional lec-tors). Entire set was used to train UBM and Total Vari-ability matrix in the i-vector system.
Recordings were split into train part of 5 min and four test parts of 2.5 min each. It allowed performing 1200 cross-validation tests: 200 verification of authorized users (target trials) and 1000 simulation of impostors at-tacks (10 impostors with 2 random recordings were chosen randomly for each speaker). Parameters of silent pauses (f1–f21) were automatically extracted with VAD algorithm and the feature sets were processed as inde-pendent stream (as presented in Fig. 1) according to the methodology described in chapter 3.4.
The results of speaker verification task of a baseline i-vector system (using only MFCC features) are pre-sented in Fig. 13, where the red and blue histograms are normalized distributions of target and impostor scores respectively. Vertical axis refers to FNR and FPR
Fig. 7Boxplot for correlation coefficients distribution for each speaker
values. This result was obtained for the system based on 1024-component GMM-UBM and 400-dimensional total variability subspace. In this case EER reached the smallest value—3 %. The result is considered as sound for the number of impostor and target speakers used in the test. The performance of the system might be en-hanced by gender-dependent approach or incorporation of score processing like PLDA or score normalization techniques, but the goal of this experiment was meas-uring efficacy of a simple baseline speaker verification system on the dataset.
Performance of the system based on pauses features is illustrated in Fig 14. For the evaluation three features were used: durations of the silent pauses, number of silent pauses per minute (f1) and ratio between sum of pause duration (f2) to entire signal length. Due to lim-ited number of data points that was extracted from test samples it was necessary to use minimal number of components in GMM to prevent overfitting. Best
results were obtained with 4-component GMM. Such configuration resulted in EER equal to 40 %. Over-lapped distributions in Fig 14 suggest that used fea-tures are little discriminative in speaker comparison. This meager result implies that applied features, with-out any further processing, should not be used as a standalone input into GMM classifier in a speaker dis-crimination task.
Figure 15 presents DET plots for Pauses and i-vectors systems and for the fusion of the systems performed with a Bosaris Toolkit, where 20 % of the result scores were used to train fusion algorithm. Value of 20 % were chosen empirically, as an optimal point for DET plot. Modification of this value by enlarging training dataset did not change the positions of the curve but reduced its resolution due to lower number of test points. The fu-sion of the scores of the two systems caused no gain in overall performance and reveals reduction of efficacy by 1 % in terms of EER.
Fig. 9Results of ANOVA analysis for 30 speakers:aBreath duration.bFiller“yyy”duration
4.6 Automatic recognition of type of spontaneous speech
For this task, as our features we used a time series of silent pause information extracted in an online manner, where each point indicates an appearance of a silent pause. Three features were used in the ex-periment: the duration of the silent pause instance,
s_p per minute (f1) and percentage of s_p time in re-cording (f2), where f1 and f2 were calculated online, based on the silent pause instances gathered up to this point. To perform classification, we adopted a di-agonal covariance GMM classifier with three mixtures (one for each class of spontaneous speech). The best
Fig. 11aFeatures matrix with quantized values.bHeatmap with dendrograms for speakers and features
result was achieved for three Gaussian components in each mixture. Experiment was carried out using a
“leave-one-out” cross-validation scheme.
The classifier achieved 78 % accuracy. Table 6 shows the Precision, Recall and F1 score achieved by the classifier in this task. As illustrated by the confusion matrix in Fig. 16, the worst performing class is the T type (translations), as it tends to be mistaken as a P type (presentation/oration). We suspect this is due to speakers making long silent pauses in both scenarios—to make a rhetoric effect in case of P, and because of the necessity to wait for more context before translating an utterance in case of T.
4.7 Automatic classification of read and spontaneous speech
In this task, we confronted our spontaneous speech record-ings (P, T, and R classes) with 50 audiobook recordrecord-ings (A class). In the distinction between read and spontaneous speech, seven features (f1–f7) describing silent pauses were used. This choice was due to presence of this type of pauses in any recording (in contrast to filled pauses which are absent in read speech and breath pauses which are present
only in good quality recordings) and easiness of detecting them automatically. The silent pauses were found automat-ically using VAD and then, for each recording, a vector of seven features was calculated. Logarithmization and normalization of the parameters improved the results.
The best accuracy in this task was obtained using XGBoost classifier (Table 7). However, it should be noted that the dataset is imbalanced in terms of classes, and this classifier exhibits bias toward the read speech class which shows as increasing read speech recall and decreasing spontaneous speech recall in regard to less complex classi-fiers such as the decision tree. Nonetheless, all classiclassi-fiers perform better than if classification was done by chance (50 % accuracy), or by always indicating the class with higher count (65 % accuracy).
We observed that read speech was better recognizable than spontaneous speech (see Fig. 17), which we believe is partially a result of classification bias, but also a result of the higher diversity of spontaneous speech class examples.
5 Discussion
Majority of speaker recognition systems do not include suprasegmentals. High-level features of speech signal, like pauses, although statistically they were proved to be speaker-specific, are dependent also on other factors, like situational context, stress level, kind of linguistic task. This weakens their possible usage for speaker recognition. It should also be remembered that obtaining data on pauses requires much longer (than e.g. standard MFCC analysis) segment of continuous speech to perform analysis, which is not a desirable situation in a text-dependent system which operate on short utterances (e.g. one sentence). Relatively large observation period (at least one minute) sufficient for acquiring information on pausing style, con-straints applying the approach only to certain sort of
Fig. 12Differences in distribution of each feature between 3 groups of speakers (Ppresentations/orations,Ttranslation,Rradio transmissions)
Table 5Comparison of selected features for experienced and inexperienced speakers: average values and standard deviation (in brackets)
Parameter Professional speakers Inexperienced speakers
#words/minute 108 (23) 117 (26)
#words/sentence 17 (4) 22 (6)
#f_p/minute 4 (4) 10 (5)
n_p. [%] 12 (15) 13 (13)
s_p. [%] 26 (31) 24 (23)
f_p. [%] 10 (12) 34 (30)
biometric systems (text-independent systems or forensic applications).
The results obtained from testing a system based on pauses only (40 %) are similar to EER achieved in Peskin et al. test (36.1 to 43.3 % EER) using different pause-related features alone [16]. However, more types of models and classifiers should be tested in future works. Probably pauses would be better included into model using HMM chain, as applied in [25] or as a part of n-gram models [26].
This data is not enough in itself to perform biometric verification or identification of a speaker; however, it can be used to enhance speech technology applications by including additional information in speaker’s profile, such as the following: speaker breathes frequently, takes short breaths, makes filled pauses infrequently, etc.
In the second experiment, it was showed that the dis-tribution and structure of pauses in speech, represented by three parameters, are specific for the type of speech and sufficient to automatically classify them with 78 % accuracy. We showed that parameters such as a number of each pause type occurrences per minute or statistics of pause duration bring important information about speaker’s habits. Advantage of the approach is simplicity, low computational complexity and robust feature extrac-tion. Breath events [2] and filled pauses [23] can be automatically detected in a speech signal. It allows in-cluding the features easily in speech technology systems.
The obtained knowledge on pauses meaning can be merged with analysis of other temporal features (phoneme length, energy, fundamental frequency) in order to build algorithms for punctuation detection in speech. Since lack of punctuation and occurrence of disfluencies in
Fig. 14Performance of system based on pause-related features only
Fig. 13Performance of the baseline system Fig. 15Detection Error Trade-off plot for pause-based and MFCC-based systems and their fusion.
Table 6Results of automatic recognition of types of spontaneous speech
Type Precision Recall F1-score Support
P 0.71 0.91 0.80 11
T 0.78 0.70 0.74 10
R 1.00 0.67 0.80 6
spontaneous speech transcripts are factors that disturb their processing by natural language processing systems, parsers or information extraction systems, automatic ana-lysis of pauses can help to make spontaneous speech tran-scripts more readable for both human and NLP systems.
Finally, in the biomedical field, the research on pauses is meaningful in affect detection. All analyzed kinds of pauses carry information on speaker current emotional state. Frequency and regularity of pausing behavior, based on ob-tained models, is currently tested in the task of automatic emotion recognition. It can lead directly to include it in
systems for monitoring mental illnesses, since quantity and duration of silent pauses can be indicators of emotional state of the speaker or a measurable symptom of psychic disorders like schizophrenia or bipolar affective disorders. Measuring breath frequency in acoustic signal can be a cheap and easily available method for estimation of physical effort level, measure of physical fitness or diagnostics of po-tential respiratory dysfunctions (e.g. sleep apnea).
6 Conclusions
In this paper, we deliver the numerical description of pauses in Polish speech. Three types of acoustic pauses (silence, breaths and fillers), two types of punctuation marks (full stops and commas), and co-occurrences of acoustic and syntactic pauses were proved to be speaker dependent. Pausing behavior was investigated in several contexts (spontaneous speech during presentation, simultaneous interpretation, interview and read speech -reading a novel).
Connotations between pauses and punctuation, as well as frequency and types of pauses vary between individuals and depend on speaking style of each person, speech quality, culture, experience and preparation for oral presentations. Thereby, the temporal features can possibly be used as a valuable source of paralinguistic information. However, even though our results were better than similar previous studies, the differences were not sufficient to differentiate speakers. Verification of the hypothesis that they improve speaker recognition system was negative for scenario of modeling pauses with UBM and GMM models. Another modeling methods will be evaluated in future works.
An attempt to automatically recognize three types of spontaneous speech resulted in 78 % accuracy and distin-guishing read and spontaneous speech with 75 % accuracy,
Table 7Results of automatic recognition of read and spontaneous speech - comparison of classifiers
Classifier Type Precision Recall F1 score Accuracy
Decision tree Read 0.75 0.78 0.76 0.69
Spontaneous 0.56 0.52 0.54
Average 0.68 0.69 0.69
Logistic regression Read 0.74 0.86 0.80 0.71
Spontaneous 0.63 0.44 0.52
Average 0.70 0.71 0.70
SVM (RBF kernel) Read 0.75 0.88 0.81 0.73
Spontaneous 0.67 0.44 0.53
Average 0.72 0.73 0.71
Random forest Read 0.73 0.86 0.79 0.70
Spontaneous 0.61 0.41 0.49
Average 0.69 0.70 0.68
XGBoost Read 0.75 0.94 0.83 0.75
Spontaneous 0.79 0.41 0.54
Average 0.76 0.75 0.73 Fig. 16Confusion matrix for automatic recognition of type of spontaneous speech
using pause-related features only. This result shows useful-ness of pauses to distinguish between different situational context and cognitive task and therefore it could find appli-cation for automatic discourse analysis and conversation modeling purposes. Presented statistical models of pauses will be a fundament for studying usefulness of the informa-tion in different applicainforma-tions, like ASR or emoinforma-tion recogni-tion systems. Further research will cover also other reasons of pauses frequency and duration variability (a type of per-sonality of the speaker and emotional arousal). Feature vec-tor dimensionality will be reduced. Analyses will be also conducted on more regular sets of recordings, e.g., the same speaker in different situational contexts.
Acknowledgements
The project was supported by The Polish National Centre for Research and Development granted by decision 072/R/ID1/2013/03 and the National Science Centre support allocated on the basis of a decision DEC-2011/03/D/ST6/00914. This work was supported by the AGH University of Science and Technology under Deans Grant 15.11.230.252 and Statutory works 11.11.230.017.
Competing interests
The authors declare that they have no competing interests.
Author details 1
Department of Computer Science, Electronics and Telecommunications, AGH University of Science and Technology, Al. Adama Mickiewicza 30, 30-059 Kraków, Poland.2Techmo, Kraków, Poland.
Received: 28 November 2015 Accepted: 28 October 2016
References
1. F Batista, H Moniz, I Trancoso, N Mamede, A Mata, Extending automatic transcripts in a unified data representation towards a prosodic-based metadata annotation and evaluation. Journal of Speech Sciences2(2), 115–138 (2012) 2. M Igras, B Ziółko: Wavelet method for breath detection in audio signals. In:
IEEE International Conference on Multimedia and Expo(ICME 2013), San Jose (2013). doi:10.1109/ICME.2013.6607428
3. T Kendall,Speech rate, pause and linguistic variation: an examination through the sociolinguistic archive and analysis project. Doctoral dissertation(Duke University, Durham, 2009)
4. E Campione, J Véronis.(2002). A large-scale multilingual study of silent pause duration. In: Proceedings of the Speech Prosody Conference, 199–202 5. M Demol, W Verhelst, P Verhoeve. (2006). A study of speech pauses for
multilingual time-scaling applications. In: Proc. ISCA-ITRW Multiling, (Stellenbosch, South Africa).
6. I Homma, Y Masaoka, Breathing rhythms and emotions. Experimental physiology93(9), 1011–1021 (2008)
7. American Thoracic Society and American College of Chest Physicians, ATS/ ACCP Statement on cardiopulmonary exercise testing. American Journal of Respiratory and Critical Care Medicine167(2), 211–277 (2003)
8. V Rapcan, S D’Arcy, S Yeap, N Afzal, J Thakore, RB Reilly, Acoustic and temporal analysis of speech: a potential biomarker for schizophrenia. Medical Engineering & Physics32, 1074–1079 (2010)
9. D Baron, E Shriberg, A Stolcke. (2002). Automatic punctuation and disfluency detection in multi-party meetings using prosodic and lexical cues. In: Proceedings of the International Conference on Spoken Language Processing, 949–952
10. E Shriberg, A Stolcke, D Hakkani- Tür, G Tür, Prosody-based automatic segmentation of speech into sentences and topics. Journal Speech Communication - Special issue on accessing information in spoken audio archive32(1–2), 127–154 (2000)
11. WA Lea,Trends in speech recognition(Academic Press, New York, 1980) 12. V Ramanarayanan, E Bresch, D Byrd, L Goldstein, SS Narayanan, Analysis of
pausing behavior in spontaneous speech using real-time magnetic
resonance imaging of articulation. The Journal of the Acoustical Society of America126, 160–165 (2009)
13. T Kinnunen, H Li, An overview of text-independent speaker recognition: from features to supervectors. Speech communication52(1), 12–40 (2010) 14. B Ziółko, W Kozłowski, M Ziółko, R Samborski, D Sierra, J Gałka, Hybrid
wavelet-Fourier-HMM speaker recognition. International Journal of Hybrid Information Technology4(4), 25–41 (2011)
15. E Shriberg,Higher-level features in speaker recognition. Speaker Classification I. Lecture Notes in Computer Science / Artificial Intelligence (Springer, Berlin/ Heidelberg, 2007), pp. 241–259
16. B Peskin, J Navratil, J Abramson, D Klusacek, DA Reynolds, X Bing: Using prosodic and conversational features for high-performance speaker recognition: report from JHU WS'02. IEEE International Conference on Acoustics, Speech, and Signal Processing (2003). doi: 10.1109/ICASSP.2003.1202762
17. K Sönmez, E Shriberg, L Heck, M Weintraub. (1998). Modeling dynamic prosodic variation for speaker verification. In: Proc. ICSLP, 3189–3192 18. G Adami, Modeling prosodic differences for speaker recognition. Speech
Communication49(4), 277–291 (2007)
19. M Backes, G Doychev, M Dürmuth, B Köpf. (2010). Speaker recognition in encrypted voice streams. In: Proceedings of the 15th European Conference on Research in Computer Security, 508–523
20. J Lööf, C Gollan, H Ney. (2009). Cross-language bootstrapping for unsupervised acoustic model training: rapid development of a Polish speech recognition system. In: Proceedings of Interspeech, Brighton, 88–91 21. DA Reynolds, TF Quatieri, RB Dunn, Speaker verification using adapted
Gaussian mixture models. Digital Signal Processing10(1–3), 19–41 (2000) 22. J Pelecanos, S Sridharan: Feature warping for robust speaker verification. In:
Proc. Speaker Odyssey: the Speaker Recognition Workshop (Odyssey 2001), Crete, Greece, 213–218 (2001)
23. M Igras, B Ziółko,Different types of pauses as a source of information for biometry. Models and analysis of vocal emissions for biomedical applications: 8th international workshop (Firenze University Press, Firenze, 2013), pp. 197–200 24. K Barczewska, M Igras, Detection of disfluencies in speech signal. Challenges
of modern technology32(1–2), 3–10 (2013)
25. F Beritelli, A Spadaccini. (2012). Performance evaluation of automatic speaker recognition techniques for forensic applications. New Trends and Developments in Biometrics, 129–148
26. E Shriberg, L Ferrer, S Kajarekar, A Venkataraman, A Stolcke, Modeling prosodic feature sequences for speaker recognition. Speech Communication
46(3), 455–472 (2005)
27. B Zellner, Pauses and the temporal structure of speech, inFundamentals of speech synthesis and speech recognition, ed. by E Keller (Wiley, Chichester, 1994), pp. 41–62
28. E Shriberg: Spontaneous speech: How people really talk and why engineers should care. Proceedings of European Conference on Speech
Communication and Technology, Eurospeech, 1781–1784 (2005) 29. B. Ziółko, T. Jadczyk, D. Skurzok, P.Żelasko, J. Gałka, T. Pędzimąż, I. Gawlik, S.
Pałka .2015.“SARMATA 2.0 Automatic Polish Language Speech Recognition System”, Interspeech, Dresden,
30. P Kenny. (2012). A small footprint i-vector extractor. Odyssey 2012: 1–6 31. https://sites.google.com/site/bosaristoolkit/ Accessed: 30 May 2016 32. R Dufour, Y Estève, P Deléglise, Characterizing and detecting spontaneous
speech: application to speaker role recognition. Speech Communication56, 1–18 (2014)
33. A Tóth, Speech disfluencies in simultaneous interpreting: a mirror on cognitive processes. SKASE Journal of Translation and Interpretation5(2), 23–31 (2011) 34. B Tissi, Silent pauses and disfluencies in simultaneous interpretation: a
descriptive analysis. The Interpreters’Newsletter10, 103–127 (2000) 35. L Ten Bosch, N. Oostdijk, J P De Ruiter. (2004). Turn-taking in social talk
dialogues: temporal, formal and functional aspects. In 9th International Conference Speech and Computer (SPECOM'2004). 454–461
36. J H Friedman, Greedy function approximation: a gradient boosting machine. Annals of statistics,29(5), 1189–1232 (2001)
37. Pedregosa et al. (2011). Scikit-learn: Machine Learning in Python, JMLR 12, pp. 2825–2830
38. PŻelasko, B Ziółko, T Jadczyk, D Skurzok,“AGH Corpus of Polish Speech”. Language Resources and Evaluation50, 585–601 (2016)
![Fig. 4 Different types of pauses determining full stops and commas [23]](https://thumb-us.123doks.com/thumbv2/123dok_us/9588052.1941428/8.595.62.540.88.239/fig-different-types-pauses-determining-stops-commas.webp)