Procedia Computer Science 60 ( 2015 ) 730 – 739
1877-0509 © 2015 The Authors. Published by Elsevier B.V. This is an open access article under the CC BY-NC-ND license (http://creativecommons.org/licenses/by-nc-nd/4.0/).
Peer-review under responsibility of KES International doi: 10.1016/j.procs.2015.08.226
ScienceDirect
19
thInternational Conference in Knowledge Based and Intelligent Information and
Engineering Systems - KES2015
Automatic Detection of Polyp Using Hessian Filter and HOG
Features
Yuji Iwahori
a,∗, Akira Hattori
a, Yoshinori Adachi
a, M. K. Bhuyan
b, Robert J.
Woodham
c, Kunio Kasugai
daChubu University, 1200 Matsumoto-cho, Kasugai, 487-8501 Japan bIndian Institute of Technology Guwahati, Guwahati - 781039, India cUniversity of British Columbia, Vancouver, B.C. Canada V6T 1Z4 dAichi Medical University, 1-1 Yazakokarimata, Nagakute, 480-1195 Japan
Abstract
An endoscope is a medical instrument that acquires images inside the human body. This paper proposes a new approach for the automatic detection of polyp regions in an endoscope image using a Hessian Filter and machine learning approaches. The approach improves performance of automatic detection of polyp detection with higher accuracy. The approach uses HOG feature as a local feature since the polyp and non-polyp region often have similar color information. The approach also uses Real Adaboost and Random Forests as classifiers which works efficiently even when the dimension of feature vector becomes large. It is suggested that Hessian filter can contribute to reducing the computational time in comparison with the case when only HOG features are used to detect the polyp region. K-means++is introduced to integrate the detection results in the classification. It is shown that polyp detection with high accuracy is performed in the computer experiments with endoscope images.
c
2015 The Authors. Published by Elsevier B.V.
Selection and peer-review under responsibility of KES International.
Keywords: Polyp Defection; Hessian Filter; HOG feature; Real Adaboost; Random Forests; k-means++
1. Introduction
Medicine is an important area of application for computer vision. Endoscopy allows medical practitioners to observe the interior of hollow organs and other body cavities in a minimally invasive way. Diagnosis involves both shape detection and the assessment of tissue state. Here, we consider a general purpose endoscope, of the sort
∗Corresponding author. Tel.:+81-568-51-9378 E-mail address:[email protected]
© 2015 The Authors. Published by Elsevier B.V. This is an open access article under the CC BY-NC-ND license (http://creativecommons.org/licenses/by-nc-nd/4.0/).
still most widely used in medical practice. There are many different kinds of polyp shape and size in endoscope images. Polyps are usually found via endoscopy but polyps can be missed. The main factor to find polyp depends on the empirical skill of medical doctor. Automatic detection of polyps, with high accuracy, is an important aid to medical practice. Diagnosis typically requires polyp removal and biopsy.
Some previous approaches1,2,3 introduce features of Color Wavlet Covariance(CWC), Local Binary Pat-tern(LBP), Gray-Level Co-Occurrence Matrix(GLCM), which is used for the texture analysis, respectively. An-other approach4learns color andxyposition coordinates partitioned in the local window, then classifies if polyp is included or not in the each region. These are patch-based approaches and extract features and perform classifi-cation. Patch-based approach may include the problem detection ratio depends on patch size, size and position of polyp.
A patch-based approach5uses capsule endoscope image as input and extracts the Rotational Invariant Uni-form Local Binary Pattern (RIULBP), and statistical value obtained from intensity histogram as texture features. Classifier is designed to learn these features and polyp is detected. The approach has some difficulty that it is difficult to detect small polyp with non-textures.
On the other hand, the geometric feature is used in the approach6so that polyp appears with ellipse form in general. The approach detects polyp with only the ellipse fitting etc. without learning. Geometrical feature based approach is robust to the small polyp but some segmentation is necessary to detect polyp with edge information, that is the detection performance depends on the edge extraction level.
Another approach7which authors have proposed is Hessian Filter based approach, where Hessian filter em-phasizes the blob-like structure and extracts some polyp candidates with segmentation. Some texture-based fea-tures extracted from each polyp candidate region are classified with SVM and judged if polyp region or not. The approach is not patch-based approach and it makes possible to detect polyp region.
This paper improves the previous approach7to have the higher accuracy of polyp detection based on the edge-based features. It is shown that increasing the number of examples to learn the classifier using Real Adaboost and Random Forests have performed higher accuracy in classification.
2. Extraction of Polyp Candidate Regions Using Hessian Filter
The convexity and concavity of the image intensity surface itself is used to select candidate polyp regions. A Hessian filter is applied to the endoscope image to determine regions of convex and concave image intensity. The image is segmented based on the results of Hessian filtering. Low pass filtering, via Gaussian smoothing, is included to remove the effects of noise and texture.
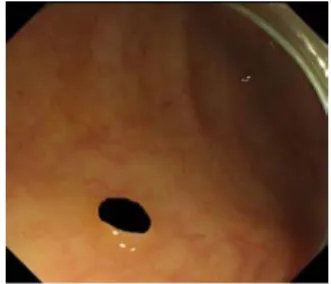
As a pre-processing, Fourier transform is applied to the gray scale image converted from the original RGB image to remove the high frequency components. Low pass filter is applied in the frequency space and inverse Fourier transform is applied. The effects of noise and texture of the surface can be removed and original image and low pass filtered image after the removal of high frequency components are shown in Fig.1 and Fig.2, respectively.
Fig. 1. Original Image Fig. 2. Low Pass Filtered Image
In paper8, tube-like image features arising from blood vessels are enhanced according to the eigenvalues,λ1,
λ2of the associated Hessian matrix as shown in Table 1. Here, the procedure to enhance blob-like structure is as follows:
Table 1. Eigenvalues of the Hessian Matrix (H=high,L=low,N=noisy)
λ1 λ2 pattern and structure
N N noisy, no preferred direction
L H− tube structure (bright) L H+ tube structure (dark)
H− H− blob-like structure (bright) H+ H+ blob-like structure (dark)
Step 1. Generate a Gaussian filter,G(x,y), with (width) scales.
Step 2. Generate filters for the partial derivatives,Gx(x,y),Gy(x,y), and the second partial derivatives,Gxx(x,y), Gxy(x,y) andGyy(x,y).
Step 3. Compute Lxx(x,y), Lxy(x,y) andLyy(x,y) as the convolution of input image, L(x,y), with Gxx(x,y), Gxy(x,y) andGyy(x,y) respectively. That is
Lxx(x,y) = Gxx(x,y)∗L(x,y) (1)
Lxy(x,y) = Gxy(x,y)∗L(x,y) (2)
Lyy(x,y) = Gyy(x,y)∗L(x,y) (3)
where∗denotes convolution.
Step 4. Compute the (2×2) Hessian matrix image,H, from Eqs.(1-3).
H= Lxx Lxy Lxy Lyy (4) Step 5. Calculate the eigenvalues,λ1,λ2, (λ1≤λ2), ofH
Step 6. Calculate the image,I(x,y), where
I(x,y)=λ1(x,y)2+λ2(x,y)2 ⎛⎜⎜⎜⎜⎜ ⎝1− λ1(x,y) λ2(x,y) 2⎞ ⎟⎟⎟⎟⎟ ⎠ (5)
Again, the classification table for pattern and structure based on the eigenvalues of the Hessian matrix is shown in Table 1. Here,Hcorresponds to the high (largest in magnitude) eigenvalue andLcorresponds to the low (smallest in magnitude) eigenvalue. H+ andH− denote the sign of the high eigenvalue,H+ ifH > 0 andH−ifH < 0,
respectively. Recall thatλ1≤λ2.
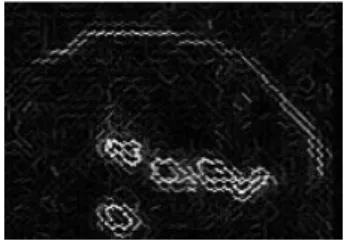
An example of an original endoscope image is shown in Fig.3. The corresponding image with blob-like structures enhanced is shown in Fig.4.
A Voronoi diagram based segmentation9 is used to generate candidate polyp regions. Segmentation with conservative (i.e., lower) threshold values is shown in Fig.5. Red points correspond to points with highest values while points with blue points correspond to points with lowest value. Segmentation with higher threshold values is shown in Fig.6. The segmentation shown in Fig.6 determines the candidate polyp regions.Final classification for whether each candidate region is a polyp or not is determined subsequently.
3. Extracting HOG Features
Previous approach7tried the down sampling to have the patch with constant size so that the number of dimen-sion of Histograms of Oriented Gradients (HOG) features10becomes constant. Proposed approach avoid down
Fig. 3. Original Image Fig. 4. Enhanced Image
Fig. 5. Segmented Image Fig. 6. Image of Candidate Polyp Regions
sampling and extracts local features with keeping the parameters of HOG features constant according to the size of candidate polyp region.
Endoscope image consists of polyp and non-polyp regions and change of color is small. Although it is not easy to treat the global edge features for the ellipse fitting, HOG features extract the oriented gradient of local intensity and it may be available to catch the difficult edge or shape conditions.
Gradientm(x,y) and its orientationθare calculated from the intensityI(x,u) at each pixel of input image.
m(x,y) = fx(x,y)2+fy(x,y)2 (6) θ(x,y) = tan−1fy(x,y) fx(x,y) (7) fx(x,y) = I(x+1,y)−I(x−1,y) fy(x,y) = I(x,y+1)−I(x,y−1) (8)
Weighted histogram of gradient of intensity is generated based on the gradientmand its directionθfor each cell ofp×ppixels. Hereθis quantized toNorientations, and the gradientmis added for each of orientation then histograms of oriented gradients are generated.
Finally, the histogram is normalized. Here each count of histograms are divided by the sum of HOG features in the cellq×q.
v(n) = v(n)
q×q×N
k=1 v(k)2+
(9)
wherev(n) representsn-th HOG feature andis a constant to avoid the division by 0. Moving this block with overlapping gives HOG features of input image.
For example, when the size of input image is h×w, the number of dimension of HOG features become (w
p −q+1)(hp−q+1)×q
Fig. 7. Input Image Fig. 8. HOG Features
4. Selection of Classifiers
The number of dimensions becomes very large in HOG features and It was necessary for the approach7to introduce feature selection with SVM11to perform the classification. While in the proposed approach, RealAd-aBoost12and Random Forests13are used as classifiers to perform efficient classification for the case of the larger number of dimension of features. This performance is evaluated for the comparison.
4.1. RealAdaBoost
Multiple classifiers are used to the classification using boosting approach. Boosting is an approach to construct a strong classifier by combining multiple weak classifiers which compensate with other classifiers to reduce the misjudged data. Here RealAdaBoost is introduced as this purpose and probabilistic density function is used as a weak classifier.
4.2. Construction of RealAdaBoost
Sample weightD1is initialized withN1 for theNlearning samples of (xi,yi). Weighted histogram is generated
for each feature of input dataxi. Here features are quantized into N levels and sample weightDt(i) is used as
added weight. W+j = i,yi=+1 Dt(i) (10) W−j = i,yi=−1 Dt(i) (11)
whereW+is weighted histogram of data fory=1,W−is weighted histogram of data fory=−1. When these two
histograms are not similar, these are separable weak classifiers. Bhattacharyya distance is calculated for these two histogram and evaluation value for each weak classifier is calculated.
z = 1−
j
W+jW−j (12)
Candidate weak classifier which gives the maximum of evaluation is taken the weak classifier at learning time
t. Here the output of weak classifier is defined by Eq.(13) andis a very small value to avoid division by 0.
h(x) = 1 2ln
W+j+
W−j+ (13)
Dt+1(i) = Dt(i)exp[−yiht(xi)] Dt+1(i) = NDt+1(i)
n=0Dt+1(n)
(14) Sum of these weak classifiers becomes the output for unknown data.
4.3. Random Forests
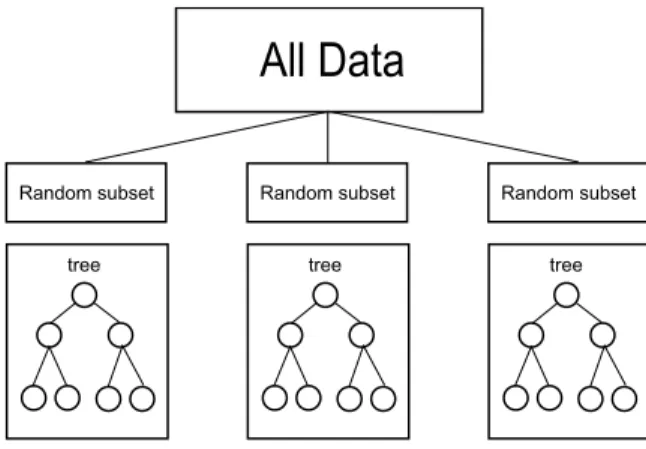
Random Forests is introduced to construct classifier with high accuracy by combining low correlated weak classifiers. Random forests use a decision tree as a weak classifier.
4.3.1. Construction of Random Forests
The whole learning data isSis learned with learning dataS0∈Swhich is randomly selected for each decision tree. Node of the learning dataS0allows the overlapping of data. Split function at node jof learning dataS0is given by Eq.(15).
h(v, θj) ∈ {0,1} (15)
vrepresents data which reached node j,θrepresents the parameter to decide the split function, whereθ=(φ, ψ, τ).
φmeans the filter which extracts several features fromd-dimensional datav,ψmeans the splitting criteria andτ means the threshold for the split. Decision tree is constructed until data splitting cannot be done anymore.
Majority voting of these weak classifiers become the output for unknown data.
Fig. 9. Random Forests
5. Integration of Detected Results
When the approach is applied for the detection of polyp in endoscope image, multiple rectangle for polyp candidate are detected. Here k-means++is used to integrate the detection results for improving accuracy.
5.1. k-means++
k-means++14is an algorithm to find the cluster center. Cluster center corresponds to the point which mini-mizes the variance inside classes, in other words, the point which minimini-mizes the squared sum of distance between the point and each data point inside a class. k-means++is an improvement of k-means. Point is randomly selected
and cluster center is determined. After that, data which has not been selected to cluster center become cluster cen-ter with the probability which is proportional to the distance between its nearest neighbor cluscen-ter cencen-ter and all data.
Example of result which k-means++is applied to the random data in shown in Fig.10. Blue corresponds to input data, red corresponds to the cluster center and connected line corresponds to the result of clustering.
Fig. 10. k-means++
6. Experiments
Endoscope image is used for evaluation of the proposed approach in the experiments.
6.1. Data Set
156 Endoscope images are used in the experiments, where small size of polyp has around 1000 pixels while large size of polyp has around 13000 pixels. Endoscope image resolution consists of 1000×900 pixels. Mask im-age which was manually made is used, whose example is shown in Fig.12. Here one positive sample is generated from polyp region while four negative samples are generated from non-polyp region. HOG features are extracted from positive sample under the condition that the center of mask and the center of detection window becomes the same point. On the other hand, negative sample is randomly determined under the condition that mask is not included inside detection window, then HOG features are extracted.
Considering the variation for the appearance of polyp, important issue is data set was increased by rotating the endoscope image from 0 degree to 160 degrees with 20 degrees step. The number of positive samples was 1404 and that of negative samples was 5616 as data set.
1053 samples among 1404 positive samples were randomly used for learning data while the remained 351 positive samples were used for test data. 1053 samples among 5616 negative samples were randomly used for learning data while the remained 4563 negative samples were used for test data. The number of weak classifiers was set to be 6000 and quantization level was set to be 100 as learning parameters of Real Adaboost.
Number of decision tree was set to be 5000 and number of dimension of features used in the decision tree was 151.
Fig. 13. Positive Samples
Fig. 14. Negative Samples
6.2. Results
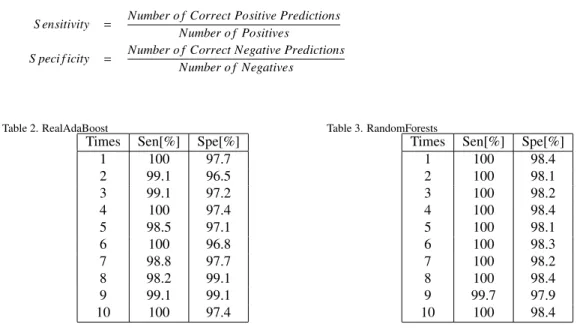
Experimental results are shown in Table 2 and Table 3. Sensitivity (Sen) represents the correct ratio for positive samples while Specificity (Spe) represents the correct ratio for negative samples. Learning data are randomly selected in each trial count.
S ensitivity = Number o f Correct Positive Predictions Number o f Positives
S peci f icity = Number o f Correct Negative Predictions Number o f Negatives
Table 2. RealAdaBoost
Times Sen[%] Spe[%] 1 100 97.7 2 99.1 96.5 3 99.1 97.2 4 100 97.4 5 98.5 97.1 6 100 96.8 7 98.8 97.7 8 98.2 99.1 9 99.1 99.1 10 100 97.4 Table 3. RandomForests
Times Sen[%] Spe[%] 1 100 98.4 2 100 98.1 3 100 98.2 4 100 98.4 5 100 98.1 6 100 98.3 7 100 98.2 8 100 98.4 9 99.7 97.9 10 100 98.4
It is shown that either of Real Adaboost and Random Forests performs high recognition ratio. Robust results are obtained based on the effect that the number of data set was increased with rotation of endoscope images which is robust to the appearance and various size of polyp.
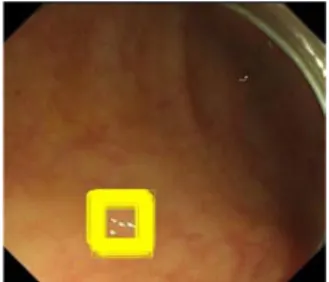
6.3. Example of Polyp Detection
Polyp detection is shown as example. The same number of positive samples and negative samples were randomly selected as learning data set except the test image. Initial number of clusters was set to be 10 as
parameter of k-means++. Result of polyp detection before applying k-means++is shown in Fig.15 and Fig.17, while that after applying k-means++is shown is Fig.16 and Fig.18.
Fig. 15. Result before Integration Fig. 16. Result after Integration
Fig. 17. Result before Integration Fig. 18. Result after Integration
It is shown that polyp was correctly detected from endoscope image. It is also shown that integration of detection region by k-means++works well.
6.4. Incorrect Detection of Polyp
Examples of incorrect detection of polyp are shown in Fig.19 and Fig.20.
Fig. 19. Failed Example 1 Fig. 20. Failed Example 2
The limitation of this proposed approach includes that negative samples are randomly selected from out of mask image from endoscope image. This sometimes affects the negative samples with low quality data. Region with specular reflectance or region with edge except polyp are some candidate where detection fails. It is consid-ered that the situation will be improved if these incorrect detection results are used for learning and recognition again
7. Conclusion
This paper proposed automatic detection of polyp using Hessian filter and HOG features. The approach introduced Real Adaboost and Random Forests as classifiers and it was shown that the approach performs the effective classification with the large dimensional number of features. k-means++is also introduced to integrate the detection results with clustering. Increasing data with rotation of endoscope images are effective to give robust results for polyp detection.
As the approach tends to detect the polyp with over detection, further subjects remains for preparing the data set for negative samples including the points with specular reflectance points or candidate points of edge except polyp regions to save the over detection of polyp.
Acknowledgements
Iwahori’s research is supported by JSPS Grant-in-Aid for Scientific Research (C) (26330210) and a Chubu University Grant. Woodham’s research is supported by the Natural Sciences and Engineering Research Council (NSERC). The authors would like thank lab member for their useful discussions.
References
1. S.Ameling, S.Wirth, D.Paulus, G.Lacey, F.Vilarino, “Texture-based Polyp Detecion in Colonoscopy”, Springer Berlin Heidelberg New York, pp.346-350, 2009.
2. S.Karkanis, D.Iakovidis, D.Maroulis, D.Karras, M.Tzivras, “Computer-aided tumor detection in endoscopic video using color wavelet features”, IEEE Trans. on Information Technology in Biomedicine, Vol.7, No.3, pp.141-152, 2003.
3. D.K.Iakovidis, D.E.Maroulis, S.A.Karkanis, A.Brokos, “A comparative study of texture features for thediscrimination of gastric polyps in endoscopic video”, In 18th IEEE Symposium on Computer-Based Medical Systems, pp.575-580, 2005.
4. L. A. Alexandre , N. Nobre and J. Casteleiro , “Color and Position versus Texture Features for Endoscopic Polyp Detection” , BMEI , Vol.2 , pp.38-42 , 2008.
5. Bao-Pu Li,Max Qinghu Meng , “Comparison of Several Texture Features for Tumor Detection in CE Images” , Journal of Medical Systems, Vol.36, No.4, pp.2463-2469 , 2011.
6. S.Hwang, J.H.Oh, W.Tavanapong, J.Wong and Piet C. de Groen, “Polyp Detection in colonoscopy video using elliptical shape featur”, International Conference on Image Processing , Vol.2, pp.465-468, 2007.
7. Yuji Iwahori, Takayuki Shinohara, Akira Hattori, R.J.Woodham, Shinji Fukui, M.K.Bhuyan, Kunio Kasugai, “Automatic Polyp Detection in Endoscope Images Using a Hessian Filter”, Prof. of MVA 2013, Health and Life, Vol.13, pp.21-24, 2013.
8. A. Frangi et al., “Multi scale vessel enhancement filtering” , in Proc., 1st MICCAI, pp.130-137, 1998.
9. A. Cheddadet al, “Exploiting Voronoi diagram properties in face segmentation and feature extraction” , Pattern Recognition, Vol.41, No.12, pp.3842-3859, 2008.
10. N. Dalal and B. Triggs, “Histograms of Oriented Gradients for Human Detection”, IEEE Int, Conf. on Computer Vision and Pattern Recognition (CVPR), pp.886-893, 2005.
11. V.Vapnik, “Statistical Learning Theory”, Springer-Verlag, New York, 1995 .
12. Bo Wu and Ram Nevatia, “Detection and Tracking of Multiple, Partially Occluded Humans by Bayesian Combination of Edgelet based Part Detectors”, International Journal of Computer Vision, Vision 75(2), pp.247-266, 2007.
13. Leo Breiman,ʠRandom Forestsʡ,Machine Lerning,Vol.45,No.1,pp.5-32,2001.
14. David Arthur and Sergei Vassilvitskii, “k-means++: The Advantages of Careful Seeding”, In Proceedings of the eighteenth annual ACM-SIAM symposium on Discrete algorithms, pp.1027-1035, 2007.