A b s t r a c t. The identification of four wheat varieties was performed by integrating machine vision and artificial neural net-work (ANN) using Matlab software. It was based on grain morpho-logy and colour. In order to capture images from the samples, a cham-ber of imaging was developed and a program was coded in Matlab for segmentation of the samples. Area and 4 factors for describing shapes of grain were chosen as morphology features. For colour features, average, variance, skewness and kurtosis values of ima-ges in RGB and l*a*b* colour spaces were extracted. Eleven featu-res of the 280 images were used in the training stage of ANN, 40 images for validation, and testing of the ANN was performed with 80 images. The overall success classification rate was 95.86%.
K e y w o r d s: wheat, classification, image processing, machine vision, artificial neural network
INTRODUCTION
The world production of wheat in 2007 was 607 million tons (FAO, 2007). The primary use of wheat is to produce food for humans. Since different food products are made from the different classes of wheat, the identification of wheat variety is crucial (Beuerlein, 2001). Variety identi-fication is also important for plant breeders and geneticists (Shoucheet al., 2001). The identification of wheat varieties requires experts, which is not economical in terms of time and cost. Moreover, sometimes wheat varieties are so simi-lar to each other that identification is not easy. Machine vision is a promising technology for rapid identification and automation of grain handling. With the recent advances in the computational power and memory of personal compu-ters, machine vision systems can be employed for online in-spection of agricultural products (Choudharyet al., 2008).
Like visual identification work, automatic classification should be based on knowledge of seed size, shape and colour. Numerous image processing algorithms have been
developed for extracting these features from seed images (Cox and Budhu, 2008; Satishet al., 2006; Shatadal and Tan, 2003; Utku, 2000). The colour feature is an effective factor that was employed for seed classification by many re-searchers. Majumdar and Jayas (2000b) developed an algorithm based on colour features to classify individual kernels of Canadian wheat varieties. A machine vision system with a monochrome camera was used to identify eight Western Canadian wheat classes at four moisture levels (11, 14, 17 and 20% w.b.) by bulk sample analysis. Colour was measured in L*a*b* colour model, the L*, a* and b* values denoting brightness (black to white), green-ness-redness and blueness-yellowness, respectively (Mani-ckavasaganet al., 2007). Sometimes, the colour of varieties is so similar that detecting them is not possible based on the colour. In these cases, for recognition of varieties the mor-phological features can be used. Shouche et al. (2001) quantised shape variation in Indian wheat varieties by digital image analysis using custom-built software. It was based on morphological features. Emadzadehet al.(2010) determi-ned arithmetic mean diameter, geometric mean diameter and sphericity of three Iranian rice varieties at different processing levels using micrometer and image processing methods. A machine vision (MV) was developed in Java for orthogonal length and width determination of particles from digital images (Igathinathane et al., 2009). An algorithm was developed based on morphological features to classify individual kernels of Canadian Western Red Spring (CWRS) wheat, Canadian Western Amber Durum (CWAD) wheat, barley, oats, and rye (Majumdar and Jayas, 2000a). Models based on a combination of grain morphology, texture, and the colours were developed for recognition of grain (Fang and Yi-bin, 2004; Granittoet al., 2005; Shahin and Symons, 2003; Wan et al., 2002; Wu et al., 2007). A total of 230
Wheat class identification using computer vision system and artificial neural networks
A. Arefi*, A. Modarres Motlagh, and R. Farrokhi Teimourlou
Department of Farm Machinery, Urmia University, Urmia, Iran
Received August 25, 2010; accepted November 23, 2010
© 2011 Institute of Agrophysics, Polish Academy of Sciences
*Corresponding author’s e-mail: [email protected]
A A
Agggrrroooppphhyhyysssiiicccsss
features (51 morphological, 123 colour, and 56 textural) were extracted for classification of five grain types (Paliwal et al., 2003). The morphological, colour, textural, and wave-let features were extracted from colour images for classifi-cation of cereal grains (Choudharyet al., 2008). Tahiret al. (2007) developed an algorithm to evaluate the effect of moisture content on the classification capability of imaged grains. Yaoet al. (2009) developed an automatic system relying on machine vision to evaluate rice appearance quali-ty including rice chalkiness and shape. Visenet al. (2002) used morphology and colour features for classification of Canadian grain.
The idea of integrating machine vision (IMV) with ANN techniques was conceived in the mid 1980s (Batchelor, 2004). There are many literature reports which combine machine vision and ANN for classification of grain seeds. The nine different neural network architectures were used to classify five kinds of cereal grains (Paliwalet al., 2001). Weeet al. (2009) used a subset of Zernike moments (ZM) and a multi-layer perceptron for rice sorting process. Kiliçet al. (2005) developed a computer vision system for the quality inspection of beans, based on size and colour quantification of samples. Average, variance, skewness and kurtosis values were determined for each channel of RGB (red, green and blue) colour format. ANN were used for colour quantification of the samples. The automated system was able to correctly classify 99.3% of white beans, 93.3% of yellow-green damaged beans, 69.1% of black damaged beans, 74.5% of low damaged beans and 93.8% of highly damaged beans.
The aim of this research was to introduce an algorithm based on morphology and colour properties for classifi-cation of four Iranian wheat varieties.
MATERIALS AND METHODS
Four major wheat varieties, Zarin, Sardari, Rasad and 101Parvareshi that farmers use widely in the Western and North Western region of Iran, were used (Fig. 1). More than 1kg from each variety was obtained as a sample from several provinces such as Kurdistan, West and East Azerbaijan of Iran. The grains were cleaned manually to remove non-grain matter and damaged grains.
A chamber was made to take some pictures from the samples. The size of the chamber was 40×40×40 cm. A cir-cular fluorescent lamp was placed above the chamber to provide proper light. Wheat samples were placed on the holder. In order to eliminate the shadow, the holder was covered with black material. Moreover, wheat grains were separated manually to eliminate grain contact. A charge coupled device (CCD) camera (Sony Cyber Shot w200) was located in the centre of the box and 12 cm above the sample holder. 100 images were taken with 972×1296 pixels resolu-tion for each variety. The images were transferred to a com-puter (2.2 GH processor and 1 GB RAM) for subsequent analysis.
Preprocessing operation was necessary in the beginning of algorithm development to eliminate the noises that appear on the images. For this purpose, the following steps were performed:
a b
d c
– obtaining binary images from red channel image of the sample using Matlab functionim2bw.
– removing objects that touched the border of an image using Matlab functionimclearborder.
– removing noise using Matlab functionimerodeand then reconstruction of image usingimreconstruct.
– filling the holes using Matlab functionimfilling. – multiplying binary image in red, green and blue channel. – compositing three red, green and blue channels to create
colour picture.
The result of above steps is shown in Fig. 2b.
Recognition of wheat varieties was carried out based on the colour and morphology parameters. For distinguishing wheat varieties based on colour, the RGB, HSI1(hue, saturation and intensity), Nrgb2(R/R+G+b, G/R+G+b, B/R +G+b), Ycrcgcb3(Y=0.3R+0.6G+0.1B, cr=R-Y, cg=G-Y, cb=B-Y), I1I2I34(I1= R+ G+B/3, I2=R-B/2, I3=2G-R-B/4) and l*a*b*colour spaces were used.
Moment analysis was used for the estimation of the parameters of intensity distribution (Mattson and Pandit 2006). These features are shown in Table 1. In general, about ninety features were extracted for each image. Then, in order to select the best effect feature as ANN input, all of the features were imported to the Microsoft Office Excel 2007 environment. The 6 selected features as ANN input are: mean (a*), kurtosis (a*), mean blue), mean (red-green), skewness (green) and variance (red-green).
It should be mentioned that the pixels with zero value were not considered in extracting features.
The morphological parameters were extracted to the following:
– obtaining binary image from red channel. – labelling pixel groups.
The morphology characteristics of each individual wheat were obtained using the Matlab functionregionprops
with the help of other functions (Table 1). In order to select the best effect feature as ANN input, all of the features were imported to the Microsoft Office Excel 2007 environment. Finally, area, ratio of area to major axis (shape factor 1= area/major axis), ratio of area to perimeter (shape factor 2=
4*pi*area/primeter^2), ratio of equivalent diameter to major axis (shape factor 3= EquiDiameter (the diameter of a circle with the same area as the region)/major axis) and ratio of major axis to minor axis (shape factor 4= major axis/minor axis) were selected as ANN input.
The means of the morphology characters were obtained in each of the pictures. As an example, if there were 10 wheats in a picture, morphology characters of each wheat was obtained, and then the mean of the morphology characters of all the wheats were computed as a final result.
Matlab ANN toolbox was used and a feed forward neural network model which is commonly used to solve classification problems was tested. Input and two hidden layers contained 10 and 15 neurons, respectively, and output layer contained 4 neuronsiethe topology of the network was 11-10-15-4. Tansig transfer functions were used for all layers. Matlab train function was used for the network training by using 280 images. Moreover, 40 images were used for validation and 80 for testing of the network. Training was performed to minimize the mean square error (MSE) between targets and outputs.
RESULTS AND DISCUSSIONS
The results showed that the colour and morphological features alone were not able to recognize four wheat varie-ties with high accuracy. However, the combination of these two features showed acceptable results. The colour of wheat grain varies from yellow to brown. The colour of Zarin and Sardari varieties was almost similar (yellow and light yellow, respectively) and the colour of two other varieties was also almost similar (brown and light brown).
The extracted features from HIS, Nrgb, Ycrcgcb and I1I2I3showed that they had overlapped so much that these
features could not differentiate among the wheat varieties. They not only improved the accuracy of classification but also might have increased the processing time and complexion of ANN. On the other hand, the RGB and l*a*b* colour models showed that they were suitable to distinguish the wheat varieties.
Fig. 2.Example of image preprocessing operations: a – original colour image of wheat, b – result of image preprocessing operations.
The101Parvareshi and Zarin wheat had relatively less overlapping with other varieties in mean (a*) feature. The 101Parvareshi wheat had the highest mean (a*) value and Zarin had the lowest mean (a*) value (Fig. 3a). The kurtosis (a*) feature could be used for distinguishing Zarin wheat with low accuracy because, in this case, Zarin had the lowest overlap with other varieties. The kurtosis value could not help in recognizing other wheats because they were over-lapping completely (Fig.3b). It can be observed that the Mean (red-blue) feature can be used in distinguishing Rasad wheat. The Rasad wheat had the lowest overlap with other varieties (Fig. 3c). Since the 101Parvareshi had the lowest overlap with other varieties in mean (red-green) value, it could be an effective feature for recognizing 101Parvareshi variety. The mean (red-green) value would be suitable to recognize Zarin wheat, too (Fig. 3d). The skewness (green) was another feature that gave enough difference to re-cognize Rasad wheat because it had the lowest overlap with other varieties (Fig. 3e). Variance (red-green) was the feature that placed wheat varieties in two classes. The 101Parvareshi and Rasad wheat had the highest variance (red-green) value and were placed in one class, while Zarin and Sardari were placed in the other class (Fig. 3f).
From all of the considered colour features, there were no features that could help in distinguishing Sardari wheat from other wheat.
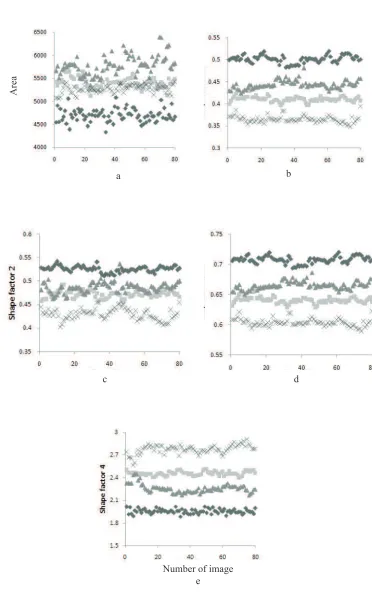
Area gave the lowest value for Zarin wheat with consi-derable difference from other varieties. Rasad wheat had the highest area value and a little overlap with Sardari wheat so it could be concluded that area was an effective factor for recognizing Zarin and Rasad wheat (Fig. 4a). Shape factor 1 could benefit for recognizing all of the varieties. But Sardari
wheat had a little overlap with Rasad wheat; therefore, the combination of this factor and skewness (green) can give better result for recognizing Sardari wheat (Fig. 4b). Shape factor 2 gave a significant difference for recognizing 101Parvareshi and Zarin wheat. The other two varieties had overlap; so shape factor 2 was not suitable for recognizing them (Fig. 4c). Shape factor 3 was as good as shape factor 1. Simultaneous use of these two factors could be effective for more accurate identification of Sardri wheat (Fig. 4d). In the case of shape factor 4, all of the varieties had a little overlap. Therefore, it can be an appropriate factor to be used as ANN input (Fig. 4e).
Morphological features were better than colour features in recognizing wheat varieties. But using only morpholo-gical features for identification of wheat varieties could not provide good results; therefore, it was decided to use the combination of colour and morphology features for recogni-zing wheat varieties.
ANN was trained using 280 samples and validated by 40 samples. Eleven features (morphology and colour feature) were used as input data. Training was validated automati-cally at 56 iterations. Another group of samples (80 samples) was used for testing the developed system. The performance of the system for the classification of Zarin, Sardari, Rasad and 101Parvareshi (correct classification ratio) was 97.26, 91.63, 96.9 and 97.65%, respectively.
The most factors separated 101Parvareshi wheat with con-siderable difference from other wheat. Therefore, the deve-loped system could recognize it with the highest accuracy. For the same reason Zarin wheat got the second highest accuracy. The system could recognize two other varieties with acceptable accuracy, too, although they were over-lapping in many factors.
Colour Morphology
Colour models Feature description Feature equation Feature description
Mean m =
= å
1
1
Ni Xi
N Area 2m*major axis/perimeter
Bounding box 2m*minor axis/perimeter
RGB HIS L*a*b*
Nrgb Ycrcgcb
i1i2i3
Standard deviation s = V
Major axis Equivalent diameter /perimeter
Minor axis area/ bounding box
Variance V N i Xi
N
=
- å=
-1 1
2 1
( m) Perimeter major axis*minor axis/area
Eccentricity area/(minor axis*major axis)*m
Skewness s N i Xi
N = -= å 1 1 3 1 3
( m)
s
Convex area shape factor 1
Area/minor axis shape factor 2
Kurtosis k N i Xi
N = -= å 1 1 3 4 1 4
( m)
s
Solidity shape factor 3
Equal diameter shape factor 4
Fig. 3.Analysis of colour for wheat varieties: a – mean (a*), b – kurtosis (a*), c – mean (red-blue), d –mean (red-green), e – skewness (green), f – variance (red-green)¿Zarin,¾Sardari,pRasad x101Parvareshi.
a b
d c
Number of image f
Number of image e
Skewness
(green)
Mean
(red-blue)
Mean
Fig. 4.Analysis of morphology for wheat varieties: a – area, b – shape factor 1, c – shape factor 2, d – shape factor 3, e – shape factor 4. Explanations as in Fig. 3.
a b
d c
Area
CONCLUSIONS
1. The results of analysis of about 100 images for each variety showed that RGB and l*a*b* colour models were more effective than other colour models. Average, variance, skewness and kurtosis values were the features determined for each channel of RGB and l*a*b*.
2. Morphology features such as area and shape factor 1 to Shape factor 4 were suitable for identification of wheat varieties. Shape factor 1 and shape factor 3 were the only features that could identify the Sardari wheat from other varieties.
3. Colour features could not distinguish Sardari variety, and were not appropriate for discrimination of other varie-ties, because varieties had some overlap together. Therefore, it was necessary to use morphology features. The results showed that the composite of colour and morphology was acceptable in recognizing wheat varieties.
4. Zarin and 101Parvareshi were recognized with ma-ximum accuracy because there were many factors that com-pletely separated them from other varieties. Although two other varieties were placed mostly on each other and recogni-zing them was difficult, the ANN was able to recognize them successfully. The system recognized wheat with: Zarin – 97.26, Sardari – 91.63, Rasad – 96.9 and 101Parvareshi – 97.65%. The overall classification success rate of the system was 95.86%.
REFERENCES
Batchelor B.G., 2004.Intelligent image processing. In: Machine Vision for the Inspection of Natural Products. (Eds M. Graves, B. Batchelor). Springer Press, London, UK.
Beuerlein J., 2001.Classes and uses of wheat. http://ohioline.ag. ohio-state.edu
Choudhary R., Paliwl J., and Jayas D.S., 2008.Classification of cereal grains using wavelet, morphological, colour, and textural features of non-touching kernel images. Biosys. Eng., 99, 330-337.
Cox M.R. andBudhu M., 2008.A practical approach to grain shape quantification. Eng. Geol., 96, 1-16.
Emadzadeh B., Razavi S.M.A., and Farahmandfar R., 2010.
Monitoring geometric characteristics of rice during proces-sing by image analysis system and micrometer measure-ment. Int. Agrophys., 24, 21-27.
Fang C. and Yi-bin Y., 2004.Machine vision inspection of rice seed based on Hough transform. J. Zhejiang Univ. SC1., 5(6), 663-667.
FAO, 2007. FAOSTAT database. http://faostat.fao.org/faostat/. Retrieved October 12, 2010.
Granitto P.M., Verdes P.F., and Ceccatto H.A., 2005. Large-scale investigation of weed seed identification by machine vision. Comp. Electr. Agric., 47, 15-24.
Igathinathane C., Pordesimo L.O., and Batchelor W.D., 2009.
Major orthogonal dimensions measurement of food grains by machine vision using image. J. Food Res. Int., 42, 76-84. Kýlýç K., Boyacý Ý.H., Köksel H., and Küsmenoðlu Ý., 2005.A
clas-sification system for beans using computer vision system and artificial neural networks. J. Food Eng., 78, 897-904.
Majumdar S. and Jayas D.S., 2000a. Classification of cereal grains using machine vision: I. Morphology models. Am. Soc. Agric. Eng., 43(6), 1669-1675.
Majumdar S. and Jayas D.S., 2000b.Classification of cereal grains using machine vision: II. Colour models. Am. Soc. Agric. Eng., 43(6), 1677-1680.
Manickavasagan A., Sathya G., Jayas D.S., and White N.D.G., 2007.Wheat class identification using monochrome images. J. Cereal, 47, 518-527.
Mattson S.G. and Pandit S.M., 2006. Statistical moments of autoregressive model residuals for damage localization. Mech. Systems Signal Proc., 20, 627-645.
Paliwal J., Visen N.S., and Jayas D.S., 2001.Evaluation of neural network architectures for cereal grain classification using morphological features. J. Agric. Eng. Res., 79(4), 361-370.
Paliwal J., Visen N.S., Jayas D.S., and White N.D.G., 2003.
Creal grain and dockage identification using machine vision. Biosys. Eng., 85(1), 51-57.
Satish B., Tapan K.B., Maqsood A., and Pratyush C.P., 2006.
The determination of morphological and textural features of rice grains in a sample using digital image processing technology and the classification of the rice grains in the sample. ASABE Paper No. 066009, St. Joseph, MI, USA.
Shahin M.A. and Symons S.J., 2003.Lentil type identification using machine vision. Can. Biosys. Eng., 45,3.5-3.11.
Shatadal P. and Tan J., 2003.Identifying damaged soybeans by color image analyses. Appl. Eng. Agric., 19(1), 65-69.
Shouche S.P., Rastogi R., Bhagwat S.G., and Jayashree K.S., 2001. Shape analysis of grains of Indian wheat varieties. Comp. Electr. Agric., 33, 55-76.
Tahir A.R., Neethirajan S., Jayas D.S., Shahin M.A., Symons S.J., and White N.D.G., 2007.Evaluation of the effect of moisture content on cereal grains by digital image analysis. Food Res. Int., 40, 1140-1145.
Utku H., 2000.Application of the feature selection method to dis-criminate digitized wheat varieties. J. Food Eng, 46, 211-216.
Visen N.S., Palliwal J., Jayas D.S., and White N.D.G., 2002.
Specialist neural networks for cereal grain classification. Biosys. Eng., 82(1), 151-159.
Wan Y.N., Lin C.M., and Chiou J.F., 2002.Rice quality clas-sification using an automatic grain quality inspection system. Trans. ASAE., 45, 379-387.
Wee C.Y., Paramesran R., and Takeda F., 2009.Sorting of rice grains using Zernike moments. J. Real-Time Image Proc., 4, 353-363.
Wu Y.H., Liu M.H., Yang J., and Zheng H.D., 2007.Rice outer-quality inspect ion based on computer vision. Trans. Chinese Soc. Agric. Machinery, 38, 107-111.