Comparative Evaluation of Stress Distribution within Computerized Bone Model IJPCDR
Comparative Evaluation of Stress Distribution within
Computerized Bone Model using Four Different Implant
Collar Designs: A Three-dimensional Finite Element Analysis
1Amit B Jadhav, 2Pronob K Sanyal, 3Siddharth S Gosavi, 4Abhijeet R Kore, 5Swapnil S JadhavIJPCDR
ORIgInal ReseaRCh
10.5005/jp-journals-10052-0001
INTRODUCTION
The ideal goal of modern dentistry is to restore the patient to normal function, comfort, esthetics, speech, and health.1
Though the science of restoration of missing teeth is as old as 300 BC with the Egyptians employing a variety of methods to secure the prosthetic teeth, the successful replacement of lost natural teeth by dental implant is a major advance in dentistry.2
The success or failure of dental implants depends on various complex interwoven factors such as bone quan-tity, bone quality, surgical techniques, implant designs, and surface- and host-related factors, etc.3 As a result of
continued research, diagnostic tools, treatment planning, implant designs, materials, and techniques, predictable success is now a reality for the rehabilitation of many challenging clinical situations.1 Long-term success rates
as high as 95% for mandibular implants and 90% for maxillary implants have been reported.3
Finite element model has become one of the most successful engineering computational methods and most useful analysis tool since the 1960s.4,5 It is showing
overwhelming capability and versatility in its applica-tion in dentistry.6,7 The basic concept is that a body or a
structure may be divided into smaller elements (“finite elements”) connected at a finite number of joints called “nodes” (“nodal points”). Calculations are formulated and combined to obtain the solution for the entire body or structure.
So the purpose of the study was to evaluate the stress distribution within two different bone densities (D2, D3) by using four different implant collar designs (straight, divergent, convergent, and step) to evaluate which collar design causes minimum crestal bone loss, in order to give long-lasting restoration to the patient.
AIMS AND OBJECTIVES
• The aim of this study was to evaluate the effect of
four types of collar design on stress distribution in a computerized bone model under vertical and angular load and also to evaluate which plat- form design evokes a better response on a mechanical basis.
1,5Postgraduate Student, 2Professor and Head, 3Professor 4Assistant Professor
1-5Department of Prosthodontics and Crown & Bridge School of Dental Sciences, Krishna Institute of Medical Sciences Deemed University, Karad, Maharashtra, India
Corresponding Author: Amit B Jadhav, Postgraduate Student, Department of Prosthodontics and Crown & Bridge School of Dental Sciences, Krishna Institute of Medical Sciences, Deemed University, Karad, Maharashtra, India e-mail: [email protected]
ABSTRACT
Aim: To evaluate the effect of four types of implant collar designs on stress distribution in a computerized bone model under vertical and angular load and also to evaluate which platform design evokes a better response on a mechanical basis.
Implant collar designs are one of the most likely causes of early implant bone loss. This bone loss mostly occurs in the crestal region. The amount of stress applied and the amount of crestal bone loss vary with the type of collar design used. In this study, a new step collar design is added to evaluate stress distribution within bone.
Materials andmethods: A finite element model of threaded implant with four different kinds of platform designs (divergent, straight, convergent, and step) with their corresponding suprastructure embedded within the bone was created. Different test conditions incorporating the four types of platform designs under separate 500 N, axial, and 45° oblique forces were created to investigate the stress distribution within the computerized bone model. The three-dimensional finite analysis study was selected since it is useful in determining stress distribution around the dental implant and also bone response to vertical and angulated load.
Results: Divergent collar design shows minimum and convergent collar design shows maximum stresses concentrated at cortical bone for all collar designs under vertical and oblique loading.
Conclusion: Divergent collar design resists the crestal bone loss, gives better response on a mechanical basis, and may be more suitable in both D2 and D3 types of bones.
Keywords: Implant collar design, Stress distribution, Three-dimensional finite element analysis.
How to cite this article: Jadhav AB, Sanyal PK, Gosavi SS, Kore AR, Jadhav SS. Comparative Evaluation of Stress Distribution within Computerized Bone Model using Four Different Implant Collar Designs: A Three-dimensional Finite Element Analysis. Int J Prev Clin Dent Res 2016;3(1):1-5.
Source of support: Nil
bone model under vertical and angular load.
• Comparison of stress distribution of divergent,
straight, convergent, and step collar designs in a com-puterized bone model under vertical and angular load.
MATERIALS AND METHODS
This study was conducted using a three-dimensional (3D) finite element model to evaluate the pattern of stress distribution in a mandibular section of bone with a missing first molar restored with an implant-supported all-ceramic crown.
The study was carried out under the following steps:
• Construction of the geometric model. • Preparation of the finite element mesh. • Application of the material properties. • Application of boundary conditions. • Application of different loads. • Analysis of stress pattern.
Construction of the Geometric Model Modeling of the Bone
D2 and D3 bones with similar anatomy as that of the human mandible representing the section of the mandible in the first molar region were modeled with cortical and cancellous bone. The only difference between the D2 and D3 model was thickness of the cortical bone, which is 2 and 1 mm respectively.
Modeling of Implant Body
A straight implant with the dimensions 4 × 15 mm was used. The implant was divided into implant body and implant collar, with lengths 13 and 2 mm respectively. The implant body had a coronal diameter of 4 mm and apical diameter of 3.5 mm.
All implant models had buttress thread design of spiral type along the implant body length with following specifications:
• Thread pitch: 0.8 mm • Thread depth: 0.36 mm • Thread width: 0.25 mm • Apical face angle: 45° • Thread helix angle: 7°.
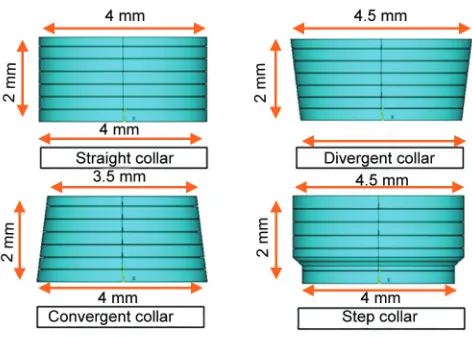
Modeling of Implant Collar
The four different implant collar designs modeled were straight, divergent, convergent, and the new step design (Fig. 1). Each implant collar had the same diameter at the implant collar interface (4 mm) and same height (2 mm).
Only the diameter at the collar abutment interface was different, as follows:
• Straight: 4 mm • Convergent: 3.5 mm • Divergent: 4.5 mm • Step: 4.5 mm
All implant collar designs had microgrooves of parallel type along their length. Implant collar features
a 0.2 mm machined coronal aspect followed by a 1.8 mm
surface with microgrooves. The six microgrooves are circumferential with a depth of 0.06 mm, pitch of 0.3 mm, and width of 0.02 mm.
Modeling of Implant Abutment
A cone-shaped convergent implant abutment was modeled having a diameter of 3 mm at the abutment collar interface and a height of 5 mm.
Modeling of Crown
Full ceramic crown for mandibular 1st molar was modeled. After modeling all the models were assembled to form a single unit.
Preparing of the Finite Element Mesh
All assembled units were subjected to meshing with the help of hypermesh 11 software. The models showed a
number of elements ranging from 500,718 to 550,898 and a number of nodes ranging from 92,228 to 100,312.
Application of the Material Properties
All materials used in the model, such as vital tissues (cortical, cancellous bone) and implant with superstructure were presumed to be homogenous, isotropic, and linear
elastic. The Poisson’s ratio (ν) and Young’s modulus (E)
of elasticity of the material were incorporated into the model.
Comparative Evaluation of Stress Distribution within Computerized Bone Model IJPCDR
The corresponding elastic properties, such as Young’s modulus and Poisson’s ratio were determined according
to literature survey.3
Application of Boundary Conditions
The model was fixed at the base. A support was provided at the inferior surface of the model and also at the distal ends of the mandibular section to simulate the action of the muscles and ligaments.
Application of Different Loads
The applied forces were static. Vertical as well as oblique forces were considered as the latter represent more realistic occlusal forces.3 Loads applied were as follows:
• Vertical forces of 500 N was applied at centric fossa.8
• Oblique forces of 500 N was applied along the lingual
inclination of buccal cusps in the linguobuccal
direction at 30° angle.9
Analysis of Stress Pattern
The Von Mises stress analysis was done. A total of four models of implant were prepared, which were tested for
Von Mises stress by applying vertical and angular load
of 500 N in D2 and D3 types of bone. Von Mises stress
values are defined as the beginning of the deformation for ductile materials, such as metallic implants. Failure occurs when Von Mises stress values exceed the yield strength of an implant material. Therefore, they are important for interpreting the stresses occurring within the implant material.
RESULTS
The stress analysis executed by Ansys software provided results that enabled the tracing of Von Mises stress field in the form of color-coded bands. Each color band represents a particular range of stress value, which is given in
mega-Pascals (MPa). Blue and red colors represent minimum
and maximum stress respectively. It was found that stresses were concentrated at crestal bone and implant collar for all models.
Figures 2A to D shows Von Mises stress generated within the bone for a straight collar design in D2 quality bone during vertical and oblique loading. In D2 type
of bone, maximum stresses were 23.91 and 135.45 MPa observed at cortical bone and 45.31 and 494.50 MPa
Figs 2A to D: Von Mises stress generated for straight collar designs in D2 quality bone (A and B) within a cortical bone and (C and D) within implant collar
A
C
B
observed at implant collar under vertical and oblique loading respectively.
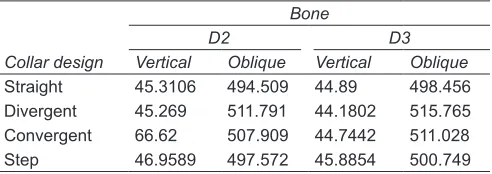
Table 1 shows Von Mises stress at implant collar in D2 and D3 bone during vertical and oblique loading. Results with green color show minimum stress and with red show maximum stress. Results do not show any significant difference between the stresses obtained for each collar design.
Table 2 shows Von Mises stress at crestal bone in D2 and D3 bone during vertical and oblique loading. Divergent collar shows minimum stress and convergent collar shows maximum stress. Results show a significant difference for each collar design. Divergent collar design shows minimum and convergent collar design shows maximum stresses concentrated at the cortical bone for all collar designs under vertical and oblique loading.
DISCUSSION
Micromovement of an endosteal dental implant and excessive stress at the implant bone interface have been suggested as potential causes for peri-implant bone loss and failure of osseointegration.10 In a 3-year
longitudinal study of successful dental implants, Van Steenberghe et al11 reported an average loss of marginal
bone of 0.4 mm during the first year following implant placement and 0.03 mm per year during the second and third years.
In this study all the optimum conditions were taken into consideration. First of all bone conditions D2 and D3 were chosen as these types of bone most commonly are found in the mandibular posterior region. In D2, a thick layer (2 mm) of compact bone surrounds a core of dense trabecular bone. In D3, a thin layer (1 mm) of cortical bone surrounds a core of dense trabecular bone of favorable strength.3
Commercially pure titanium is used as the implant material as it is the most biocompatible material used for any endosseous implant. Kong et al12 considered 0.8 mm
as the optimal thread pitch for achieving primary stability and optimum stress production and the optimal thread height ranged from 0.34 to 0.5 mm and thread width
between 0.18 and 0.3 mm, with thread height being more
sensitive to peak stresses than thread widths. Therefore,
a pitch of 0.8 mm, thread depth of 0.36 mm, and width of
0.25 were selected for the implant thread design.
All four types of implant collar designs had
parallel-type microgrooves along their length. Previous studies
have shown that the application of microgrooves to the implant surface can direct cellular morphology and cell migration13,14 and improve cell adhesion.13,15,16
The finite element model created in this study was a multilayered complex structure involving a solid implant and a layered specific crown. It is important to note that the stress in different bone qualities may be influenced greatly by the materials and properties assigned to each layer.17,18
The results of this study showed that the maximum Von Mises stresses were observed at the crestal region or the neck of the implant for both threaded and cylindrical types in all the four densities of bone. This is similar to the results obtained by various other studies that dem-onstrated that bone loss begins around the implant neck due to higher bone stresses at the crestal region.19
It was observed that the stresses generated at the cortical bone were more in the convergent collar design and minimum in the divergent collar design under vertical and oblique loading in D2 and D3 bone quality (Graphs 1A and B). This is in similar to the results obtained by Shen et al20 in 2010.
LIMITATIONS
• The structures in the model were all assumed to be homogenous and isotropic and to possess linear elasticity → transversely isotropic and nonhomo-geneous.
• Cement thickness layer was not taken into consider -ation.
CONCLUSION
Within the limitations of this study, the following conclusions were drawn:
• Maximum Von Mises stress was observed at the crestal
region of the bone and collar region of the implants in all the models.
• Divergent collar design results in minimum crestal
bone loss during vertical loading and oblique loading at cortical bone and during vertical loading at implant collar in D2 and D3 types of bone quality.
Collar design
D2 D3
Vertical Oblique Vertical Oblique
Straight 45.3106 494.509 44.89 498.456 Divergent 45.269 511.791 44.1802 515.765 Convergent 66.62 507.909 44.7442 511.028 Step 46.9589 497.572 45.8854 500.749
Collar design
D2 D3
Vertical Oblique Vertical Oblique
Comparative Evaluation of Stress Distribution within Computerized Bone Model IJPCDR
• Convergent collar design results in maximum crestal
bone loss in all the models during both vertical and oblique loading in D2 and D3 quality bone except for oblique loading at implant collar.
• In view of the above conclusions it may be inferred
that the divergent collar design resists the crestal bone loss, gives better response on a mechanical basis, and may be more suitable in both D2 and D3 types of bone.
REFERENCES
1. Misch, CE. Rationale for dental implants. Misch, CE., editor. Dental implant prosthetics. 3rd ed. St Louis: Elsevier; 2005. p. 1-17.
2. Steigenga J, Al-Shammary KF, Nociti FH, Misch CE, Wang H.
Dental implant design and its relationship to long term implant success. Implant Dent 2003;12(4):306-315.
3. Sevimay M, Turhan F, Kiliçarslan MA, Eskitascioglu G. 3-D finite element analysis of the effect of different bone quality
on stress distribution in an implant supported crown. J Prosthet
Dent 2005 Mar;93(3):227-234.
4. Ergatoudis I, Irons BM, Zienkiewicz OC. Curved, isoparametric, quadrilateral elements for finite element analysis. Int J Solids
Struct 1968;4(1):31-42.
5. Rzemieniecki JS. Theory of matrix structural analysis. J Sound
Vibration 1969;10(2):358-359.
6. Akca K, Iplikcioglu H. Finite element stress analysis of the influ -ence of staggered versus straight placement of dental implants. Int J Oral Maxillofac Implants 2001 Sep-Oct;16(5):722-730.
7. Watanabe F, Hata Y, Komatsu S, Ramos TC, Fukuda H. Finite
element analysis of the influence of implant inclination, loading position, and load direction on stress distribution. Odontology 2003 Sep;9(1):31-36.
8. Anusavice, K. Phillips’ science of dental materials. 11th ed.
St. Louis: Elsevier; 2005.
9. Bourke J, Wroe S, Moreno K, McHenry C, Clausen P. Effects
of gape and tooth position on bite force and skull stress in the dingo (Canis lupus dingo) using a 3-D finite element approach.
PLoS One 2008 May 21;3(5):1-5.
10. Holmes DC, Loftus JT. Influence of bone quality on stress
distribution for endosseous implants. J Oral Implantol 1997;23(3):104-111.
11. Van Steenberghe D, Klinge B, Linden U, Quirynen M,
Herrmann I, Garpland C. Periodontal indices around natural
and titanium abutments: a longitudinal multicenter study. J
Periodontol 1993 Jun;64(6):538-541.
12. Kong L, Liu BL, Hu KJ, Li DH, Song YL, Ma P, Yang J.
Optimized thread pitch design and stress analysis of the
cylinder screwed dental implant. Hua Xi Kou Qiang Yi Xue
Za Zhi 2006 Dec;24(6):509-512, 515.
13. Lu J, Rao MP, MacDonald NC, Khang D, Webster TJ. Improved
endothelial cell adhesion and proliferation on patterned titanium surfaces with rationally designed, micrometer to
nanometer features. Acta Biomater 2008 Jan;4(1):192-201. 14. Lamers E, Horssen R, Riet J, Delft CF, Luttge R, Walboomers
XF, Jansen JA. The influence of nanoscale topographical cues
on initial osteoblast morphology and migration. Eur Cell
Mater 2010 Nov9;20:329-343.
15. Loesberg WA, Riet J, Delft FC, Schön P, Figdor CG, Speller S, van Loon JJ, Walboomers XF, Jansen JA. The threshold at
which substrate nanogroove dimensions may influence fibroblast alignment and adhesion. Biomaterials 2007 Sep;
28(27):3944-3951.
16. Lamers E, Walboomers FX, Domanski M, Riet J, Delft FC, Luttge R, Winnubst LA, Gardeniers HJ, Jansen JA. The
influence of nanoscale grooved substrates on osteoblast behaviour and extracellular matrix deposition. Biomaterials 2010 Apr;31(12):3307-3316.
17. Geng JP, Ma QS, Xu W, Tan KB, Liu GR. Finite element analysis
of 4 thread form configurations in a stopped screw implant. J Oral Rehabil 2004 Mar;31(3):233-239.
18. Eskitascioglu G, Usumez A, Sevimay M, Soykan M, Unsal E.
The influence of occlusal loading location on stresses trans-ferred to implant-supported prostheses and supporting bone:
a 3-D finite element study. J Prosthet Dent 2004 Feb;91(2):
144-150.
19. Lin CL, Kuo YC, Lin TS. Effect of dental implant length and bone quality on biomechanical responses in bone around implants: a 3-D linear finite element analysis. Biomed Eng 2005 Feb;17(1): 44-49.
20. Shen WL, Chen CS, Hsel ML. Influence of implant collar
design on stress & strain distribution in crestal compact bone: a 3D finite element analysis. Int J Oral Maxillofac Implants 2010 Sep-Oct;25(5):901-910.
Graphs 1A and B: Von Misses stress at cortical bone: (A) In D2 quality bone, and (B) In D3 quality bone